. 2018 Oct;562(7726):281-285.
doi: 10.1038/s41586-018-0567-3. Epub 2018 Sep 26.

Principles of nucleosome organization revealed by single-cell micrococcal nuclease sequencing

Affiliations

Principles of nucleosome organization revealed by single-cell micrococcal nuclease sequencing

Binbin Lai et al. Nature. 2018 Oct.

Erratum in

Abstract

Nucleosome positioning is critical to chromatin accessibility and is associated with gene expression programs in cells1-3. Previous nucleosome mapping methods assemble profiles from cell populations and reveal a cell-averaged pattern: nucleosomes are positioned and form a phased array that surrounds the transcription start sites of active genes3-6 and DNase I hypersensitive sites7. However, even in a homogenous population of cells, cells exhibit heterogeneity in expression in response to active signalling8,9 that may be related to heterogeneity in chromatin accessibility10-12. Here we report a technique, termed single-cell micrococcal nuclease sequencing (scMNase-seq), that can be used to simultaneously measure genome-wide nucleosome positioning and chromatin accessibility in single cells. Application of scMNase-seq to NIH3T3 cells, mouse primary naive CD4 T cells and mouse embryonic stem cells reveals two principles of nucleosome organization: first, nucleosomes in heterochromatin regions, or that surround the transcription start sites of silent genes, show large variation in positioning across different cells but are highly uniformly spaced along the nucleosome array; and second, nucleosomes that surround the transcription start sites of active genes and DNase I hypersensitive sites show little variation in positioning across different cells but are relatively heterogeneously spaced along the nucleosome array. We found a bimodal distribution of nucleosome spacing at DNase I hypersensitive sites, which corresponds to inaccessible and accessible states and is associated with nucleosome variation and variation in accessibility across cells. Nucleosome variation is smaller within single cells than across cells, and smaller within the same cell type than across cell types. A large fraction of naive CD4 T cells and mouse embryonic stem cells shows depleted nucleosome occupancy at the de novo enhancers detected in their respective differentiated lineages, revealing the existence of cells primed for differentiation to specific lineages in undifferentiated cell populations.


Conflict of interest statement

The authors declare no competing financial interests.

Figures

Extended Data Figure 1.
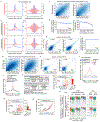
Extended Data Figure 1.. Characterizing scMNase-seq datasets.
a, Mapping rates of reads from 100 human cells (left two experiments) or 100 mouse cells (right three experiments) against human genome (blue) and mouse genome (orange) were shown. The cells were sorted from pre-mixed and MNase-digested human and mouse cells. These data show that there is little contamination of DNA of one cell from another cell. b, Fragment length density of pooled scMNase-seq for NIH3T3 cells, pooled scMNase-seq and bulk-cell MNase-seq for T cells and mESCs. c, Box plots of fragment ratio (subnucleosome-sized particle / nucleosome) for NIH3T3, naïve CD4 T cell and mESC scMNase-seq libraries. Single cell libraries were grouped by biologically independent experiments. Refer to Supplementary Table 1 for the library number for each group. The center line, median; boxes, first and third quartiles; whiskers, 1.5× the interquartile range. d, Plot of non-redundant (NR) read number (x-axis) and sequencing redundancy (y-axis) for NIH3T3, CD4 T and mES single cells. e, Plot of NR nucleosome reads (x-axis) and percentage of nucleosomes with overlapping piles ≥3 (y-axis). The plot suggests the polyploid of NIH3T3 cells. f, Nucleosome density at different genomic regions for NIH3T3, CD4 T cell, and mESC scMNase-seq libraries reveal that the nucleosomes in different genomic regions were similarly detected and represented by scMNase-seq.
Extended Data Figure 2.
Extended Data Figure 2.. Characterizing pooled scMNase-seq data and subnucleosome-sized particles.
a, Average density profiles of nucleosomes (red) and subnucleosome-sized particles (blue) relative to TSS of active genes (left) and CTCF binding sites (right) for bulk cell naïve CD4 T bulk cell MNase-seq data. b, Average density profiles of nucleosomes (red) and subnucleosome-sized particles (blue) relative to TSS of active genes (left) and CTCF binding sites (right) for pooled mESC scMNase-seq data (top) and bulk cell mESC MNase-seq data (bottom). c, Smoothed scatter plot for the fraction of nucleosome occupied at 8,929 DHS center selected from top 10,000 DHSs (see Methods for criteria) for pooled scMNase-seq (x-axis) versus bulk cell MNase-seq (y-axis) for T cells (left). Pearson correlation coefficient was indicated. As a positive control, the scatter plot for two bulk MNase-seq replicates were also shown (right). d, Pearson correlation coefficient for fraction of nucleosomes occupied at DHS center between pooled sub-sampled CD4 T cell scMNase-seq libraries and bulk cell MNase-seq as a function of sub-sampled cell number (left). Percentage of top 10,000 DHSs represented in the comparison, i.e. the sample size in upper panel, as a function of sub-sampled cell number are also shown (right). e, Smoothed scatter plot for subnucleosome-sized particle density at 83,229 DHSs (h) for pooled scMNase-seq (x-axis) versus bulk cell MNase-seq (y-axis) for T cells (left). Pearson correlation coefficient was indicated. As a positive control, the scatter plot for two bulk MNase-seq replicates were also shown (right). f, Pearson correlation coefficient for subnucleosome-sized particle density between pooled sub-sampled T cell scMNase-seq libraries and bulk cell MNase-seq at 83,229 DHSs as a function of sub-sampled cell number. g-h, Smoothed scatter plot for the fraction of nucleosomes occupied at 8,449 DHS center selected from top 10,000 DHSs (see Methods for criteria) (g) and subnucleosome-sized particle density at 94,250 DHSs (h) for pooled scMNase-seq (x-axis) versus bulk cell MNase-seq (y-axis) for mESCs. Pearson correlation coefficient was indicated. As a positive control, the scatter plot for two bulk MNase-seq replicates were also shown. i-j, Average density profiles of subnucleosome-sized particles around TSSs for gene subgroups with different expression levels (i) and around DHSs for DHS subgroups with different DNase I tag densities (j). k, Table showing the mapping statistics for 198 mESC scMNase-seq libraries and 96 mESC scATAC-seq libraries from publication (Buenrostro et al.). l-m, Scatter plots of number of non-redundant (NR) reads (l, y-axis) and percentage of recovered DHSs (m, y-axis) versus sequencing redundancy (x-axis) for scMNas-seq subnucleosome particles (red, n = 198 single cell libraries) and scATAC-seq reads (grey, n = 96 single cell libraries). Box plots (right) showing the values from left scatter plots for cells with redundancy ranging from 50% to 70% (blue rectangle in the left panel; red, n = 49; grey, n = 58) for two methods. n, Scatter plot showing percentage of recovered DHSs (y-axis) versus number of NR reads for scMNas-seq subnucleosome particles (red, n = 198 single cell libraries) and scATAC-seq reads (grey, n = 87 single cell libraries). o, Aggregated nucleosome profile similarity score at DHSs for different groups of DHSs (left) and two promoter groups (right) for comparison between pooled scMNase-seq and bulk cell MNase-seq (upper) and between two bulk cell MNase-seq replicates (lower). The DHS groups are classified by three positioning stringency levels (low: positioning score (PS) <0.45, moderate: 0.45 < PS <0.65, high: PS > 0.65) and three nucleosome coverage levels (high: ≥15; moderate: 10-15; low: 5-9). The DHS numbers for each group are: low PS and high coverage, n = 803; low PS and moderate coverage, n = 531; low PS and low coverage, n = 450; moderate PS and high coverage, n = 701; moderate PS and moderate coverage, n = 592; moderate PS and low coverage, n = 588; high PS and high coverage, n = 162; high PS and moderate coverage, n = 230; high PS and low coverage, n = 395. The number of promoters for each group: active, n = 6,777; silent, n = 418. Boxplot definition in panels i,m,o: center line, median; boxes, first and third quartiles; whiskers, 1.5× the interquartile range; notch, 95% confidence interval of the median.
Extended Data Figure 3.
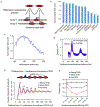
Extended Data Figure 3.. Measuring nucleosome spacing uniformness in single cells.
a, Cartoon illustrates that nucleosome spacing uniformness can be measured by nucleosome-to-nucleosome distance density. Uniformly spaced nucleosomes in a single array result in sharp and high peaks while non-uniformly spaced nucleosomes result in flat peaks or no peaks. Nucleosomes from mixed arrays also result in flat peaks even they are uniformly spaced. b, The nucleosome phasing and relative peak height gradually decreased as the number of mixed cells increases, which indicates cellular heterogeneity of nucleosome organization across different cells. c, Nucleosome space phasing and relative peak height do not change when reducing the library size (number of sequence reads) to 1/2, 1/3, and 1/4. d, Density plots of nucleosome-to-nucleosome distance (upper) and relative peak height in density plot (bottom) for nucleosomes with different positioning stringency for bulk-cell MNase-seq, pooled 48 single cells, one representative single cell and 48 single-cell scMNase-seq datasets.
Extended Data Figure 4.
Extended Data Figure 4.. Nucleosome spacing uniformness is higher in silent heterochromatin region than in active chromatin region.
a-b, Density plots of nucleosome-to-nucleosome distance (top) and relative peak height (bottom) for nucleosomes at active or silent promoters and DHS or non-DHS regions for T cells (a) and mESCs (b). c, Relative peak height of nucleosome-to-nucleosome distance density plots for nucleosomes in DHS (red) and non-DHS regions (blue) for low coverage cells (top) and high coverage cells (bottom). d, Density plots of nucleosome-nucleosome distance (top) and relative peak height (bottom) for diploid (black) and haploid (red) mESCs. e, Density plots of nucleosome-nucleosome distance (top) and relative peak height (bottom) at DHS and non-DHS regions for haploid mESCs. f, Mapped nucleosome count normalized by chromosome length at chromosome 1, X, and Y for mESCs and CD4 T cells suggest that mESCs are derived from male mouse. g, Density plots of nucleosome-nucleosome distance at DHS and non-DHS regions at chromosome X for mESCs. h, Violin plots of library size (total NR reads) for NIH3T3 scMNase-seq libraries treated with three MNase concentrations (0.1 unite (0.1U), 0.6 unit (0.6U), and 2.4 unit (2.4U) MNase per million cells). Each condition has 10 single cell libraries. Violin plot: center dot, mean; inner layer, the interquartile range. i-j, Fragment length density of pooled scMNase-seq data with three MNase concentrations. j, Average density profiles of all reads (left) and nucleosome reads with length between 140 and 180 bp (right) around TSSs of active genes (i) and CTCF binding sites (j) for pooled scMNase-seq with three MNase concentrations. l-m, Density plots of nucleosome-nucleosome distance (l) and relative peak height (m) at DHS (red) and non-DHS (blue) regions for scMNase-seq treated by 0.6U (left) and 2.4U (right) MNase concentrations. n-o, Density plots of nucleosome-to-nucleosome distance (n) and relative peak height (o) for nucleosomes within genomic regions marked by different histone modifications.
Extended Data Figure 5.
Extended Data Figure 5.. Nucleosome positioning variation within a cell or across different single cells around the center of DHS or histone modification peaks.
a, Cartoon illustrating the definition of nucleosome variance within a cell or across different single cells. b-c, Heat maps showing the distribution of nucleosome variance at the position relative to DHS center within cells (b) or across different single cells (c). d, Nucleosome variance within a cell (red) and across single cells (blue) becomes smaller when getting closer to DHS center. e, Calculations of mean value of nucleosome variance from two ranges (3-82 bp and 0-82 bp) reveal the same trend of increase when nucleosomes become farther away from DHS center. f-g, Average profiles of nucleosome variance at the position relative to the center of histone modification peaks within cells (e) or across different cells (f).
Extended Data Figure 6.
Extended Data Figure 6.. Nucleosomes show synchronized shift in silent gene promoters and heterochromatin regions and show compressed spaceing flanking DHS centers.
a, Cartoon illustrates synchronized shift of adjacent nucleosomes within single nucleosome arrays. b, Bar plot showing synchronized shift score for different genomic regions. Silent promoter: silent gene promoter; active promoter: active gene promoter; not marked: regions not marked by any histone modifications as shown; DHS: ±2000 bp region surrounding DHS center; non-DHS: intervals of DHS regions. c, Synchronized shift score for nucleosome pairs with different nucleosome space distances. d, Density plot of nucleosome-to-nucleosome distance in single cells reveals dominant nucleosome space at ~182 bp. e, Density plot of nucleosome spacing in the regions flanking strong and weak DHSs as well as non-DHSs. f, Distances between each pair of nucleosomes in the chromatin regions flanking strong DHS, weak DHS or non-DHS described in (e).
Extended Data Figure 7.
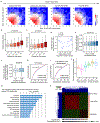
Extended Data Figure 7.. Heterogeneity of nucleosome spacing and positioning around DHS across different single cells.
a, Heat maps showing DHS frequency as a function of number of cells with the narrow spacing (x-axis) and number of cells with the wide spacing (y-axis) for four DHS subgroups with different tag densities. Numbers indicate percentage of DHSs that have more wide space than narrow space. b-c, Boxplots showing the accessibility level from cell population measured by DNase-seq tag density (b) and pooled scMNase-seq subnucleosome-sized particle density (c) for 5 groups of DHSs defined by fraction of wide space. Data represents values on 612, 2,088, 3,858, 2,500, and 1,586 DHSs (left to right). d, Scatter plot of the ratio of wide to narrow space at DHS in a single cell (x-axis) and fragment size ratio of subnucleosome-sized particles to nucleosomes (y-axis) on 48 NIH3T3 sc MNase-seq libraries. Pearson correlation coefficient and P-value were indicated. P-value is the probability that one would have found the current result if the correlation coefficient were in fact zero (null hypothesis), and was calculated using R package. e, Boxplot showing fraction of cells with positioned nucleosomes around a DHS for different groups of DHSs. DHSs were grouped based on the number of cells detected as DHS in scDNase-seq experiment. Number of DHSs for each group was 44,040, 15,622, 11,056, 8,009, 4,063, and 1,180 (from left to right). f, Boxplot showing fraction of cells with a positioned +1 nucleosome for two groups of genes sorted by expression variation (Low, n = 1,171; High, n = 1,174). g, GO analysis of top 1000 active genes with smallest nucleosome variance across cells. Significant GO terms with P-value were reported by David Bioinformatics Resources (v6.7). h, Density plot showing nucleosome variance around DHSs for within a cell (n = 73,274 nucleosome pairs) and across different cells (n = 752,398 nucleosome pairs). i, Cumulative density plot for nucleosome variation at +1 nucleosome relative to TSS of active genes for within cell (red, n = 11,388 nucleosome pairs) and across cells (blue, n = 237,006). j, Boxplot showing nucleosome variance around DHSs across cells for within a cell type (3T3-3T3, n = 1,128 nucleosome pairs; T-T, n = 23,936; ES-ES, n = 5,775) and across different cell types (3T3-T, n = 11,856; 3T3-ES, n = 6,962; T-ES, n = 20,442). k, Heat map reveals clustering of NIH3T3 cells, T cells and mESCs based on cell-to-cell nucleosome dissimilarity score around DHSs. Color bar on the right indicates cell types and color bars on the bottom indicates experiment time and fragment size ratio. P values in panels b, c, e, f, h, and i were calculated using one-sided Mann-Whitney rank test. Boxplot definition: center line, median; boxes, first and third quartiles; whiskers, 1.5× the interquartile range; notch, 95% confidence interval of the median.
Extended Data Figure 8.
Extended Data Figure 8.. Cell-to-cell single base variation is associated with nucleosome positioning variation and gene expression variation across different single cells.
a, CC/GG/GC frequency is higher in nucleosome occupied region than in flanking region while AA/TT/AT/TA frequency shows an opposite pattern. b, CC/GG/GC frequency in flanking regions increases as nucleosome variance within a cell (left) or across different single cells (right) increases. c, AA/TT/AT/TA frequency in flanking regions decreases as nucleosome variance within a cell (left) or across different single cells (right) increases. d, Nucleosome variances within a cell and across different single cells are reversely correlated with AA/TT/AT/TA percentage in flanking regions. e, Weblogos for sequence preferences across MNase cleavage sites are shown for subgroups of nucleosomes with different positioning variance across cells. f, An example showing a CTCF motif with the reference base (green) in some cells and alternative base (red) in other cells. scMNase-data show that the reference base is associated with subnucleosome-sized particles while the alternative base is associated with the nucleosome structure. Fragments from DNase-seq and CTCF ChIP-seq datasets within the window are also shown with the bases at SNP location highlighted. Tracks for tag densities of CTCF ChIP-seq, DNase-seq, and nucleosomes and subnucleosome-sized particles from pooled single cells are shown in a zoom-out window. g, The number of CTCF motif matches containing alternative/reference base at the SNP locus occupied by nucleosomes, subnucleosome-sized particles, sequence reads obtained by DNase-seq and by CTCF ChIP-seq. P-value was calculated using one-sided Fisher’s exact test. The ratio between alternative to reference base was also shown (bottom panel). h, SNP frequency is correlated with nucleosome variation across different single cells. Variant frequencies at each position relative to nucleosome midpoint for four nucleosome subgroups with different levels of nucleosome variance across cells are shown. i, SNP frequency within TF motifs at DHSs for 4 DHS subgroups sorted by nucleosome variance around DHS across different single cells (each subgroup has 22,139 DHSs that contains at least one TF motif match). j, SNP frequency within TF motifs at DHSs in promoters for gene subgroups sorted by expression variation across different single cells (each subgroup has 2,136 genes). P value in panels i,j is defined as the probability of observing a larger difference than current result between two groups by random. P value calculation was described in Methods.
Extended Data Figure 9.
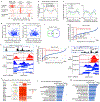
Extended Data Figure 9.. Characterization of primed enhancers in undifferentiated naïve CD4 T cells.
a, Heat maps show H3K27ac in naïve T cells and p300 in Th1 and Th2 cells around naïve T-specific, Th1-specific and Th2-specific enhancers. b, Profile of nucleosome occupancy from pooled naïve T scMNase-seq around T-specific, Th1-specific, and Th2-specific enhancers. c, Normalized nucleosome occupancy within ±200 bp from the center of de novo Th1 enhancers (left) or de novo Th2 enhancers (right) for subgroups of T cells primed for Th1 cells (green), Th2 cells (blue) or none (black). d-e, Plots of fragment size ratio of subnucleoosme-sized particles to nucleosomes versus nucleosome occupancy score at de novo Th1 (c) and Th2 (d) enhancers for 237 naïve CD4 T cells reveal that nucleosome occupancy score is not correlated with fragment size ratio. Pearson correlation coefficient and P value are indicated. P-value is the probability that one would have found the current result if the correlation coefficient were in fact zero (null hypothesis), and was calculated using R package. f, Subgroups of naïve CD4 T cells primed for Th1 and Th2 do not have much overlap. g, Plots of de novo Th1 enhancers ranked based on nucleosome occupancy difference between pooled primed cells and the non-primed cells (y-axis, Methods). Enhancers associated with key genes for Th1 were labeled by genes along with ranks. h, Nucleosome positions in pooled or single primed (red) and non-primed (blue) cells at de novo Th1-specific enhancers for Ifng gene. i, Plots of de novo Th2 enhancers ranked based on nucleosome occupancy difference between pooled primed cells and the non-primed cells (y-axis, Methods). Enhancers associated with key genes for Th2 were labeled by genes along with ranks. j, Nucleosome positions in pooled or single primed (red) and non-primed (blue) cells at de novo Th2-specific enhancers for Il4 gene. k, Motifs enriched in top 1000 Th1/Th2-primed enhancers were shown. l-m, Gene ontology analysis for top 1000 Th1-primed (l) and Th2-primed (m) enhancers. Significant GO terms with P values were reported by GREAT v3.0.0.
Extended Data Figure 10.
Extended Data Figure 10.. Characterization of primed enhancers in undifferentiated mESCs.
a, Heat maps show H3K27ac in mESCs and EB cells and p300 in EB cells around mESC-specific and EB-specific enhancers. b, Profile of nucleosome occupancy from pooled mES scMNase-seq around mESC-specific and EB-specific enhancers. c, Normalized nucleosome occupancy within ±200 bp from the center of de novo EB enhancers for subgroups of mESCs that are primed for EB (red) or not primed for EB (black). d, Plots of fragment size ratio of subnucleosome-sized particles to nucleosomes versus nucleosome occupancy score at de novo EB enhancers for 144 mESCs. Pearson correlation coefficient and P value are indicated. P-value is the probability that one would have found the current result if the correlation coefficient were in fact zero (null hypothesis), and was calculated using R package. e, Plots of de novo EB enhancers ranked based on nucleosome occupancy difference between pooled primed cells and the non-primed cells. Enhancers associated with key genes for EB cells were labeled by genes along with ranks. f, Nucleosome positions in pooled or single primed (red) and non-primed (blue) cells at de novo EB-specific enhancers for Brachyury gene. g, GO analysis for top 1000 EB-primed enhancers. Significant GO terms with P values were reported by GREAT v3.0.0.
Figure 1.
Figure 1.. scMNase-seq measures simultaneously the position of both nucleosome and subnucleosome-sized particles in single cells.
a, Schema of scMNase-seq. b, Plot of non-redundant nucleosome read number (x-axis) and genomic coverage of nucleosomes (y-axis) for NIH3T3, CD4 T and mES single cells. c, Average density profiles of nucleosomes (red) and subnucleosome-sized particles (blue) relative to TSS of active genes (left) and CTCF binding sites (right) for pooled CD4 T scMNase-seq data. d, Genome browser view of single-cell nucleosome positions for NIH3T3, CD4 T cell, and mESCs at TSSs of three representative cell type specific gene loci. Single cell libraries that have at least one nucleosome within any of three genomic regions were shown. Tracks for tag density of corresponding bulk cell MNase-seq data (one representative from two repeated experiments was shown) and pooled scMNase-seq data (all single cell libraries were included) were also shown. The nucleosome maps at expressed genes for each cell type were highlighted with pink rectangle. The expression levels of genes were shown in the heat map above the tracks.
Figure 2.
Figure 2.. Profiling nucleosome positioning in single cells reveals distinct nucleosome organization principles at active and silent chromatin regions.
a, Density plots of nucleosome-to-nucleosome distance within active gene promoters (upper) and silent gene promoters (bottom) for bulk-cell MNase-seq, pooled 48 NIH3T3 single cells, one representative single cell and 48 single-cell scMNase-seq datasets. b, The relative peak heights based on the data from panel (a) reveals higher degree of spacing uniformness within silent gene promoters than active gene promoters. c. Density plots of nucleosome-to-nucleosome distance within DHS regions (upper) and non-DHS regions (bottom) for bulk-cell MNase-seq (blue) and 48 single-cell scMNase-seq (red) datasets. d, The relative peak heights based on the data from panel (c) reveals higher degree of spacing uniformness within non-DHS regions than DHS regions. e, Cumulative density of nucleosome positioning variance of active genes and silent genes within a cell (upper) and across single cells (bottom) at−1 (left) and +1 (right) nucleosomes relative to TSS. Upper left panel, n = 7,574 nucleosome-pairs for active genes; n = 13,107 for silent genes; bottom left, n = 164,512 for active genes, n = 304,847 for silent genes; upper right, n = 11,388 for active genes, n = 17,631 for silent genes; bottom right, n = 237,006 for active genes, n = 416,328 for silent genes. P values were calculated using one-sided Mann-Whitney rank test. f, Cartoon illustrating nucleosome organization patterns in silent (left) and active (right) chromatin states.
Figure 3.
Figure 3.. The bimodal distribution of nucleosome spacing across DHSs is associated with the cell-to-cell variation of nucleosome positioning and chromatin accessibility.
a, Schema of nucleosome spacing across a DHS and two chromatin states inferred by nucleosome spacing. b, Density plot of nucleosome spacing across a DHS within single cells reveals two peaks corresponding to narrow spacing (blue) and wide spacing (red). c, Heat map shows DHS frequency as a function of number of cells with narrow spacing and number of cells with wide spacing. Percentage of DHSs where there are both types of spacing across a DHS in different single cells is shown. d-e, Boxplots showing the cell-to-cell variation of nucleosome position (d) and chromatin accessibility (e) for 5 groups of DHSs defined by fraction of wide space. Data represents 612, 2,088, 3,858, 2,500, and 1,586 DHSs (left to right). f, Scatter plot showing nucleosome variance (y-axis) and DHS variation (x-axis) across cells for 106 bins of DHSs based on DHS variation. Each dot represents the average from 500 DHSs for each bin. Pearson’s correlation was calculated. g, Boxplot showing nucleosome variation at +1 nucleosome relative to TSS for two groups of genes sorted by expression variation (Low, bottom 25% (n = 1,171 genes); high, top 25% (n = 1,174 genes)). d, e, and g, P values were calculated by one-sided Mann-Whitney rank test. Boxplot definition: center line, median; boxes, first and third quartiles; whiskers, 1.5× the interquartile range; notch, 95% confidence interval of the median.
Figure 4.
Figure 4.. A subgroup of undifferentiated cells shows a nucleosome signature primed for differentiation.
a,b A large fraction of naïve CD4 T cells shows decreased nucleosome occupancy at the de novo enhancers that are formed either in Th1 (a, top) or Th2 cells (a, bottom), while only a small fraction of mESCs and NIH3T3 cells shows nucleosome depletion at the same enhancers. In contrast, a large fraction of mESCs shows depleted nucleosomes at the de novo enhancers that are formed in EBs, while only a small fraction of naïve CD4 T cells and NIH3T3 cells shows nucleosome depletion at the same enhancers (b). The fractions of primed cells are shown in red. Data represents 237 naïve T single cells, 143 mES single cells, and 48 3T3 single cells.

Comment in

  • Spotlight on nucleosomes.
    Clyde D. Clyde D. Nat Rev Genet. 2018 Dec;19(12):738-739. doi: 10.1038/s41576-018-0070-6. Nat Rev Genet. 2018. PMID: 30367164 No abstract available.

Similar articles

Cited by

References

    1. Shivaswamy S et al.Dynamic remodeling of individual nucleosomes across a eukaryotic genome in response to transcriptional perturbation. PLoS Biol. 6, e65 (2008). - PMC - PubMed
    1. Lam FH, Steger DJ & O’Shea EK Chromatin decouples promoter threshold from dynamic range. Nature 453, 246–250 (2008). - PMC - PubMed
    1. Schones DE et al.Dynamic regulation of nucleosome positioning in the human genome. Cell 132, 887–898 (2008). - PMC - PubMed
    1. Albert I et al.Translational and rotational settings of H2A.Z nucleosomes across the Saccharomyces cerevisiae genome. Nature 446, 572–576 (2007). - PubMed
    1. Mavrich TN et al.A barrier nucleosome model for statistical positioning of nucleosomes throughout the yeast genome. Genome Res. 18, 1073–1083 (2008). - PMC - PubMed

Publication types

MeSH terms