. 2018 Oct;562(7726):268-271.
doi: 10.1038/s41586-018-0566-4. Epub 2018 Sep 26.

Common genetic variants contribute to risk of rare severe neurodevelopmental disorders

Affiliations

Common genetic variants contribute to risk of rare severe neurodevelopmental disorders

Mari E K Niemi et al. Nature. 2018 Oct.

Abstract

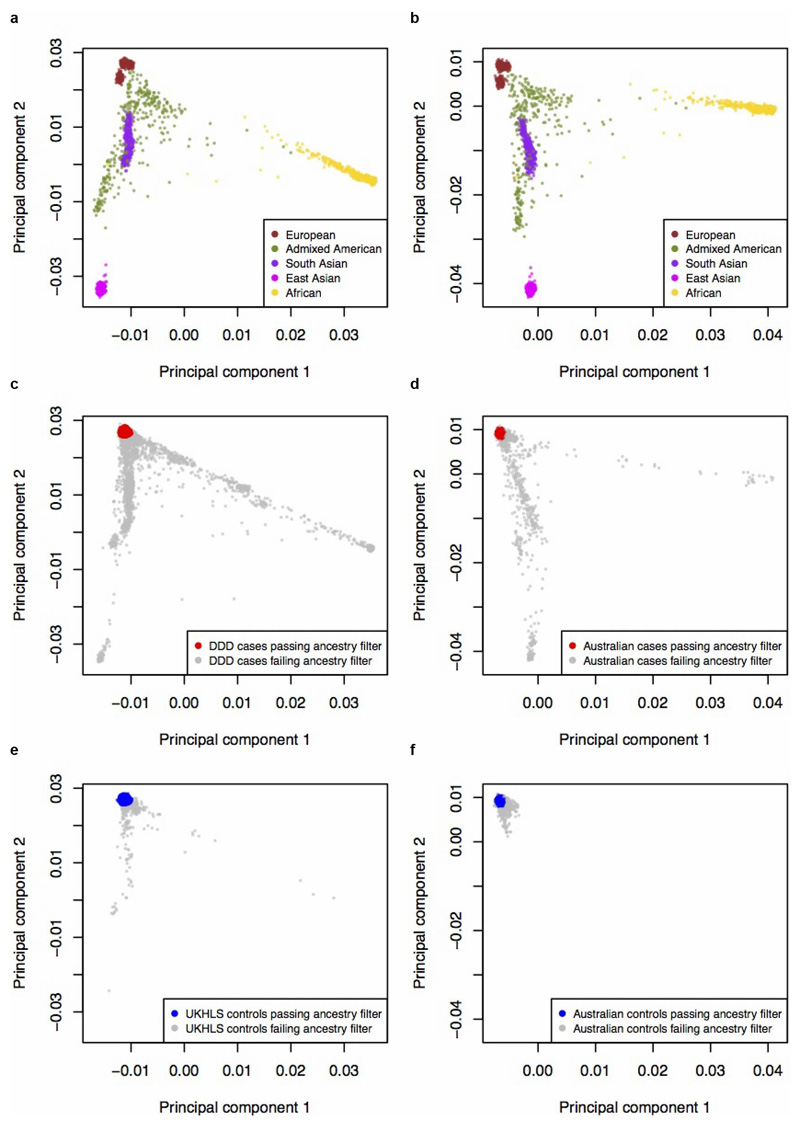
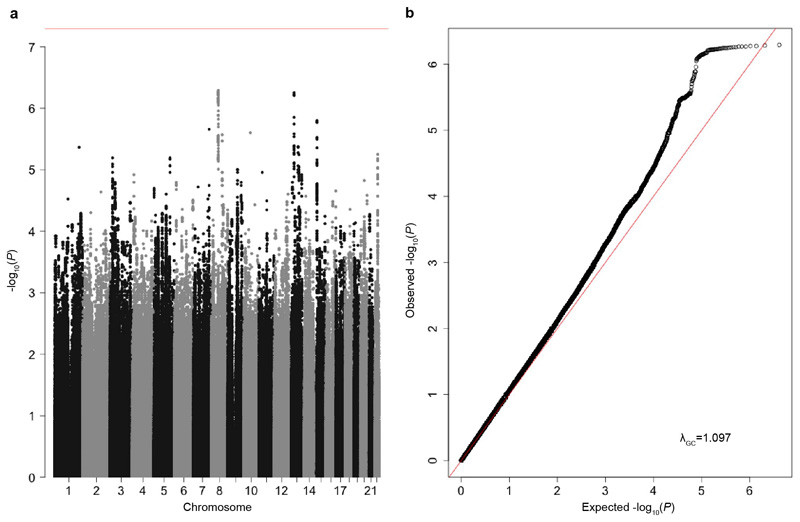
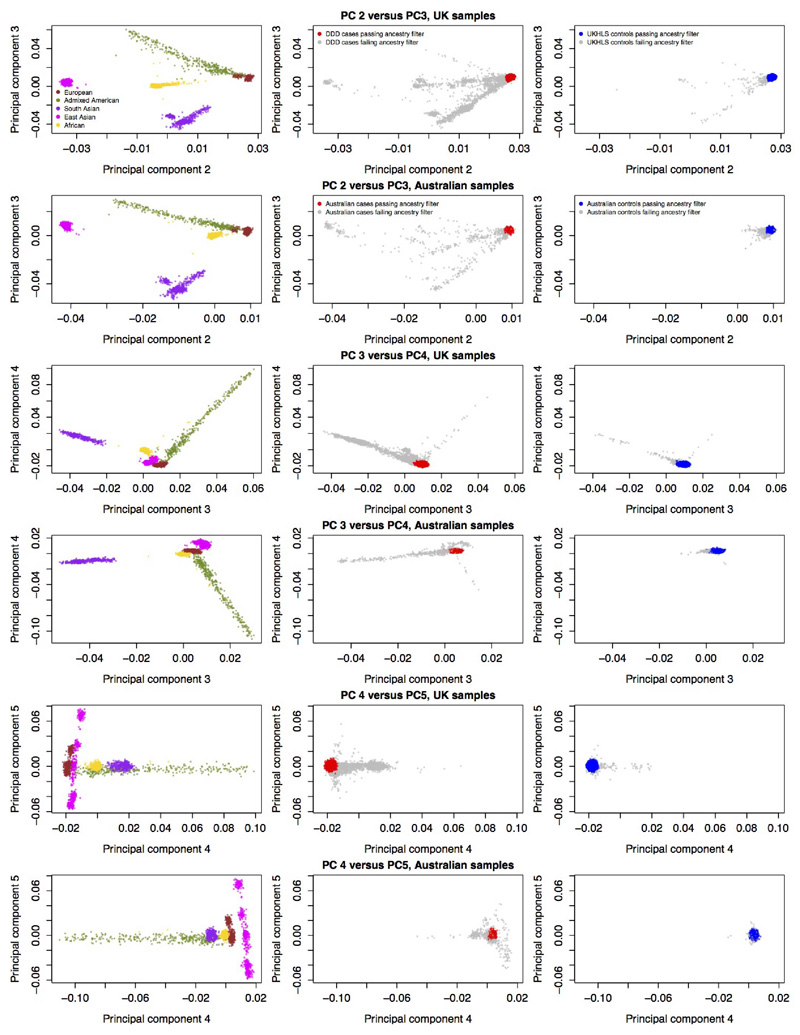
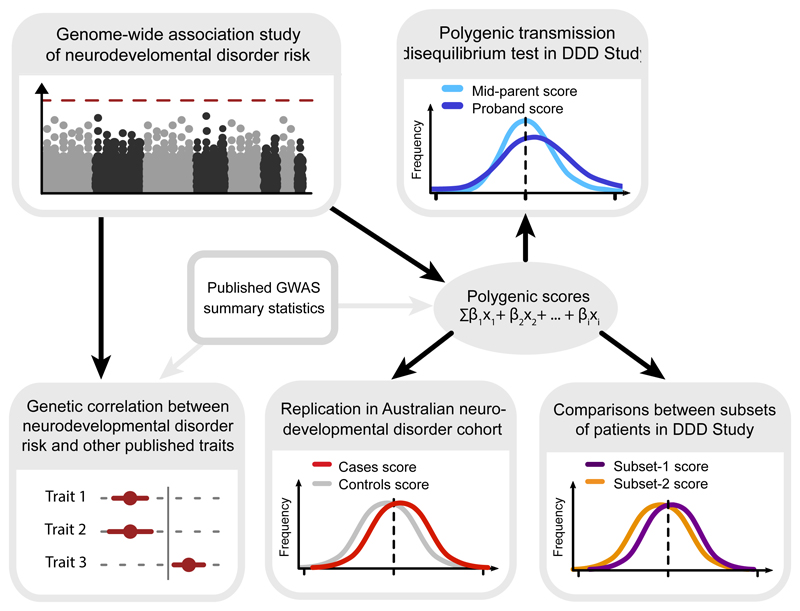
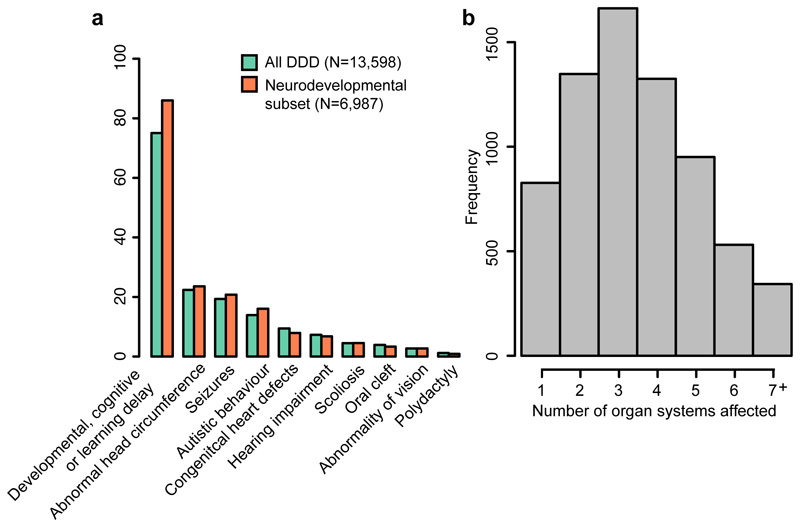
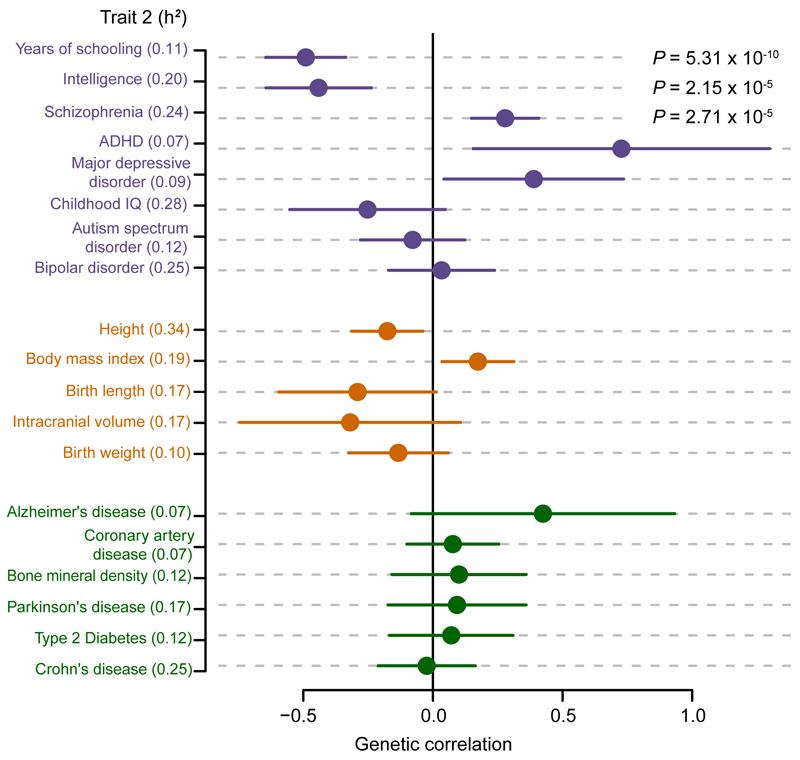
There are thousands of rare human disorders that are caused by single deleterious, protein-coding genetic variants1. However, patients with the same genetic defect can have different clinical presentations2-4, and some individuals who carry known disease-causing variants can appear unaffected5. Here, to understand what explains these differences, we study a cohort of 6,987 children assessed by clinical geneticists to have severe neurodevelopmental disorders such as global developmental delay and autism, often in combination with abnormalities of other organ systems. Although the genetic causes of these neurodevelopmental disorders are expected to be almost entirely monogenic, we show that 7.7% of variance in risk is attributable to inherited common genetic variation. We replicated this genome-wide common variant burden by showing, in an independent sample of 728 trios (comprising a child plus both parents) from the same cohort, that this burden is over-transmitted from parents to children with neurodevelopmental disorders. Our common-variant signal is significantly positively correlated with genetic predisposition to lower educational attainment, decreased intelligence and risk of schizophrenia. We found that common-variant risk was not significantly different between individuals with and without a known protein-coding diagnostic variant, which suggests that common-variant risk affects patients both with and without a monogenic diagnosis. In addition, previously published common-variant scores for autism, height, birth weight and intracranial volume were all correlated with these traits within our cohort, which suggests that phenotypic expression in individuals with monogenic disorders is affected by the same variants as in the general population. Our results demonstrate that common genetic variation affects both overall risk and clinical presentation in neurodevelopmental disorders that are typically considered to be monogenic.


Conflict of interest statement

Competing interests

M.E.H. is a co-founder of, consultant to, and holds shares in, Congenica Ltd, a genetics diagnostic company. J.C.B is an employee of Genomics plc.

Figures

Extended Data Figure 1
Extended Data Figure 1. Ancestry principal components analysis of UK and Australian samples.
Reference samples (N=2,504) from 1000 Genomes Phase 3, coloured by the five super populations, used for a projection PCA of (a) UK cohorts (DDD and UKHLS), or (b) Australian cohorts c, All DDD cases (discovery N=11,304 and from trios N=930), and d, all Australian cases (N=2,283) from their respective projection PCA with 1000 Genomes. Case samples with European ancestry are plotted in red and non-Europeans in grey. e, All UKHLS controls (N=10,396) and f, all Australian controls (N=4,274) from their respective projection PCA with 1000 Genomes. Control samples with European ancestry are plotted in blue and non-Europeans in grey. All cases and controls coloured in grey (panels c, d, e and f) were excluded from analysis due to non-European ancestry. UK cohorts are plotted after removal of samples that failed quality control, and Australian cohorts before removal of samples failing quality control.
Extended Data Figure 2
Extended Data Figure 2. Discovery GWAS of neurodevelopmental disorder risk.
a. Manhattan plot of neurodevelopmental disorder discovery GWAS, with 6,987 DDD cases and 9,270 ancestry-matched UKHLS controls (both European ancestry), using 4,134,438 variants MAF≥5% chr1-22. P-values were from a two-tailed chi squared distribution. Red line = threshold for genome-wide significance (P=5x10⁻⁸). b. Quantile-quantile plot of neurodevelopmental disorder discovery GWAS. Red line = expected values under the null.
Extended Data Figure 3
Extended Data Figure 3. Ancestry principal components analysis of UK and Australian samples (PCs 2-5).
Reference samples (N=2,504) from 1000 Genomes Phase 3, colored by the five super populations, are plotted on the left hand side, from projection PCAs with UK cohorts. Middle panels show the PCs plotted for DDD cases (discovery N=10,556 and from trios N=911) (UK samples) and Australian cases (N=2,283). Red=European ancestry case samples, grey=non-European samples, which were excluded from analyses. Right hand panels show PCs for UKHLS controls (N=10,396) (UK samples) and Australian controls (N=4,274). Blue=European ancestry control samples, grey=non-European samples, which were excluded from analyses. UK cohorts are plotted after removal of samples that failed quality control, and Australian cohorts before removal of samples that failed quality control.
Figure 1
Figure 1. Outline of analysis exploring the contribution of common variants to risk of severe neurodevelopmental disorders.
We first conducted a discovery GWAS in a large dataset of neurodevelopmental disorder patients, and replicated the common variant contribution by analysing polygenic transmission in independent trios from the same cohort. Next, we looked for overlap of common variant effects between neurodevelopmental disorder risk and other published GWAS, and replicated these findings in an independent Australian cohort. Finally, we explored how polygenic effects were distributed within our discovery patient cohort, and whether common variants contributed to expressivity of specific phenotypes.
Figure 2
Figure 2. Patients recruited to the DDD study have diverse phenotypes.
A. Examples of specific phenotypes affecting different organ systems, observed in the full DDD cohort and the neurodevelopmental subset of patients. B. Distribution of the number of distinct organ systems affected in the set of 6,987 patients with neurodevelopmental abnormalities (Methods).
Figure 3
Figure 3. Genetic correlations between neurodevelopmental disorder risk (6,987 cases and 9,270 controls) against nineteen other traits.
Cognitive/psychiatric (purple), anthropometric (orange) and negative control traits (green), with SNP heritability (h2) displayed for the trait. SNP heritability for dichotomous traits is displayed on the liability scale. Genetic correlation was calculated using bivariate LD score correlation, with the bars representing 95% confidence intervals (using standard error) before correction for multiple testing. Uncorrected P-values are from a two-sided z-score, and are only shown if they pass Bonferroni correction for 19 traits. Sample sizes for 19 other GWAS are shown in Extended Data Table 2.

References

    1. Boycott KM, et al. International Cooperation to Enable the Diagnosis of All Rare Genetic Diseases. Am J Hum Genet. 2017;100:695–705. - PMC - PubMed
    1. Owen CI, et al. Extending the phenotype associated with the CSNK2A1-related Okur-Chung syndrome-A clinical study of 11 individuals. Am J Med Genet A. 2018 doi: 10.1002/ajmg.a.38610. - DOI - PubMed
    1. Singh T, et al. Rare loss-of-function variants in SETD1A are associated with schizophrenia and developmental disorders. Nat Neurosci. 2016;19:571–577. - PMC - PubMed
    1. Balasubramanian M, et al. Delineating the phenotypic spectrum of Bainbridge-Ropers syndrome: 12 new patients with de novo, heterozygous, loss-of-function mutations inASXL3and review of published literature. J Med Genet. 2017;54:537–543. - PubMed
    1. Minikel EV, et al. Quantifying prion disease penetrance using large population control cohorts. Sci Transl Med. 2016;8:322ra9. - PMC - PubMed

Publication types