

NeuroArray: A Customized aCGH for the Analysis of Copy Number Variations in Neurological Disorders
- PMID: 30258275
- PMCID: PMC6128384
- DOI: 10.2174/1389202919666180404105451
NeuroArray: A Customized aCGH for the Analysis of Copy Number Variations in Neurological Disorders
Abstract
Background: Neurological disorders are a highly heterogeneous group of pathological conditions that affect both the peripheral and the central nervous system. These pathologies are characterized by a complex and multifactorial etiology involving numerous environmental agents and genetic susceptibility factors. For this reason, the investigation of their pathogenetic basis by means of traditional methodological approaches is rather arduous. High-throughput genotyping technologies, including the microarray-based comparative genomic hybridization (aCGH), are currently replacing classical detection methods, providing powerful molecular tools to identify genomic unbalanced structural rearrangements and explore their role in the pathogenesis of many complex human diseases.
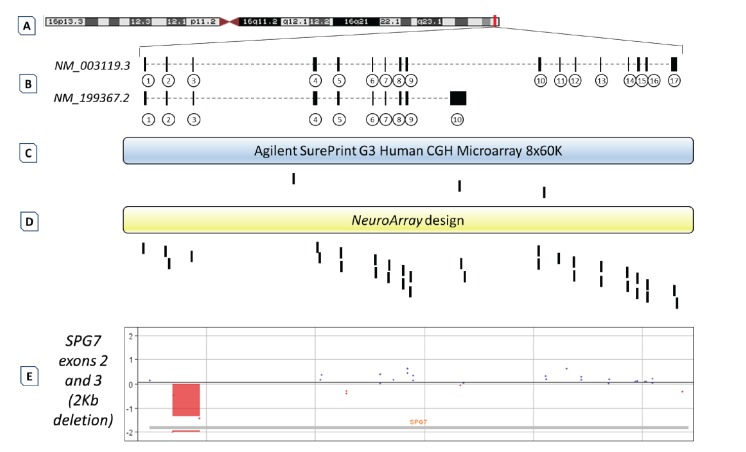
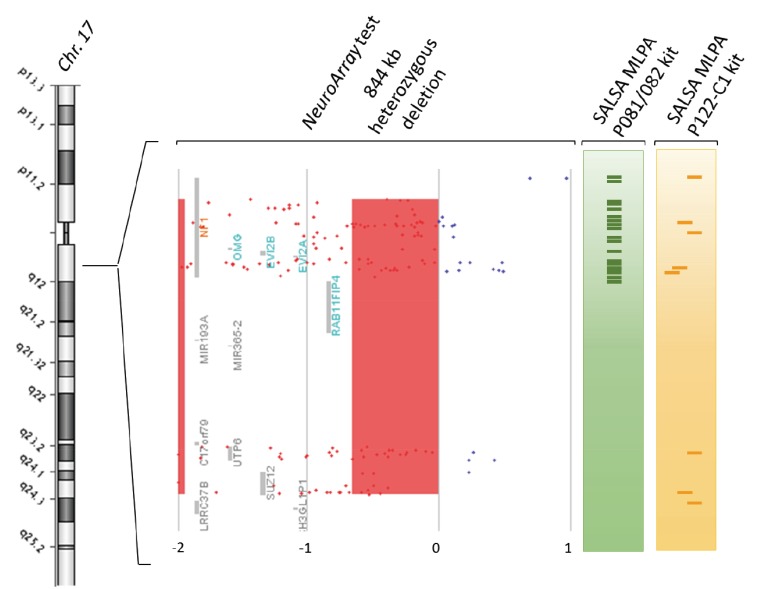
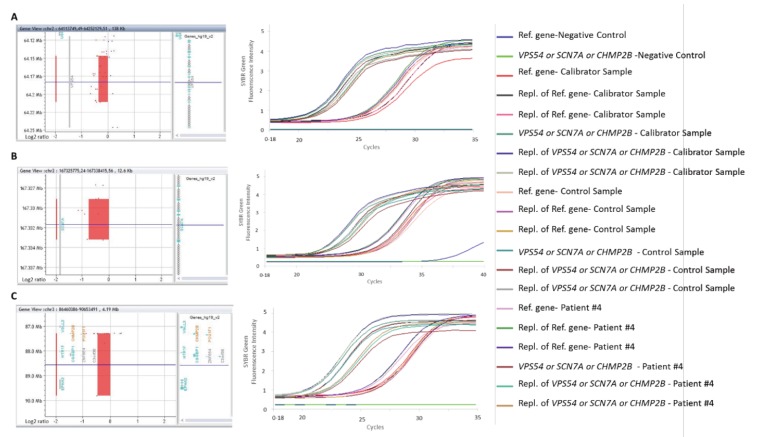
Methods: In this report, we comprehensively describe the design method, the procedures, validation, and implementation of an exon-centric customized aCGH (NeuroArray 1.0), tailored to detect both single and multi-exon deletions or duplications in a large set of multi- and monogenic neurological diseases. This focused platform enables a targeted measurement of structural imbalances across the human genome, targeting the clinically relevant genes at exon-level resolution.
Conclusion: An increasing use of the NeuroArray platform may offer new insights in investigating potential overlapping gene signatures among neurological conditions and defining genotype-phenotype relationships.
Keywords: CNVs; Custom array; Genes; Methods; Neurological diseases; aCGH.
Figures
Similar articles
-
A customized high-resolution array-comparative genomic hybridization to explore copy number variations in Parkinson's disease.Neurogenetics. 2016 Oct;17(4):233-244. doi: 10.1007/s10048-016-0494-0. Epub 2016 Sep 17. Neurogenetics. 2016. PMID: 27637465 Free PMC article.
-
NeuroArray, A Custom CGH Microarray to Decipher Copy Number Variants in Alzheimer's Disease.Curr Genomics. 2018 Sep;19(6):499-504. doi: 10.2174/1389202919666180122141425. Curr Genomics. 2018. PMID: 30258280 Free PMC article.
-
Detection limit of intragenic deletions with targeted array comparative genomic hybridization.BMC Genet. 2013 Dec 5;14:116. doi: 10.1186/1471-2156-14-116. BMC Genet. 2013. PMID: 24304607 Free PMC article.
-
Zoom-in array comparative genomic hybridization (aCGH) to detect germline rearrangements in cancer susceptibility genes.Methods Mol Biol. 2010;653:221-35. doi: 10.1007/978-1-60761-759-4_13. Methods Mol Biol. 2010. PMID: 20721746 Review.
-
The array CGH and its clinical applications.Drug Discov Today. 2008 Sep;13(17-18):760-70. doi: 10.1016/j.drudis.2008.06.007. Epub 2008 Jul 17. Drug Discov Today. 2008. PMID: 18617013 Review.
Cited by
-
Translational Medicine in Neurological Disorders: A Genomic Perspective.Curr Genomics. 2019 Apr;20(3):151-153. doi: 10.2174/138920292003190704143857. Curr Genomics. 2019. PMID: 31929723 Free PMC article. No abstract available.
-
Increased copy-number variant load of associated risk genes in sporadic cases of amyotrophic lateral sclerosis.Cell Mol Life Sci. 2024 Jul 27;81(1):316. doi: 10.1007/s00018-024-05335-8. Cell Mol Life Sci. 2024. PMID: 39066921 Free PMC article.
-
Genomic Portrait of a Sporadic Amyotrophic Lateral Sclerosis Case in a Large Spinocerebellar Ataxia Type 1 Family.J Pers Med. 2020 Dec 2;10(4):262. doi: 10.3390/jpm10040262. J Pers Med. 2020. PMID: 33276461 Free PMC article.
References
-
- Zarrei M., MacDonald J.R., Merico D., Scherer S.W. A copy number variation map of the human genome. Nat. Rev. Genet. 2015;16(3):172–183. - PubMed
-
- Lee J.A., Lupski J.R. Genomic rearrangements and gene copy-number alterations as a cause of nervous system disorders. Neuron. 2006;52(1):103–121. - PubMed
-
- Kalman B., Vitale E. Structural chromosomal variations in neurological diseases. Neurologist. 2009;15(5):245–253. - PubMed
-
- Hoyer H., Braathen G.J., Eek A.K., Nordang G.B., Skjelbred C.F., Russell M.B. Copy number variations in a population-based study of Charcot-Marie-Tooth disease. BioMed Res. Int. 2015;2015:960404. https://www.hindawi.com/journals/ bmri/2015/960404/ - PMC - PubMed
LinkOut - more resources
Full Text Sources
Other Literature Sources