

Combining Three-Dimensional Quantitative Phase Imaging and Fluorescence Microscopy for the Study of Cell Pathophysiology
- PMID: 30258314
- PMCID: PMC6153632
Combining Three-Dimensional Quantitative Phase Imaging and Fluorescence Microscopy for the Study of Cell Pathophysiology
Abstract
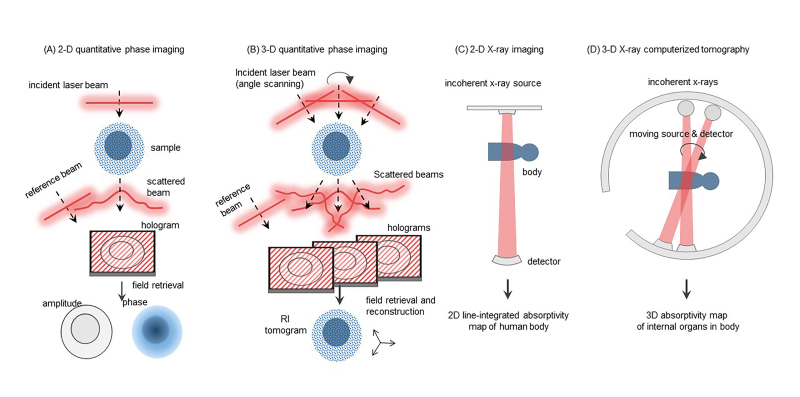
Quantitative phase imaging (QPI) has emerged as one of the powerful imaging tools for the study of live cells in a non-invasive manner. In particular, multimodal approaches combining QPI and fluorescence microscopic techniques have been recently developed for superior spatiotemporal resolution as well as high molecular specificity. In this review, we briefly summarize recent advances in three-dimensional QPI combined with fluorescence techniques for the correlative study of cell pathophysiology. Through this review, biologists and clinicians can be provided with insights on this rapidly growing field of research and may find broader applications to investigate unrevealed nature in cell physiology and related diseases.
Keywords: correlative imaging; fluorescence imaging; holotomography; label-free imaging; microscopy; quantitative phase imaging.
Figures
Similar articles
-
Holotomography: Refractive Index as an Intrinsic Imaging Contrast for 3-D Label-Free Live Cell Imaging.Adv Exp Med Biol. 2021;1310:211-238. doi: 10.1007/978-981-33-6064-8_10. Adv Exp Med Biol. 2021. PMID: 33834439
-
Contribution of high-resolution correlative imaging techniques in the study of the liver sieve in three-dimensions.Microsc Res Tech. 2007 Mar;70(3):230-42. doi: 10.1002/jemt.20408. Microsc Res Tech. 2007. PMID: 17279510 Review.
-
Quantitative phase imaging techniques for the study of cell pathophysiology: from principles to applications.Sensors (Basel). 2013 Mar 28;13(4):4170-91. doi: 10.3390/s130404170. Sensors (Basel). 2013. PMID: 23539026 Free PMC article.
-
Correlative microscopy of individual cells: sequential application of microscopic systems with increasing resolution to study the nuclear landscape.Methods Mol Biol. 2013;1042:299-336. doi: 10.1007/978-1-62703-526-2_21. Methods Mol Biol. 2013. PMID: 23980016
-
Super-resolution fluorescence imaging with single molecules.Curr Opin Struct Biol. 2013 Oct;23(5):778-87. doi: 10.1016/j.sbi.2013.07.010. Epub 2013 Aug 8. Curr Opin Struct Biol. 2013. PMID: 23932284 Free PMC article. Review.
Cited by
-
Automated wide-field malaria parasite infection detection using Fourier ptychography on stain-free thin-smears.Biomed Opt Express. 2022 Jun 15;13(7):3904-3921. doi: 10.1364/BOE.448099. eCollection 2022 Jul 1. Biomed Opt Express. 2022. PMID: 35991917 Free PMC article.
-
Quantitative phase imaging techniques for measuring scattering properties of cells and tissues: a review-part II.J Biomed Opt. 2024 Jun;29(Suppl 2):S22714. doi: 10.1117/1.JBO.29.S2.S22714. Epub 2024 Jul 27. J Biomed Opt. 2024. PMID: 39070593 Free PMC article. Review.
-
Eukaryotic cell size regulation and its implications for cellular function and dysfunction.Physiol Rev. 2024 Oct 1;104(4):1679-1717. doi: 10.1152/physrev.00046.2023. Epub 2024 Jun 20. Physiol Rev. 2024. PMID: 38900644 Free PMC article. Review.
-
In-depth biological analysis of alteration in Plasmodium knowlesi-infected red blood cells using a noninvasive optical imaging technique.Parasit Vectors. 2022 Mar 2;15(1):68. doi: 10.1186/s13071-022-05182-1. Parasit Vectors. 2022. PMID: 35236400 Free PMC article.
-
Holotomography: Refractive Index as an Intrinsic Imaging Contrast for 3-D Label-Free Live Cell Imaging.Adv Exp Med Biol. 2021;1310:211-238. doi: 10.1007/978-981-33-6064-8_10. Adv Exp Med Biol. 2021. PMID: 33834439
References
-
- Popescu G. Quantitative phase imaging of cells and tissues. New York: McGraw Hill Professional; 2011.
-
- Popescu G, Ikeda T, Dasari RR, Feld MS. Diffraction phase microscopy for quantifying cell structure and dynamics. Opt Lett. 2006;31(6):775–7. - PubMed
Publication types
MeSH terms
LinkOut - more resources
Full Text Sources
Medical