. 2018 Sep 12:9:1940.
doi: 10.3389/fimmu.2018.01940. eCollection 2018.

Akt2 Regulates the Differentiation and Function of NKT17 Cells via FoxO-1-ICOS Axis

Affiliations

Akt2 Regulates the Differentiation and Function of NKT17 Cells via FoxO-1-ICOS Axis

LinLin Niu et al. Front Immunol. .

Erratum in

Retraction in

Abstract

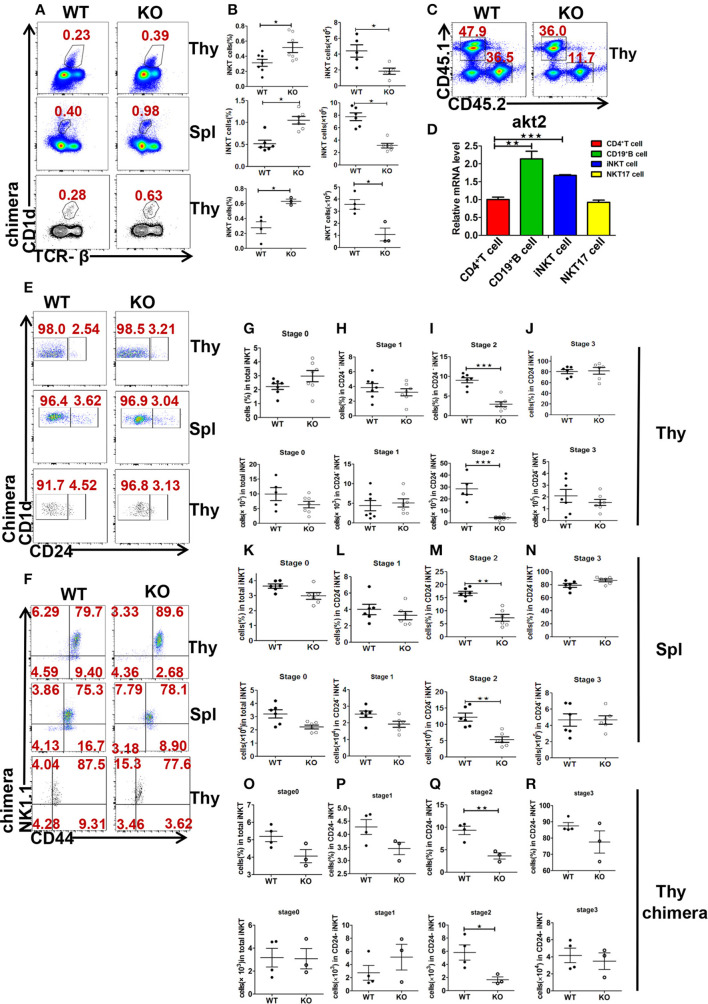
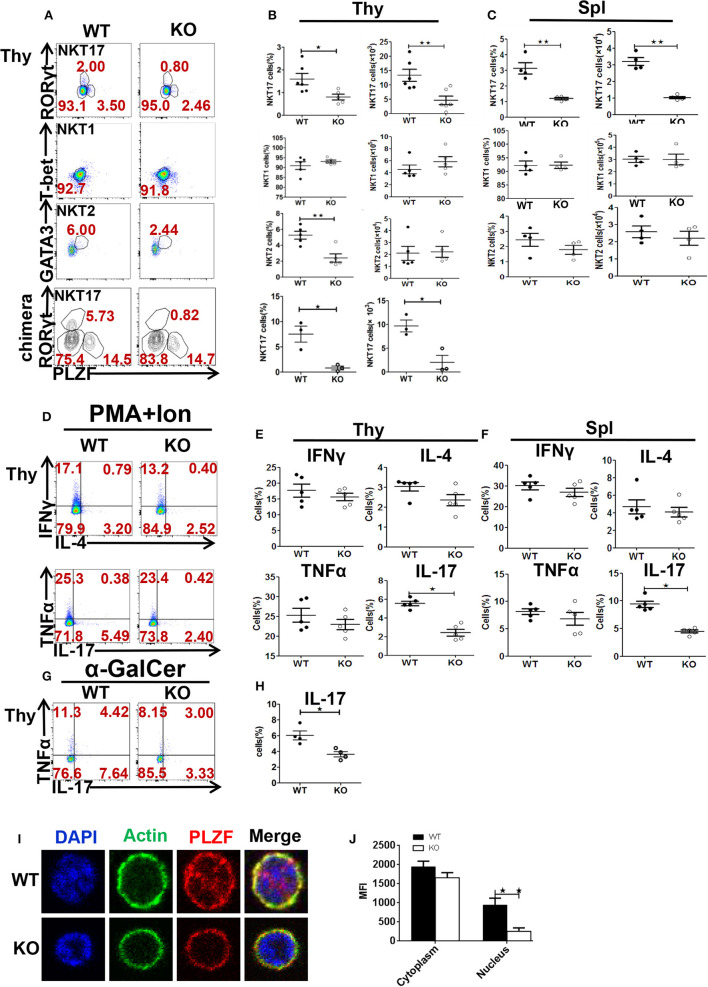
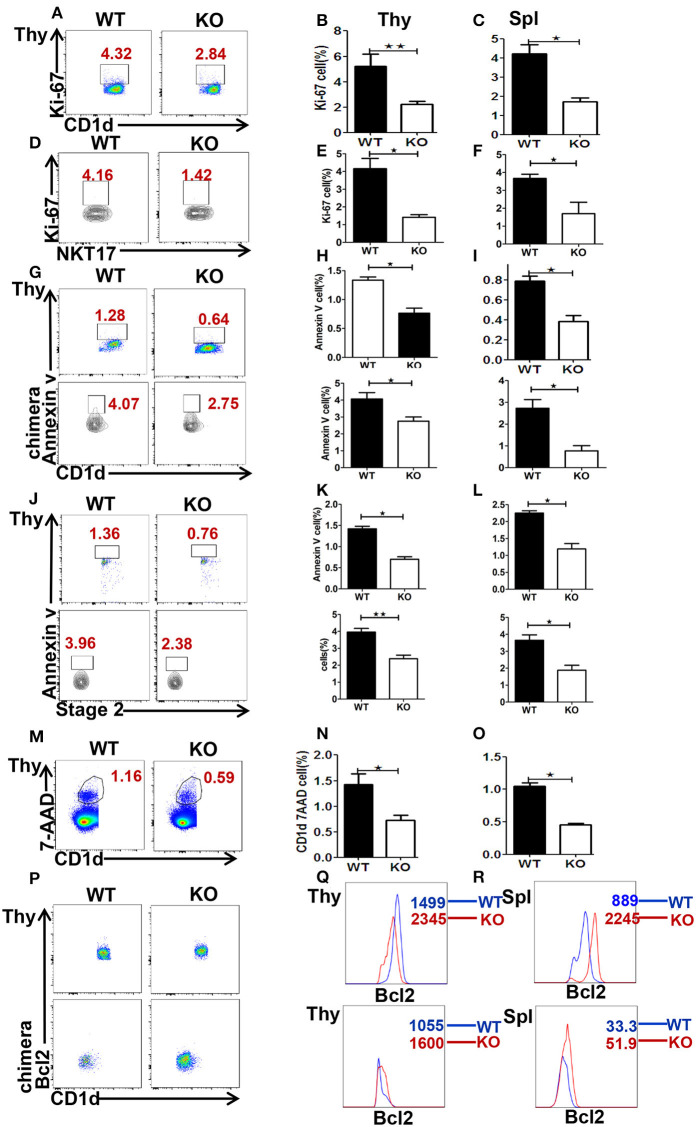
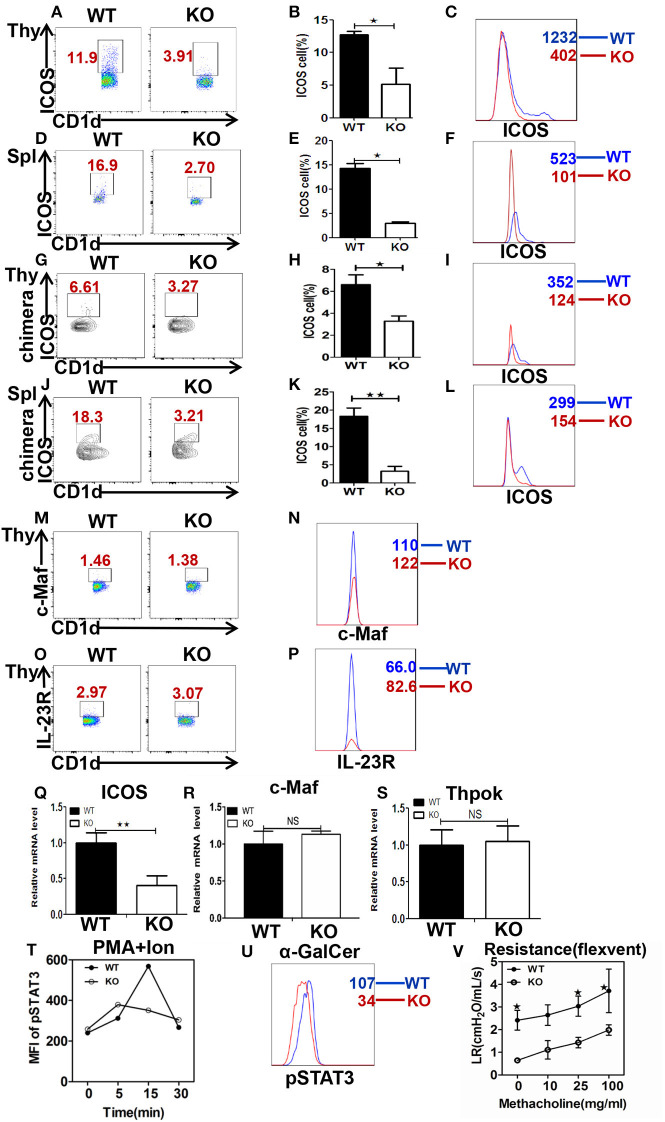
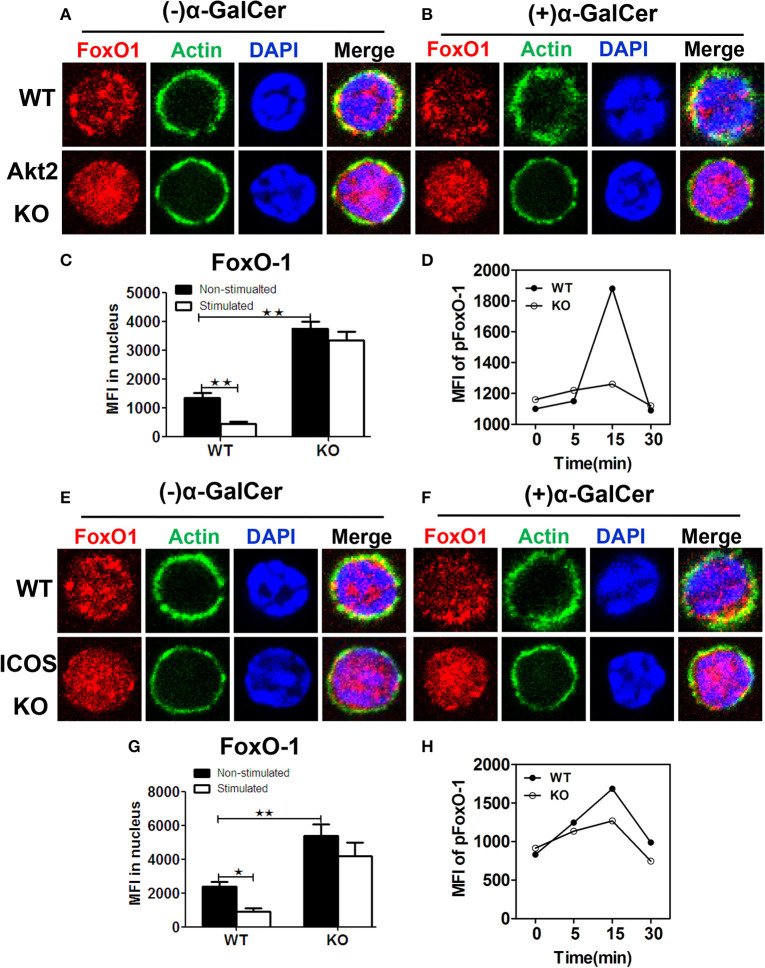
As a critical linker between mTORC1 and mTORC2, Akt is important for the cell metabolism. The role of Akt in the function and development of B and T cells is well characterized, however, the role of Akt for development and function of iNKT cells is unknown. iNKT cells bridge the adaptive and innate immunity, and in this study, we found that the differentiation of NKT17 cells and IL17 production of NKT17 cells were disrupted in Akt2 KO mice. ICOS has been demonstrated to be critical for the differentiation of NKT17 cells and we found that ICOS mRNA and protein expression was reduced in Akt2 KO iNKT cells. As a consequence, phosphorylation of FoxO-1 was downregulated in Akt2 KO thymocytes but the sequestration of FoxO-1 in the nucleus of Akt2 KO iNKT cells was increased. The negative feedback loop between ICOS and FoxO-1 has been demonstrated in CD4+T follicular helper cells. Therefore our study has revealed a new intracellular mechanism in which Akt2 regulates ICOS expression via FoxO-1 and this signaling axis regulates the differentiation and function of NKT17 cells. This study provides a new linker between cell metabolism and function of iNKT cells.

Keywords: Akt2; FoxO-1; ICOS; NKT17; iNKT.


Figures

Figure 1
Figure 1
Akt2 deficiency reduces the accumulation of stage 2 iNKT cells. (A) Flow cytometry of iNKT cells (CD1d-PBS57+TCRβ+) in the thymus (Thy) and spleen (Spl) from WT, KO, and chimera mice. (B) Percentages and absolute numbers of iNKT cells in the thymus and spleen from WT (n = 7), KO (n = 6), WT chimera mice (n = 4) and Akt2 KO chimera mice (n = 3). (C) CD45.1 and CD45.2 staining in thymus of chimera mice. (D) mRNA levels of akt2 gene in CD4+T cells, CD19+B cells, iNKT cells, and NKT17 cells of WT mice. Expression of indicated mRNA from FACS-sorted CD4+T cells, CD19+B cells, iNKT cells and NKT17 cells of WT mice. (E,F) Thymic and splenic iNKT cell development stages. Percentages (G–J, upper panel) and absolute numbers (G–J, lower panel) of stages 0–3 iNKT cells from WT (n = 7) and KO mice (n = 7) in the thymus. Percentages (K–N, upper panel) and absolute numbers (K–N, lower panel) of stage 0–3 iNKT cells from WT (n = 6) and KO mice (n = 6) in the spleen. (O–R, upper panel) percentages and absolute numbers (O–R, lower panel) of stage 0–3 iNKT cells from WT chimera mice (n = 4) and Akt2 KO chimera mice (n = 3). *p < 0.05; **p < 0.01; ***p < 0.001 determined by the Student's t-test.
Figure 2
Figure 2
Akt2 promotes NKT17 lineage differentiation. Cells were from WT and Akt2 KO mice. (A) Intracellular staining of PLZF, RORγt, T-bet, and GATA3 in iNKT cells from the thymus. Percentages and absolute numbers of NKT1, NKT2, NKT17 cells in the thymus (n = 6 mice per group) (B) and spleen (n = 4 mice per group) (C) from WT, KO, WT chimera mice (n = 3) and Akt2 KO chimera mice (n = 3). (D–F) Cytokine production by iNKT cells (gated on CD1d-PBS57+TCRβ+ cells) from the thymus (n = 5 mice per group) and spleen (n = 5 mice per group) after stimulation with PMA plus ionomycin for 5 h. (G,H) Cytokine production by iNKT cells from WT and Akt2 KO thymocytes stimulated with α-GalCer for 72 h and with PMA plus ionomycin in the last 5 h (n = 4 mice per group). (I) Critical role of Akt2 for PLZF localization to the nuclear bodies. MACS—enriched and FACS—sorted NKT17 cells from WT and Akt2 KO thymocytes(n = 3) were fixed and stained with a mouse anti-PLZF and Actin as primary antibody, detected with an Goat anti mouse secondary antibody. The nuclei were stained with DAPI. (J) Mean fluorescent intensity of cytoplasm and nucleus. *p < 0.05; **p < 0.01 determined by the Student's t-test.
Figure 3
Figure 3
Loss of Akt2 reduces the proliferation and apoptosis of iNKT cells. (A) Flow cytometry of Ki-67 cells gated on iNKT cells in the thymus. (B,C) Percentage of Ki-67 cells in the thymus and spleen (n = 3 mice per group). (D) Flow cytometry of Ki-67 cells gated on NKT17 cells in the thymus. (E,F) Percentage of Ki-67 cells gated on NKT17 cells in the thymus (n = 3 mice per group) and spleen (n = 3 mice per group). (G) Flow cytometry of Annexin V cells gated on the iNKT in the thymus. (H,I) Percentage of Annexin V cells in the thymus and spleen of WT (n = 3), KO (n = 3), WT chimera mice (n = 4) and Akt2 KO chimera mice (n = 3). (J) Flow cytometry of Annexin V cells gated on the stage2 (CD24CD44+NK1.1) iNKT cells in the thymus of WT, KO, and chimera mice. (K,L) Percentage of Annexin V cells of stage2 iNKT cells in the thymus and spleen of WT (n = 3), KO (n = 3), WT chimera mice (n = 4), and Akt2 KO chimera mice (n = 3). (M) Flow cytometry of CD1d cells gated on 7AAD cells in the thymus. (N,O) Percentage of CD1d cells in the thymus (n = 3 mice per group) and spleen (n = 3 mice per group). (P) Flow cytometry of Bcl2 cells gated on iNKT cells in the thymus. (Q,R) Overlaid histograms show expression of Bcl2.chimerachimera *p < 0.05; **p < 0.01, Student's t-test.
Figure 4
Figure 4
Akt2 regulates the NKT17 differentiation by promoting the expression of ICOS. (A–F) The percentages of ICOS of WT and Akt2 KO cells in thymus (n = 3 mice per group) and spleen (n = 3 mice per group) is shown. (C,F) Overlaid histograms show expression of ICOS in the thymus and spleen. (G–L) The percentages of ICOS of CD45.2+ cells in thymus and spleen of WT chimera mice (n = 4) and Akt2 KO chimera mice (n = 3) is shown. (I,L) Overlaid histograms show expression of ICOS in the thymus and spleen of chimeras. (M,N) The Flow cytometry of c-Maf and expression of c-Maf in the thymus. (O,P) Flow cytometry of IL-23R and expression of IL-23R in the thymus. (Q–S) mRNA levels of indicated molecules in WT and Akt2 KO iNKT cells. Expression of indicated mRNA from MACS- and FACS- sorted WT and Akt2 KO iNKT cells from freshly isolated thymocytes was quantified by real-time qPCR from three independent experiments. *p < 0.05; **p < 0.01, Student's t-test. (T) Flow cytometry analysis of the pSTAT3 for MFI in thymocytes from WT (n = 3) and Akt2 KO mice (n = 3). (U) Overlaid histograms show expression of pSTAT3 after α-GalCer stimulated 72 h. (V) Airway response to methacholine of WT (n = 3) and Akt2 KO mice (n = 3). LR, lung resistance from two independent experiments. *p < 0.05, Student's t-test.
Figure 5
Figure 5
Akt2 couples with FoxO-1 to regulate the expression of ICOS in NKT cells. (A) MACS—enriched and FACS—sorted iNKT cells from WT and Akt2 KO thymocytes were fixed and stained with a rabbit-anti-FoxO1 and AF488-Actin as primary antibody, detected with a goat anti rabbit secondary antibody. The nuclei were stained with DAPI. (B) MACS—enriched and FACS—sorted iNKT cells from WT and KO thymocytes were incubated with125 ng/mL α-GalCer for 3 d and then stained with FoxO1 and AF488-Actin as primary antibody, detected with a Goat anti mouse secondary antibody. (C) MFI of FoxO1 of iNKT cells in the thymus from the WT and Akt2 KO mice (n = 3) quantified with NIS-Elements AR 3.2 software. (D) Phospho flow analysis of the MFI of pFoxO-1(S256) in the WT and KO thymocytes. (E) MACS—enriched and FACS—sorted iNKT cells from WT and ICOS KO thymocytes were fixed and stained with a rabbit-anti-FoxO1 and AF488-Actin as primary antibody, detected with a goat anti rabbit secondary antibody. The nuclei were stained with DAPI. (F) MACS—–enriched and FACS—sorted iNKT cells from WT and ICOS KO thymocytes (n = 3 mice per group) were incubated with125 ng/mL α-GalCer for 3 d and then stained with FoxO1 and AF488-Actin as primary antibody, detected with a Goat anti mouse secondary antibody. (G) MFI of FoxO1 of iNKT cells in the thymus from the WT (n = 3) and ICOS KO mice (n = 3) quantified with NIS-Elements AR 3.2 software. (H) Phospho flow analysis of the MFI of pFoxO-1(S256) in the WT and ICOS KO thymocytes from three independent experiments. *p < 0.05; **p < 0.01, Student's t-test.

Similar articles

Cited by

References

    1. Salio M, Silk JD, Jones EY, Cerundolo V. Biology of CD1- and MR1-restricted T cells. Ann Rev Immunol. (2014) 32:323–66. 10.1146/annurev-immunol-032713-120243 - DOI - PubMed
    1. Brennan PJ, Brigl M, Brenner MB. Invariant natural killer T cells: an innate activation scheme linked to diverse effector functions. Nat Rev Immunol. (2013) 13:101–17. 10.1038/nri3369 - DOI - PubMed
    1. Bendelac A, Savage PB, Teyton L. The biology of NKT cells. Ann Rev Immunol. (2007) 25:297–336. 10.1146/annurev.immunol.25.022106.141711 - DOI - PubMed
    1. Kovalovsky D, Uche OU, Eladad S, Hobbs RM, Yi W, Alonzo E, et al. The BTB-zinc finger transcriptional regulator PLZF controls the development of invariant natural killer T cell effector functions. Nat Immunol. (2008) 9:1055–64. 10.1038/ni.1641 - DOI - PMC - PubMed
    1. Savage AK, Constantinides MG, Han J, Picard D, Martin E, Li B, et al. The transcription factor PLZF directs the effector program of the NKT cell lineage. Immunity (2008) 29:391–403. 10.1016/j.immuni.2008.07.011 - DOI - PMC - PubMed

Publication types

MeSH terms

Substances

LinkOut - more resources