Review
. 2018 Sep 12:9:2096.
doi: 10.3389/fimmu.2018.02096. eCollection 2018.

Activation of RIG-I-Mediated Antiviral Signaling Triggers Autophagy Through the MAVS-TRAF6-Beclin-1 Signaling Axis

Affiliations
Review

Activation of RIG-I-Mediated Antiviral Signaling Triggers Autophagy Through the MAVS-TRAF6-Beclin-1 Signaling Axis

Na-Rae Lee et al. Front Immunol. .

Abstract

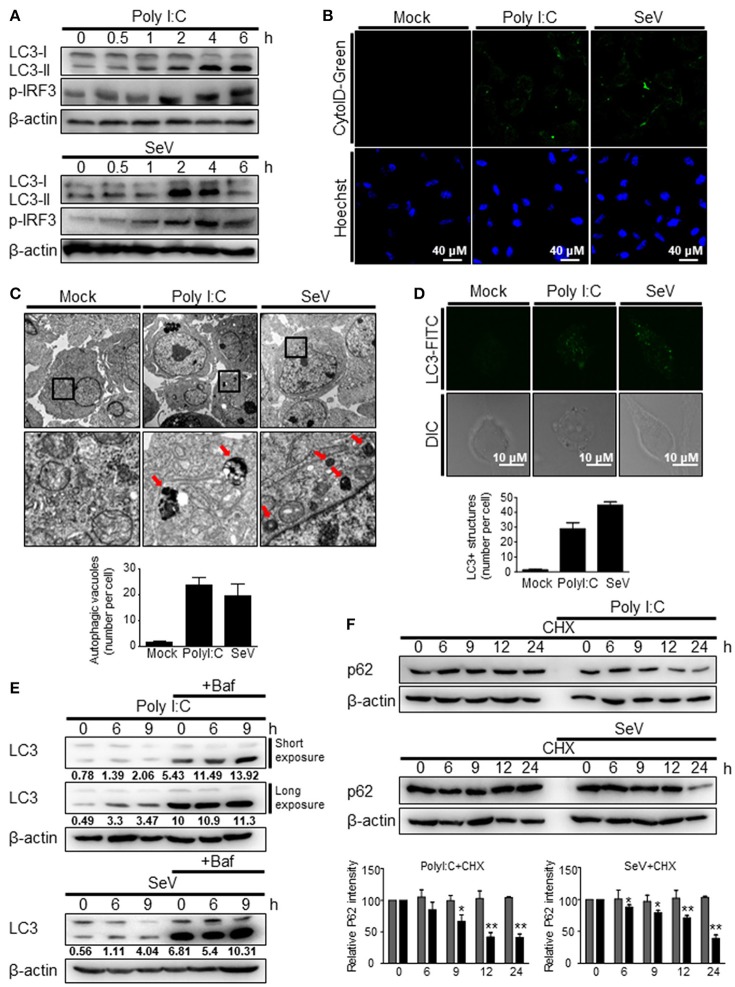
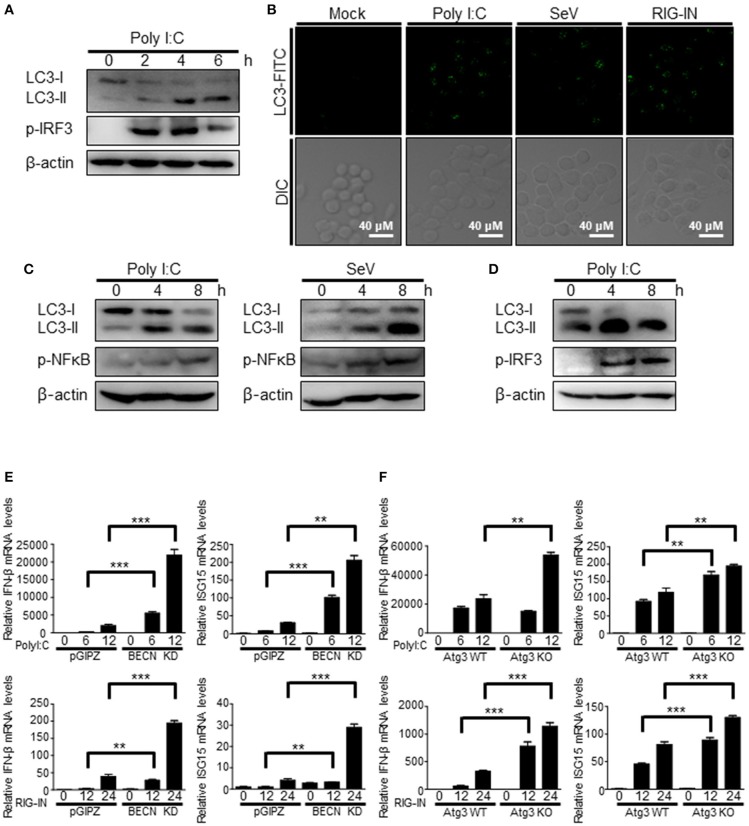
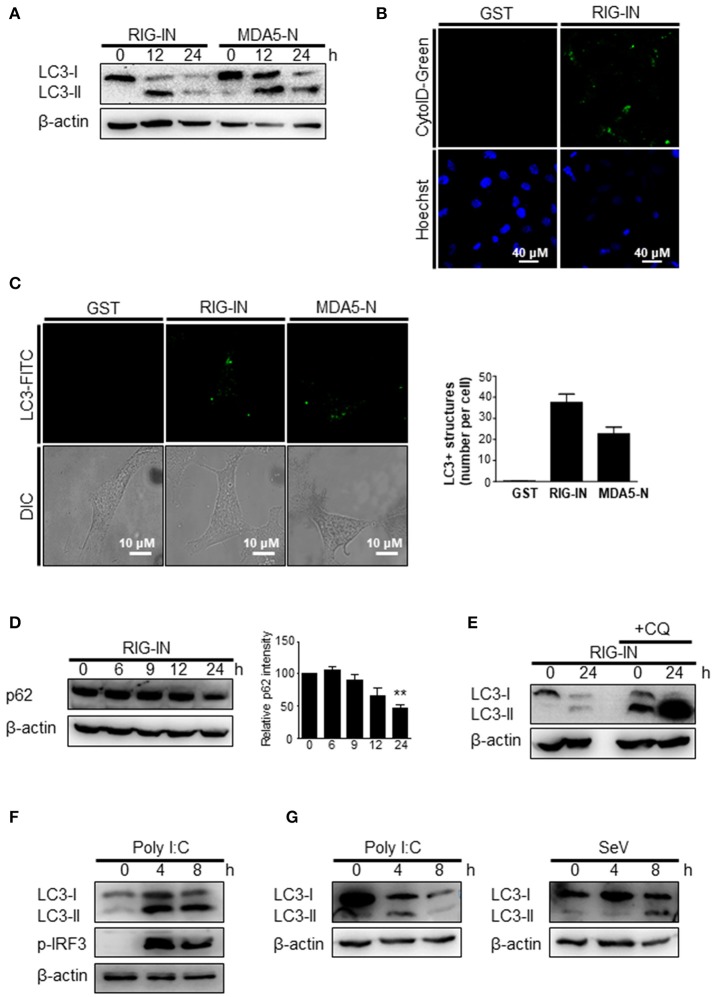
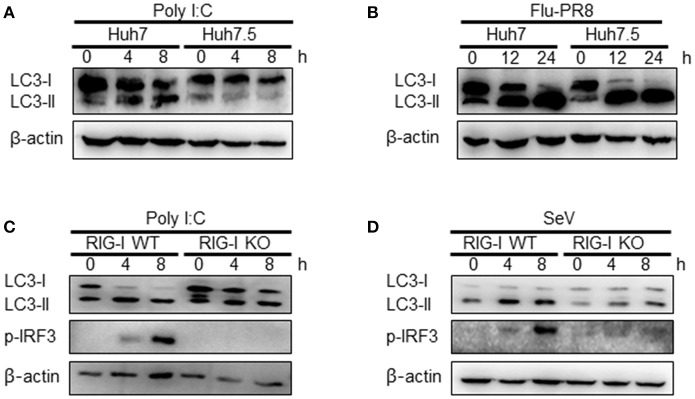
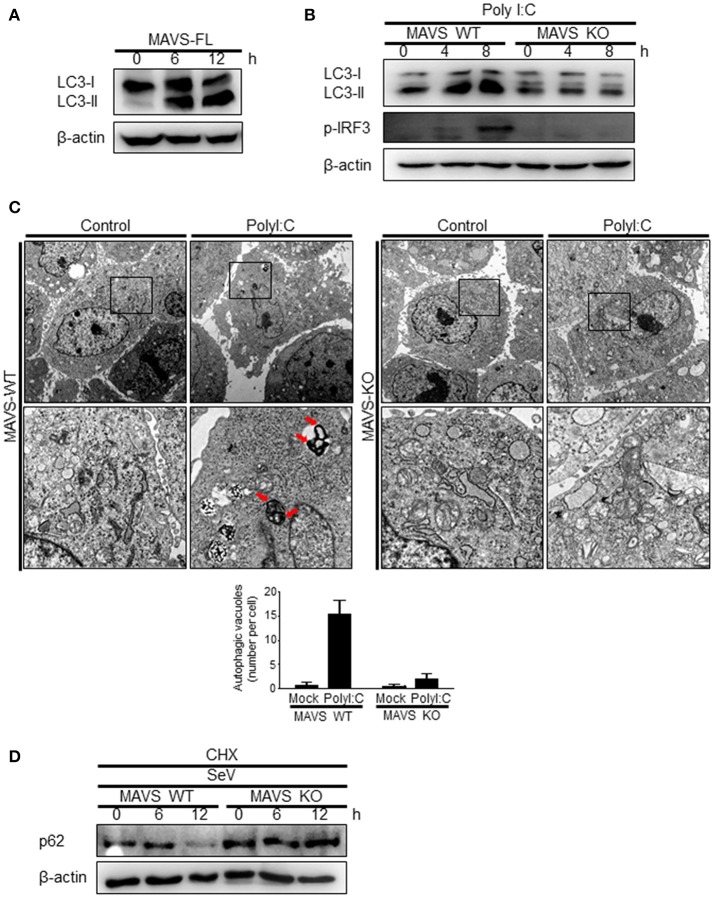
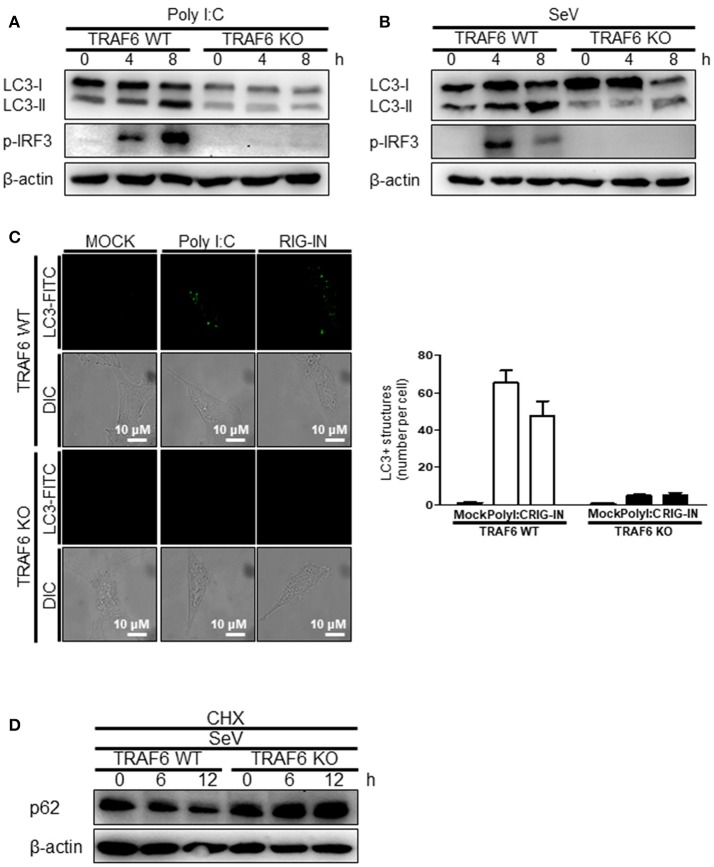
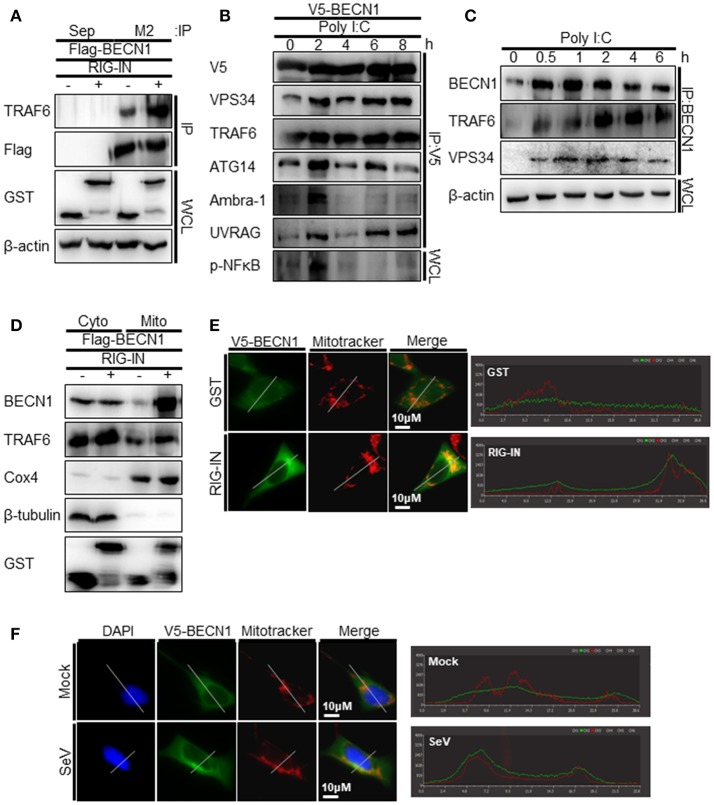
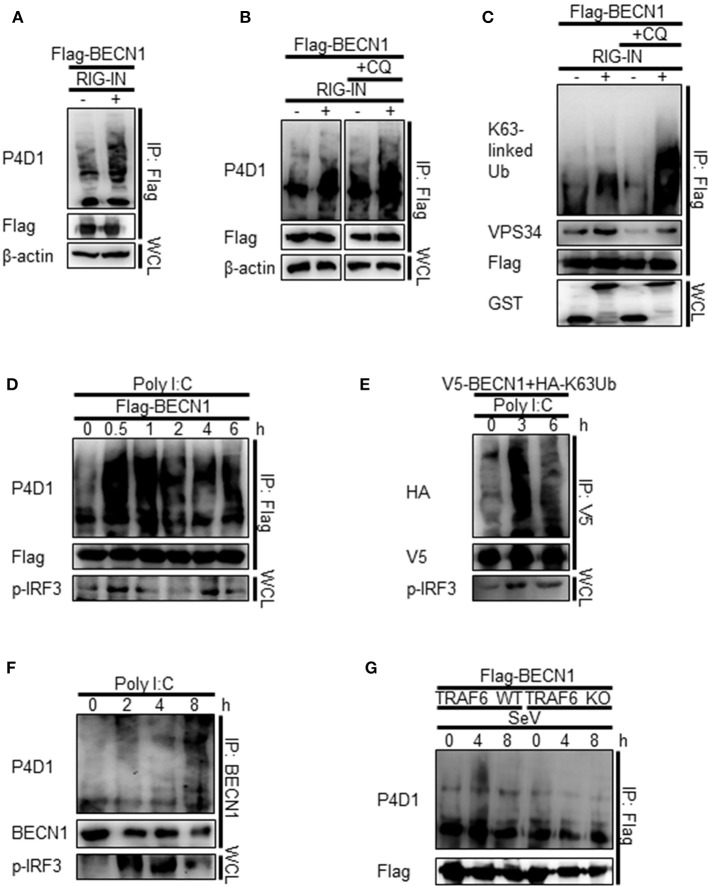
Autophagy has been implicated in innate immune responses against various intracellular pathogens. Recent studies have reported that autophagy can be triggered by pathogen recognizing sensors, including Toll-like receptors and cyclic guanosine monophosphate-adenosine monophosphate synthase, to participate in innate immunity. In the present study, we examined whether the RIG-I signaling pathway, which detects viral infections by recognizing viral RNA, triggers the autophagic process. The introduction of polyI:C into the cytoplasm, or Sendai virus infection, significantly induced autophagy in normal cells but not in RIG-I-deficient cells. PolyI:C transfection or Sendai virus infection induced autophagy in the cells lacking type-I interferon signaling. This demonstrated that the effect was not due to interferon signaling. RIG-I-mediated autophagy diminished by the deficiency of mitochondrial antiviral signaling protein (MAVS) or tumor necrosis factor receptor-associated factor (TRAF)6, showing that the RIG-I-MAVS-TRAF6 signaling axis was critical for RIG-I-mediated autophagy. We also found that Beclin-1 was translocated to the mitochondria, and it interacted with TRAF6 upon RIG-I activation. Furthermore, Beclin-1 underwent K63-polyubiquitination upon RIG-I activation, and the ubiquitination decreased in TRAF6-deficient cells. This suggests that the RIG-I-MAVS-TRAF6 axis induced K63-linked polyubiquitination of Beclin-1, which has been implicated in triggering autophagy. As deficient autophagy increases the type-I interferon response, the induction of autophagy by the RIG-I pathway might also contribute to preventing an excessive interferon response as a negative-feedback mechanism.

Keywords: Beclin-1; MAVS; RIG-I; TRAF6; autophagy; innate immunity; polyubiquitination.


Figures

Figure 1
Figure 1
RIG-I activation invokes autophagy. (A) HEK293T cells were transfected with polyI:C (2 μg) or infected with Sendai virus (SeV) (200 HA U/mL) for the indicated hours. The cell lysates were analyzed by immunoblotting using antibodies for LC3 (LC3-I and LC3-II), phospho-IRF3 (p-IRF3), and β-actin. (B) HEK293T cells were transfected with polyI:C or infected with SeV as in (A) and incubated for 12 h. Autophagosomes were labeled with cytoID-green reagent and observed by fluorescence microscopy. The bottom panels show staining with Hoechst dye to visualize nuclei of the cells. (C) HEK293T cells were transfected with polyI:C (10 μg) or infected with SeV (200 HA U/mL) for 12 h. The cells were harvested, fixed, and subjected to transmission electron microscopy to observe autophagic vesicles (red arrows in the lower panels). The bottom panels show enlarged view of the boxed regions in the top panels. The bottom graph show that means of autophagic vacuoles in a cell determined from 5 different images. The data are presented as mean ± SE. (D) HEK293T cells were mock-treated, transfected with polyI:C or infected with SeV as in (A). After washing and fixation, LC3 puncta were visualized by staining with anti-LC3 antibody and FITC-labeled secondary antibody and observed by fluorescence microscopy. The number of puncta was counted and analyzed using the image J software. The bottom panel shows the mean number of LC3 puncta in a cell. The data are presented as mean ± SE. (E) HEK293T cells were transfected with polyI:C or infected with SeV and treated with or without bafilomycin (50 nM) for the indicated hours. The cell lysates were analyzed by immunoblotting using antibodies for LC3 and β-actin. The ratios of LC3II/I was determined by densitometry and presented below. (F) HEK293T cells were transfected with polyI:C (2 μg) or infected with SeV (200 HAU/mL) and treated with cycloheximide (CHX, 100 ng/mL) for indicated hours. The levels of p62 were analyzed by immunoblotting. Each experiment was repeated three or more times and representative data are shown. The bottom panels show the relative p62 expression levels. Data are represented as mean ± SE from untreated samples (gray bars) and polyI:C-transfected or SeV-infected samples (black bars). A value of *p < 0.05, **p < 0.005. vs. not treated samples.
Figure 2
Figure 2
Induction of autophagy by RIG-I in different types of cells. (A) Raw264.7 murine macrophage cells were transfected with polyI:C (2 μg) for the indicated hours. The cell lysates were analyzed by immunoblotting using antibodies for LC3, phospho-IRF3, and β-actin. (B) Raw264.7 cells were mock-treated, transfected with polyI:C (2 μg), infected with SeV (200 HAU/ml) or RIG-IN (100ng) for 8 h. After washing and fixation, LC3 puncta were visualized by staining with anti-LC3 antibody and FITC-labeled secondary antibody and observed by fluorescence microscopy. (C) N2a murine hypothalamus cells were transfected with polyI:C (2 μg) or infected with Sendai virus (SeV) for 0, 4, or 8 h. The cell lysates were analyzed by immunoblotting using the indicated antibodies as primary antibodies. (D) BV-2 murine microglial cells were transfected with polyI:C and incubated for indicated hours. The cell lysates were analyzed by immunoblotting using indicated antibodies. Each experiment was repeated three or more times and representative data are shown. (E) Control (pGIPZ) or Beclin-1 knockdown (BECN KD) A549 cells were transfected with polyI:C (upper) or RIG-IN (bottom) and incubated for indicated hours. mRNA levels of IFN-β and ISG15 were analyzed by RT-qPCR. (F) Atg3 wildtype (Atg3 WT) or Atg3 knockout (Atg3 KO) MEFs were transfected with polyI:C (upper) or RIG-IN (bottom). mRNA levels of IFN-β and ISG15 were analyzed by RT-qPCR. Data are represented as means ± SE. **p < 0.005. ***p < 0.0005.
Figure 3
Figure 3
A constitutively active form of RIG-I triggers autophagy. (A) HEK293T cells were transfected with constitutively active N-terminal Card domains of RIG-I (RIG-IN) or MDA5 (MDA5-N). LC3 lipidation was analyzed by immunoblotting using anti-LC3 and anti-β-actin antibodies. (B) HEK293T cells were transfected with vector or RIG-IN and incubated for 24 h. Autophagosomes were stained with Cyto-ID reagent and observed under a fluorescence microscope. The bottom panels show staining with Hoechst dye to visualize nuclei of the cells. (C) HEK293A cells were transfected with RIG-IN or MDA5-N. Eighteen hours after transfection, the cells were fixed and stained with anti-LC3 antibody and FITC-labeled secondary antibody and subjected to fluorescence microscopy. The numbers of puncta was counted and analyzed using the image J software. The right panel shows the mean number of LC3 puncta in a cell. The data are presented as mean ± standard error of the mean. (D) HEK293T cells were transfected with RIG-IN for 0, 6, 9, 12, and 24 h. The levels of p62 were analyzed by immunoblotting. Densitometric analysis was performed using 3 results from independent experiments. **p < 0.005. vs. 0h control. (E) HEK293T cells were transfected with vector or RIG-IN for 0 or 24 h with or without chloroquine (CQ) treatment (20 μM) for 12 h before harvest. The cells were subjected to immunoblotting using an anti-LC3 antibody. (F) Type-I interferon receptor (INFR)-deficient mouse embryonic fibroblast cells were transfected with 2 μg polyI:C and incubated for 0, 4, or 8 h. LC3 lipidation was analyzed by immunoblotting. (G) Vero cells were transfected with 2 μg polyI:C or infected with 200 HA U/mL SeV for 0, 4, or 8 h. LC3 lipidation was analyzed by immunoblotting. Each experiment was repeated three or more times and representative data are shown.
Figure 4
Figure 4
Functional RIG-I is required for polyI:C and Sendai virus (SeV)-mediated autophagy activation. (A) Huh7 human hepatoma cells and Huh7-derived Huh7.5 cells with defective RIG-I activity were transfected with 2 μg polyI:C. LC3 lipidation was analyzed by immunoblotting using anti-LC3 and anti-β-actin antibodies. (B) Huh7 and Huh7.5 cells were infected with influenza A PR8 (Flu-PR8) (multiplicity of infection = 1) as indicated. LC3 lipidation was analyzed as in (A). LC3 lipidation in wild-type (WT) and RIG-I knock-out (KO) mouse embryonic fibroblasts transfected with 2 μg polyI:C (C) or infected with 200 HA U/mL SeV (D). LC3 lipidation was analyzed as in (A). Each experiment was repeated three or more times and representative data are shown.
Figure 5
Figure 5
Mitochondrial antiviral signaling protein (MAVS) is required for the induction of autophagy. (A) HEK293T cells were transfected with MAVS and harvested after 0, 6, and 12 h. LC3 lipidation was analyzed by immunoblotting using an anti-LC3 antibody. (B) The wild-type (WT) and MAVS knockout (KO) mouse embryonic fibroblasts (MEFs) were transfected with 2 μg polyI:C for 0, 4, or 8 h. LC3 lipidation was analyzed by immunoblotting as in (A). (C) The WT and MAVS KO MEFs were transfected with 10 μg polyI:C for 12 h. The cells were observed by transmission electron microscopy. The bottom panels show enlarged view of the boxed regions in the top panels. The bottom graph show that means of autophagic vacuoles in a cell. The data are presented as mean ± SE. (D) The WT and MAVS KO MEFs were infected with 200 HA U/mL SeV and treated with cycloheximide (CHX, 100 ng/mL) for 0, 6, or 12 h. The level of p62 was analyzed by immunoblotting. Each experiment was repeated three or more times and representative data are shown.
Figure 6
Figure 6
Tumor necrosis factor receptor-associated factor (TRAF)6 is required for the induction of autophagy. The WT and TRAF6 KO MEFs were transfected with 2 μg polyI:C (A) or infected with 200 HA U/mL SeV (B) for 0, 4, or 8 h. LC3 lipidation was analyzed by immunoblotting using an anti-LC3 antibody. (C) The TRAF6 WT and KO MEFs were transfected with polyI:C (2 μg/well) or RIG-IN (100 ng/well). Eighteen hours after transfection, LC3-puncta was visualized by staining with anti-LC3 antibody and FITC-labeled secondary antibody. The number of puncta was counted and analyzed using the image J software. The right panel shows the mean number of LC3 puncta in a cell. Data presented as mean ± standard error of the mean. (D) The WT and TRAF6 KO MEFs were infected with 200 HA U/mL SeV and treated with CHX (100 ng/mL) for 0, 6, or 12 h, then subjected to immunoblotting using an anti-p62 antibody. Each experiment was repeated three or more times and representative data are shown.
Figure 7
Figure 7
RIG-I activation increases the interaction between tumor necrosis factor receptor-associated factor (TRAF)6 and Beclin-1. (A) HEK293T cells were transfected with Flag-Beclin-1 (Flag-BECN1) and pEBG (GST, -) or pEBG-RIG-IN (RIG-IN, +). Thirty-six hours after transfection, the cell lysates were subjected to co-immunoprecipitation (co-IP) using a M2 anti-Flag antibody-coated resin. The sepharose resin (Sep) served as a negative control. Whole cell lysates (WCL) and samples from co-IP were analyzed by immunoblotting using the indicated antibodies. (B) HEK293T cells were transfected with V5-Beclin-1. Twelve hours after transfection, polyI:C was transfected into the cells at different time points and incubated for the indicated hours. The cell lysates were subjected to co-IP using anti-V5 antibody, followed by immunoblotting using the indicated antibodies. (C) HEK293T cells were transfected with polyI:C and harvested at 0, 0.5, 1, 2, 4, and 6 h. The cell lysates were subjected to co-IP with an anti-Beclin-1 (BECN1) antibody and analyzed by immunoblotting using the indicated antibodies. (D) HEK293T cells were transfected with Flag-BECN1, pEBG (GST), or pEBG-RIG-IN and incubated for 24 h. The mitochondrial and cytoplasmic fractions were separated as described in the Materials and Methods and subjected to immunoblotting using the indicated antibodies. (E) HEK293A cells were transfected with GST control vector or GST-RIG-IN together with V5-Beclin-1. Eighteen hours after transfection, the cells were stained with Mitotracker and anti-V5 antibody as described in the Materials and Methods. Fixed dishes were observed by confocal microscopy. The right panel shows the intensity of Mitotracker (Red) and Beclin-1 (Green) along the white line of the left panel images. (F) HEK293A cells were transfected with V5-Beclin-1. Sixteen hours after transfection, the cells were mock-infected or infected with SeV for 4h. The localization of Beclin-1 was analyzed by confocal microscopy as in (E). Each experiment was repeated three or more times and representative data are shown.
Figure 8
Figure 8
RIG-I activation increases K63-linked polyubiquitination of Beclin-1. (A) HEK293T cells were transfected with Flag-Beclin-1 (Flag-BECN1) and pEBG (GST) or pEBG-RIG-IN, and incubated for 24 h. The cell lysates were subjected to immunoprecipitation (IP) using M2 anti-Flag resin and analyzed by immunoblotting using the indicated antibodies. (B) HEK293T cells were transfected with Flag-BECN1 and pEBG-RIG-IN, and treated with or without 20 μM chloroquine (CQ). The cell lysates were analyzed by IP and immunoblotting as in (A). (C) HEK293T cells were transfected with the indicated plasmids and incubated in the presence or absence of 20 μM CQ for 12 h. Lys63 (K63)-linked polyubiquitination of Beclin-1 was analyzed by IP and immunoblotting with the indicated antibodies. (D) HEK293T cells were transfected with Flag-Beclin-1. After 24 h, the cells were transfected with polyI:C and incubated for 0, 0.5, 1, 2, 4, and 6 h. The cell lysates were analyzed by IP and immunoblotting. (E) HEK293T cells were transfected with V5-Beclin-1 and HA-K63-only ubiquitin mutant plasmids. After 24 h, the cells were transfected with polyI:C and incubated for 0, 3, or 6 h. The cell lysates were analyzed by IP and immunoblotting. (F) HEK293T cells were transfected with polyI:C and incubated for 0, 2, 4, and 8 h. The cell lysates were subjected to IP using the anti-Beclin-1 (BECN1) antibody and analyzed by immunoblotting. (G) Wild-type (WT) and TRAF6 knock-out (TRAF6 KO) MEFs were transfected with Flag-BECN1. After 24 h, the cells were infected with SeV and incubated for 0, 4, or 8 h. The cell lysates were subjected to IP and immunoblotting. Each experiment was repeated three or more times and representative data are shown.

Similar articles

Cited by

References

    1. Levine B, Klionsky DJ. Development by self-digestion: molecular mechanisms and biological functions of autophagy. Dev Cell (2004) 6:463–77. 10.1016/S1534-5807(04)00099-1 - DOI - PubMed
    1. Kirkegaard K, Taylor MP, Jackson WT. Cellular autophagy: surrender, avoidance and subversion by microorganisms. Nat Rev Microbiol. (2004) 2:301–14. 10.1038/nrmicro865 - DOI - PMC - PubMed
    1. Levine B. Eating oneself and uninvited guests: autophagy-related pathways in cellular defense. Cell (2005) 120:159–62. 10.1016/j.cell.2005.01.005 - DOI - PubMed
    1. Jo EK, Yuk JM, Shin DM, Sasakawa C. Roles of autophagy in elimination of intracellular bacterial pathogens. Front Immunol. (2013) 4:97. 10.3389/fimmu.2013.00097 - DOI - PMC - PubMed
    1. Thurston TL, Ryzhakov G, Bloor S, von Muhlinen N, Randow F. The TBK1 adaptor and autophagy receptor NDP52 restricts the proliferation of ubiquitin-coated bacteria. Nat Immunol. (2009) 10:1215–21. 10.1038/ni.1800 - DOI - PubMed

Publication types

MeSH terms