. 2018 Jul 31;9(34):6935-6943.
doi: 10.1039/c8sc02312c. eCollection 2018 Sep 14.

Ratiometric Raman imaging reveals the new anti-cancer potential of lipid targeting drugs

Affiliations

Ratiometric Raman imaging reveals the new anti-cancer potential of lipid targeting drugs

Lauren E Jamieson et al. Chem Sci. .

Abstract

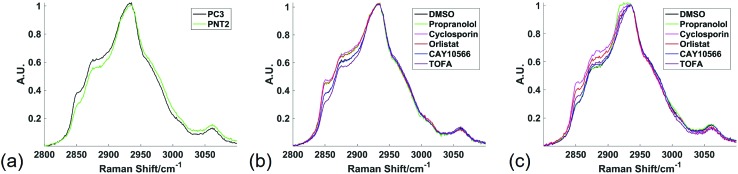
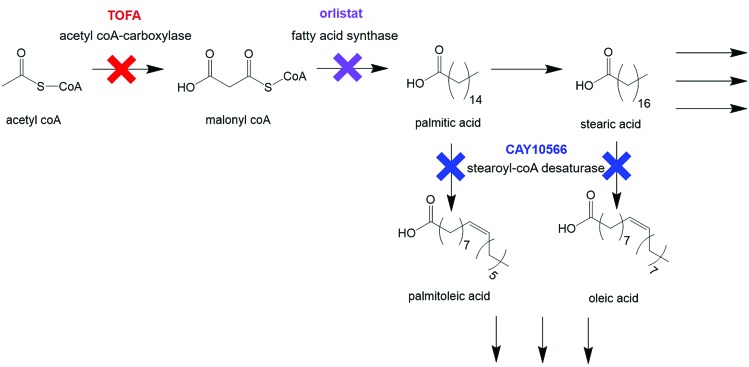
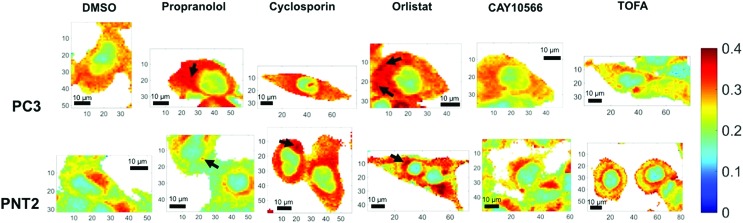
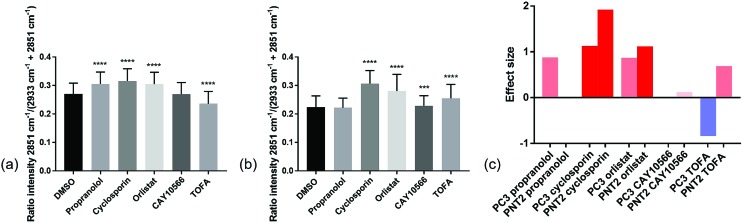
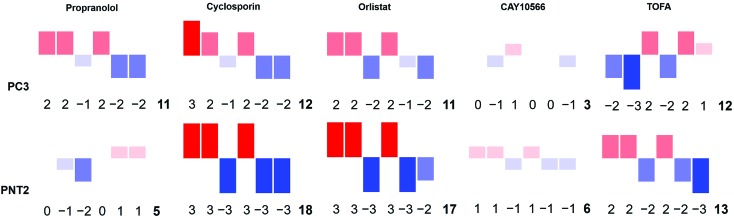
De novo lipid synthesis is upregulated in cancer cells and inhibiting these pathways has displayed anti-tumour activity. Here we use Raman spectroscopy, focusing solely on high wavenumber spectra, to detect changes in lipid composition in single cells in response to drugs targeting de novo lipid synthesis. Unexpectedly, the beta-blocker propranolol showed selectively towards cancerous PC3 compared to non-cancerous PNT2 prostate cells, demonstrating the potential of this approach to identify new anti-cancer drug leads. A unique and simple ratiometric approach for intracellular lipid investigation is reported using statistical analysis to create phenotypic 'barcodes', a globally applicable strategy for Raman drug-cell studies. High wavenumber spectral analysis is compatible with low cost glass substrates, easily translatable into the cytological work stream. The analytical strength of this technique could have a significant impact on cancer treatment through vastly improved understanding of cancer cell metabolism, and thus guide drug design and enhance personalised medicine strategies.


Figures

Fig. 1
Fig. 1. High wavenumber spectral response to lipid altering drugs. Average Raman spectra from the high wavenumber spectral region from all spectra extracted from cell regions of three different Raman maps were compared between PC3 and PNT2 control (DMSO) cells (a); PC3 cells treated with DMSO (control), or a lipid altering drug (b); and PNT2 cells treated with DMSO (control), or a lipid altering drug (c). Cells were mapped using 532 nm, 0.5 s acquisition, 15 mW laser power, 1 μm step size in x and y and a spectral center of 3000 cm–1.
Fig. 2
Fig. 2. Key steps in de novo lipid synthesis. Simplified steps in de novo lipid synthesis with enzyme targets for drugs used in this study indicated.
Fig. 3
Fig. 3. Ratiometric Raman imaging of intracellular lipid distribution. Representative examples of fixed cell regions mapped using a Raman microscope for two prostate cancer cell lines, PC3 and PNT2, treated with DMSO (control), or a lipid altering drug. After processing in Wire 4.1 and MATLAB®, false color images of the ratio of peak intensity at 2851 cm–1 and the sum of the peak intensities at 2933 cm–1 and 2851 cm–1 were created as a reflection of lipid/(protein + lipid) ratio. White areas represent background regions of the map that were omitted after selecting cellular regions. Cells were mapped using 532 nm, 0.5 s acquisition, 15 mW laser power, 1 μm step size in x and y and a spectral center of 3000 cm–1. Example regions of high intensity, potentially corresponding to lipid droplets, are indicted using arrows. Spatial coordinates on images are in μm.
Fig. 4
Fig. 4. Quantitative Raman assessment of global lipid response. The intensity ratios of the Raman peak intensity at 2851 cm–1 divided by the sum of the peak intensities at 2933 cm–1 and 2851 cm–1 for spectra extracted from cell regions in a total of three different cells per condition, were compared. This ratio reflected the lipid/protein ratio in the cells, and the mean and standard deviation for control PC3 cells (DMSO) and drug treated PC3 cells (a), and control PNT2 cells (DMSO) and drug treated PNT2 cells (b) are shown. For PC3 cells and PNT2 cells there was a statistical significance between treatments determined using one-way ANOVA (F(5, 16 233) = 1581, p ≤ 0.0001 and F(5, 20 853) = 2037, p ≤ 0.0001 respectively). A Dunnett's multiple comparisons test revealed a statistically significant difference between control (DMSO, n = 2800) and propranolol treated (n = 3134, p ≤ 0.001), cyclosporin treated (n = 2070, p ≤ 0.001), orlistat treated (n = 2739, p ≤ 0.001) and TOFA treated (n = 3480, p ≤ 0.001) PC3 cells and no significant difference between control and CAY10566 (n = 2016, p = 0.9700) PC3 cells. A Dunnett's multiple comparisons test revealed a statistically significant difference between control (DMSO, n = 3563) and cyclosporin treated (n = 3941, p ≤ 0.001), orlistat treated (n = 3844, p ≤ 0.001), CAY10566 treated (n = 2991, p = 0.0003) and TOFA treated (n = 3998, p ≤ 0.001) PNT2 cells and no significant difference between control and propranolol (n = 2522, p = 0.2388) PNT2 cells. ***p ≤ 0.001; **** ≤ 0.0001. Effect size for each drug treatment relative to control (DMSO) was determined for both PC3 and PNT2 cells where the bar colours correspond to the direction and size of effect size (c).
Fig. 5
Fig. 5. A Raman based phenotypic ‘barcode’. Barcodes were created for PC3 and PNT2 cells treated with a number of lipid altering drugs in comparison to a control cell population. Three Raman cell maps per condition per cell line were measured and for each point corresponding to a cell region, a total of six different intensity ratios were calculated. For each ratio, an effect size was calculated and a whole number value between –3 and 3 was assigned reflective of the size of this. The assigned numbers in the order corresponding to ratio 1, ratio 2, ratio 3, ratio 4, ratio 5, ratio 6 created the first six digits of the barcode. The final digit was the sum of the absolute values of all previous numbers. This was also represented pictorially where the size, direction and colour of bars corresponded to the assigned number for each ratio. Ratio 1 = 2851 cm–1/(2851 cm–1 + 2933 cm–1); ratio 2 = 2881 cm–1/(2881 cm–1 + 2933 cm–1); ratio 3 = 2974 cm–1/(2974 cm–1 + 2933 cm–1); ratio 4 = 2851 cm–1/(2851 cm–1 + 2974 cm–1); ratio 5 = 3013 cm–1/(3013 cm–1 + 2851 cm–1); ratio 6 = 3064 cm–1/(3064 cm–1 + 2933 cm–1).

References

    1. Siegel R. L., Miller K. D., Jemal A. Ca-Cancer J. Clin. 2016;66:7–30. - PubMed
    1. Tennant D. A., Duran R. V., Gottlieb E. Nat. Rev. Cancer. 2010;10:267–277. - PubMed
    1. Ferrari M. Nat. Rev. Cancer. 2005;5:161–171. - PubMed
    1. Koppenol W. H., Bounds P. L., Dang C. V. Nat. Rev. Cancer. 2011;11:325–337. - PubMed
    1. Warburg O. Science. 1956;123:309–314. - PubMed

LinkOut - more resources