Intraosseous pressure during loading and with vascular occlusion in an animal model
- PMID: 30258570
- PMCID: PMC6138809
- DOI: 10.1302/2046-3758.78.BJR-2017-0343.R2
Intraosseous pressure during loading and with vascular occlusion in an animal model
Abstract
Objectives: We studied subchondral intraosseous pressure (IOP) in an animal model during loading, and with vascular occlusion. We explored bone compartmentalization by saline injection.
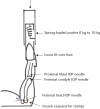
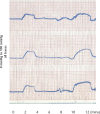
Materials and methods: Needles were placed in the femoral condyle and proximal tibia of five anaesthetized rabbits and connected to pressure recorders. The limb was loaded with and without proximal vascular occlusion. An additional subject had simultaneous triple recordings at the femoral head, femoral condyle and proximal tibia. In a further subject, saline injections at three sites were carried out in turn.
Results: Loading alone caused a rise in subchondral IOP from 11.7 mmHg (sd 7.1) to 17.9 mmHg (sd 8.1; p < 0.0002). During arterial occlusion, IOP fell to 5.3 mmHg (sd 4.1), then with loading there was a small rise to 7.6 mmHg (sd 4.5; p < 0.002). During venous occlusion, IOP rose to 20.2 mmHg (sd 5.8), and with loading there was a further rise to 26.3 mmHg (sd 6.3; p < 0.003). The effects were present at three different sites along the limb simultaneously. Saline injections showed pressure transmitted throughout the length of the femur but not across the knee joint.
Conclusion: This is the first study to report changes in IOP in vivo during loading and with combinations of vascular occlusion and loading. Intraosseous pressure is not a constant. It is reduced during proximal arterial occlusion and increased with proximal venous occlusion. Whatever the perfusion state, in vivo load is transferred partly by hydraulic pressure. We propose that joints act as hydraulic pressure barriers. An understanding of subchondral physiology may be important in understanding osteoarthritis and other bone diseases.Cite this article: M. Beverly, S. Mellon, J. A. Kennedy, D. W. Murray. Intraosseous pressure during loading and with vascular occlusion in an animal model. Bone Joint Res 2018;7:511-516. DOI: 10.1302/2046-3758.78.BJR-2017-0343.R2.
Keywords: Intraosseous; Physiology; Pressure; Subchondral; Weight bearing.
Conflict of interest statement
Conflict of Interest Statement: None declared
Figures


Similar articles
-
Walking on water: subchondral vascular physiology explains how joints work and why they become osteoarthritic.EFORT Open Rev. 2023 Jun 8;8(6):436-442. doi: 10.1530/EOR-23-0002. EFORT Open Rev. 2023. PMID: 37289053 Free PMC article. Review.
-
Factors affecting intraosseous pressure measurement.J Orthop Surg Res. 2018 Jul 28;13(1):187. doi: 10.1186/s13018-018-0877-z. J Orthop Surg Res. 2018. PMID: 30055642 Free PMC article.
-
Subchondral pressures and perfusion during weight bearing.J Orthop Surg Res. 2020 Jun 29;15(1):239. doi: 10.1186/s13018-020-01754-y. J Orthop Surg Res. 2020. PMID: 32600340 Free PMC article.
-
An in vitro model to explore subchondral perfusion and intraosseous pressure.J Exp Orthop. 2019 Aug 30;6(1):39. doi: 10.1186/s40634-019-0207-3. J Exp Orthop. 2019. PMID: 31471704 Free PMC article.
-
Are Subchondral Intraosseous Injections Effective and Safe for the Treatment of Knee Osteoarthritis? A Systematic Review.J Knee Surg. 2019 Nov;32(11):1046-1057. doi: 10.1055/s-0039-1677792. Epub 2019 Feb 6. J Knee Surg. 2019. PMID: 30727022
Cited by
-
Walking on water: subchondral vascular physiology explains how joints work and why they become osteoarthritic.EFORT Open Rev. 2023 Jun 8;8(6):436-442. doi: 10.1530/EOR-23-0002. EFORT Open Rev. 2023. PMID: 37289053 Free PMC article. Review.
-
Combined computational analysis and cytology show limited depth osteogenic effect on bone defects in negative pressure wound therapy.Front Bioeng Biotechnol. 2023 Feb 16;11:1056707. doi: 10.3389/fbioe.2023.1056707. eCollection 2023. Front Bioeng Biotechnol. 2023. PMID: 36873351 Free PMC article.
-
[Clinical analysis of distal radius core decompression for chronic wrist pain].Zhongguo Xiu Fu Chong Jian Wai Ke Za Zhi. 2023 Jul 15;37(7):815-820. doi: 10.7507/1002-1892.202303131. Zhongguo Xiu Fu Chong Jian Wai Ke Za Zhi. 2023. PMID: 37460177 Free PMC article. Chinese.
-
Changes in bone density, intraosseous pressure of distal femoral articular cartilage and subchondral bone after proximal femoral medullary cavity cement filling in rabbits.Exp Ther Med. 2021 Aug;22(2):839. doi: 10.3892/etm.2021.10271. Epub 2021 Jun 6. Exp Ther Med. 2021. PMID: 34149885 Free PMC article.
-
Subchondral physiology and vasculo-mechanical factors in load transmission and osteoarthritis.Bone Joint Res. 2021 Sep;10(9):571-573. doi: 10.1302/2046-3758.109.BJR-2021-0031.R1. Bone Joint Res. 2021. PMID: 34470462 Free PMC article. No abstract available.
References
-
- Afoke NY, Byers PD, Hutton WC. Contact pressures in the human hip joint. J Bone Joint Surg [Br] 1987;69-B:536-541. - PubMed
-
- Day WH, Swanson SA, Freeman MA. Contact pressures in the loaded human cadaver hip. J Bone Joint Surg [Br] 1975;57-B:302-313. - PubMed
-
- Denham RA. Hip mechanics. J Bone Joint Surg [Br] 1959;41-B:550-557. - PubMed
LinkOut - more resources
Full Text Sources
Other Literature Sources

