. 2018 Sep 19:6:e5623.
doi: 10.7717/peerj.5623. eCollection 2018.

Potential changes in the distribution of Carnegiea gigantea under future scenarios

Affiliations

Potential changes in the distribution of Carnegiea gigantea under future scenarios

Fabio Albuquerque et al. PeerJ. .

Abstract

Over the last decades several studies have identified that the directional changes in climate induced by anthropogenic emissions of greenhouse gases are affecting the ecology of desert ecosystems. In the Southwest United States, the impacts of climate change to plant abundance and distribution have already been reported, including in the Sonoran Desert ecosystem, home of the iconic Saguaro (Carnegiea gigantea). Hence, there is an urgent need to assess the potential impacts of climate change on the saguaro. The goals of this study are to provide a map of actual habitat suitability (1), describe the relationships between abiotic predictors and the saguaro distribution at regional extents (2), and describe the potential effect of climate change on the spatial distribution of the saguaro (3). Species Distribution Modeling (SDM) was used to investigate the relationships between abiotic variables and the Saguaro distribution. SDMs were calibrated using presence records, 2,000 randomly-generated pseudo absences, and ten abiotic variables. Of these, annual precipitation and max temperature of the warmest month was found to have the greatest relative influence on saguaro distribution. SDMs indicated that 6.9% and 8.1% of the current suitable habitat is predicted to be lost by 2050 and 2070, respectively. Therefore, predicted changes in climate may result in a substantial contraction of the suitable habitat for saguaro over the next century. By identifying the drivers of saguaro distribution and assessing potential changes in habitat suitability due to climate change, this study will help practitioners to design more comprehensive strategies to conserve the saguaro in the face of climate change.

Keywords: Biogeography; Cactaceae; Climate change; Saguaro; Sonoran desert; Spatial analysis; Species distribution; Species distribution models.


Conflict of interest statement

The authors declare there are no competing interests.

Figures
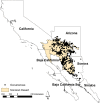
Figure 1
Figure 1. Geographical distribution of the Sonoran Desert and occurrences.
Geographical distribution of the Sonoran Desert and occurrences points used in this study. The limits of the Sonoran Desert were extracted from The Nature Conservancy’s core global spatial data (TNC, 2018).
Figure 2
Figure 2. Variable importance measures.
Variable importance measures as produced by boosted tree regressions. Variables are annual precipitation, max temperature of warmest month (Max t. of the warmest month), annual mean temperature (A. mean temperature), mean temperature of wettest quarter (Mean t. of the wettest quarter), precipitation Seasonality, topographic openness index, topographic wetness index and potential income radiation (mean, p. income radiation).
Figure 3
Figure 3. Partial dependence plots.
Partial dependence plots representing the marginal effect of environmental variables and human footprint on habitat suitability of Saguaro across the Sonoran Desert. Variables are (A) annual precipitation, (B) max temperature of warmest month (Max t. of the warmest month), (C) annual mean temperature (A. mean temperature), (D) mean temperature of wettest quarter (Mean t. of the wettest quarter), (E) precipitation Seasonality, (F) topographic openness index, (G) topographic wetness index and (H) potential income radiation (mean, p. income radiation). Y values are in logit scale and represent the marginal effects of explanation variables on saguaro suitability.
Figure 4
Figure 4. Map of habitat suitability of Saguaro.
Geographical distribution of habitat suitability of Saguaro across the Sonoran Desert.
Figure 5
Figure 5. Potential changes.
Geographical distribution of predicted actual Saguaro distribution (2017), according to the boosted tree regression model, and potential changes in ranges in saguaro’s range under future climate change scenarios for 2050 ((A–D) average for 2041–2060) and 2070 ((E–H) average for 2061–2080).
Figure 6
Figure 6. Impact of changes in annual meant temperature and annual precipitation on defining expansion, refuge, and contraction areas.
The impact of changes in annual precipitation (A–D) and annual mean temperature (E–H) on defining expansion, refuge, and contraction areas for four Representative Concentration Pathways (RCPs): RCP2.6, RCP4.5, RCP6.0 and RCP8.5. Y values represent the differences in temperature and rainfall between today and 2070. The central line represents the median. The lower and upper hinges correspond to the first and third quartiles (the 25th and 75th percentiles). Upper and lower whiskers extend to the largest and lower value, but no further than 1.5 multiplied by the distance between the first and third quartiles. Outliers were not plotted for clarity.

References

    1. Anderson MK. SAGUARO CACTUS Carnegiea gigantea (Engelm.)—plant guide. University of California; Davis: 2006.
    1. Araújo MB, Rahbek C. How does climate change affect biodiversity? Science. 2006;313:1396–1397. doi: 10.1126/science.1131758. - DOI - PubMed
    1. Archer SR, Predick KI. Climate change and ecosystems of the Southwestern United States. Rangelands. 2008;30(3):23–28.
    1. Arizona-Sonora Desert Museum Sonoran Desert: regional natural history and image galleries. 2018. https://www.desertmuseum.org/desert/sonora.php. [5 August 2018]. https://www.desertmuseum.org/desert/sonora.php
    1. Arundel ST. Using spatial models to establish climatic limiters of plant species’ distributions. Ecological Modelling. 2005;182:159–181. doi: 10.1016/j.ecolmodel.2004.07.016. - DOI

LinkOut - more resources