. 2018 Sep 11:6:121.
doi: 10.3389/fbioe.2018.00121. eCollection 2018.

Metabolite-Centric Reporter Pathway and Tripartite Network Analysis of Arabidopsi s Under Cold Stress

Affiliations

Metabolite-Centric Reporter Pathway and Tripartite Network Analysis of Arabidopsi s Under Cold Stress

Ibrahim Koç et al. Front Bioeng Biotechnol. .

Abstract

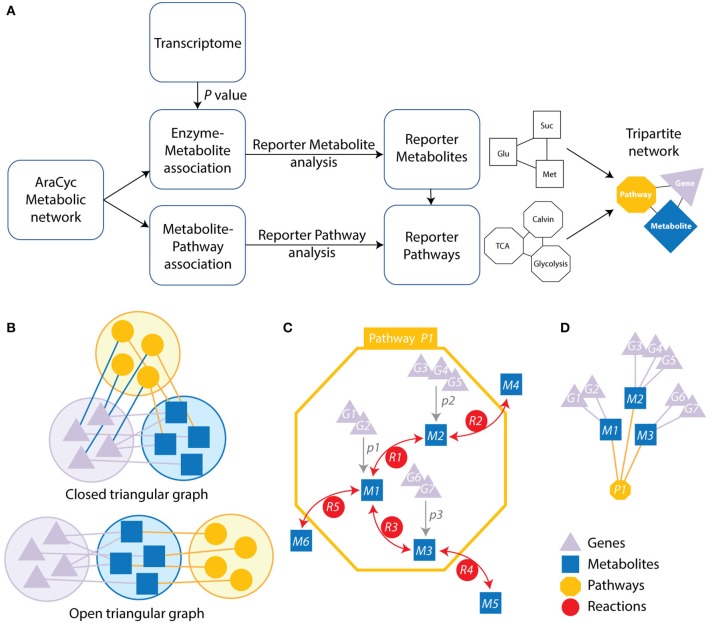
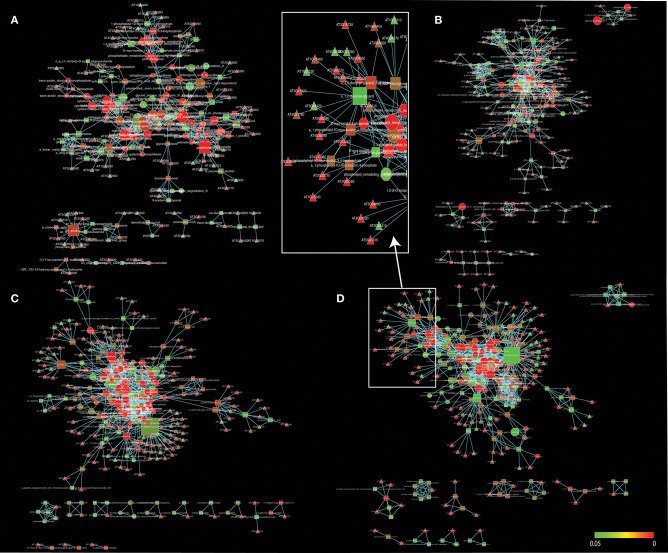
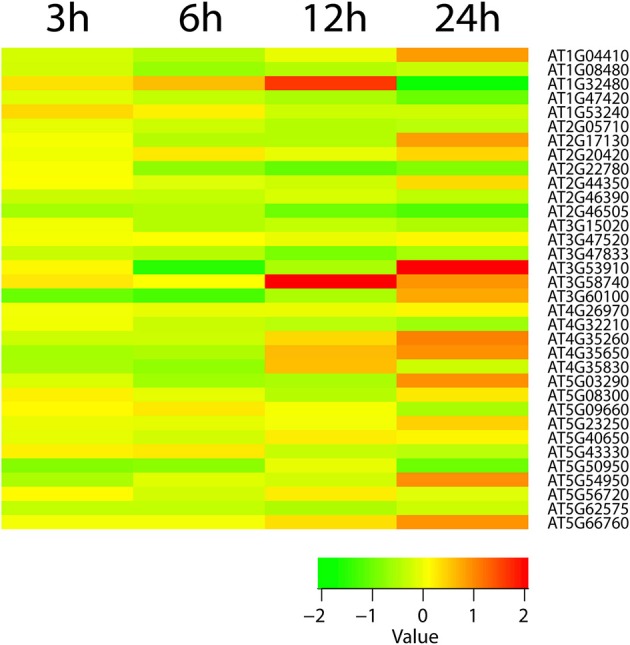
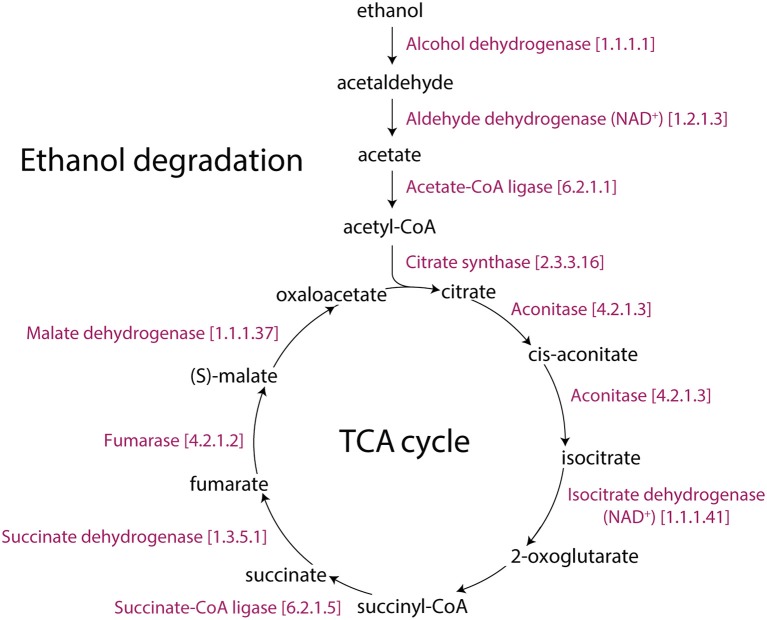
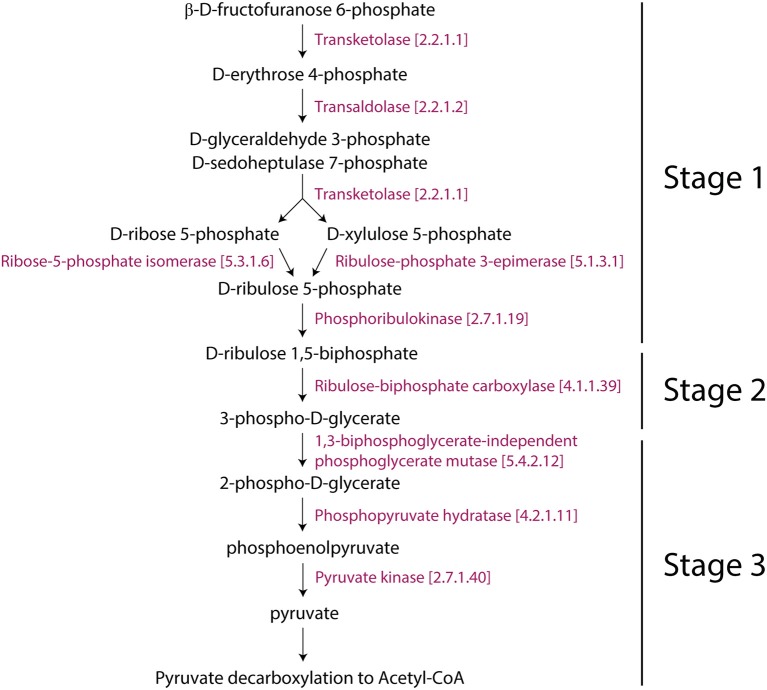
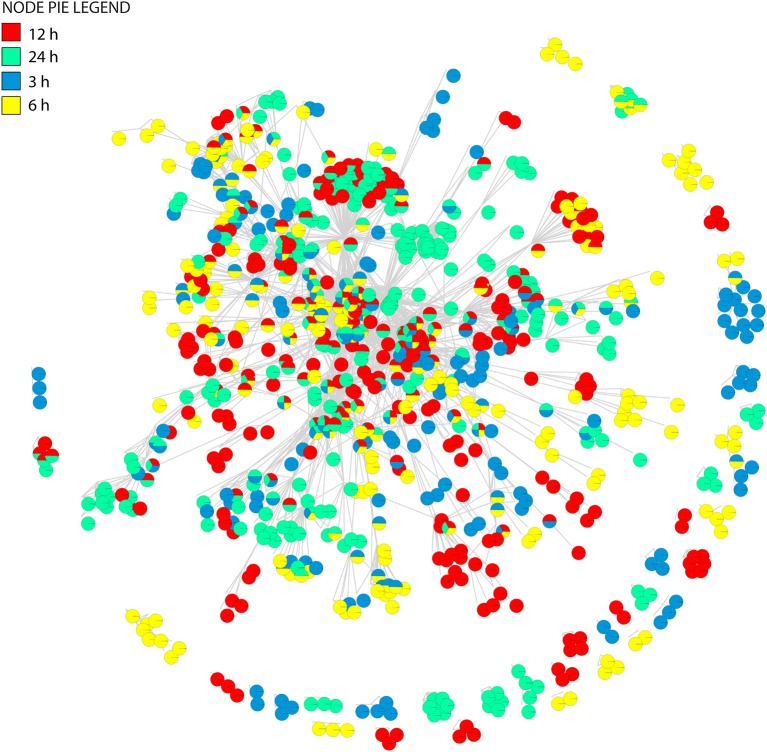
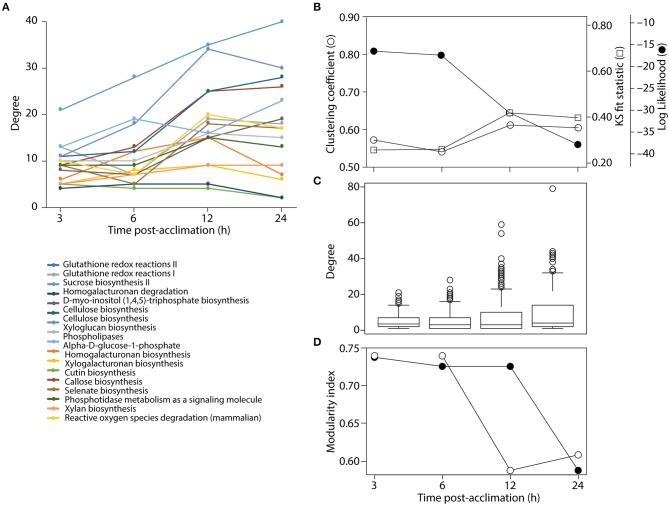
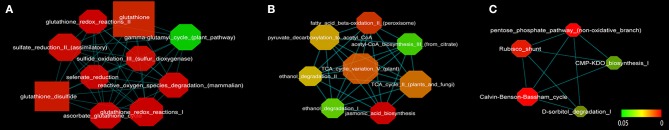
The study of plant resistance to cold stress and the metabolic processes underlying its molecular mechanisms benefit crop improvement programs. Here we investigate the effects of cold stress on the metabolic pathways of Arabidopsis when directly inferred at system level from transcriptome data. A metabolite-centric reporter pathway analysis approach enabled the computation of metabolites associated with transcripts at four time points of cold treatment. Tripartite networks of gene-metabolite-pathway connectivity outlined the response of metabolites and pathways to cold stress. Our metabolome-independent analysis revealed stress-associated metabolites in pathway routes of the cold stress response, including amino acid, carbohydrate, lipid, hormone, energy, photosynthesis, and signaling pathways. Cold stress first triggered the mobilization of energy from glycolysis and ethanol degradation to enhance TCA cycle activity via acetyl-CoA. Interestingly, tripartite networks lacked power law behavior and scale free connectivity, favoring modularity. Network rewiring explicitly involved energetics, signal, carbon and redox metabolisms and membrane remodeling.

Keywords: cold stress; microarray; network modularity; pathway analysis; power law; reporter metabolite; reporter pathway.


Figures

Figure 1
Figure 1
Strategy and schematic representation of the metabolic-centric reporter pathway analysis (RPAm) and its visualization with a tripartite network. (A) The flow diagram describes the computational strategy of the reporter pathway analysis and the integration of transcriptome data. P-values for differentially expressed genes are mapped onto metabolites associated genes. Each enzyme is assigned a score based on the average of the P-values of the probe sets representing the corresponding gene. Minimum P-values are chosen for a reaction catalyzed by an enzyme complex or a set of isoenzymes. P-values are then converted into Z scores and corrected with a background Z score distribution. The resulting scores are linked to related pathways, which are represented with a tripartite network. (B) Open and closed tripartite networks always connect nodes of different sets, with or without restrictions in how sets are connected with each other, respectively. (C) A pathway (yellow octagon) defines a set of reactions (red circles labeled with letter R) connecting metabolites (blue squares labeled with M). Genes (purple triangles labeled with G) can be associated to specific metabolites (gray arrows) when these are collectively significantly expressed at some P-value (labeled with p) over some threshold. (D) The resulting open tripartite network of genes, metabolites and pathways derived from the associations of (C).
Figure 2
Figure 2
A gene-metabolite-pathway tripartite network of significant changes (P ≤ 0.05) for 3 h (A), 6 h (B), 12 h (C), and 24 h (D) cold acclimated Arabidopsis. Triangles represent genes, rectangles represent metabolites and octagons represent pathways. Red color range shows most significant genes, metabolites and pathways. Node sizes were scaled to number of neighbors. The networks were visualized by Force directed layout. The white squares represent snapshot of the network. Cytoscape files for network visualization are deposited in https://github.com/gcalab/files.
Figure 3
Figure 3
The heatmap diagram of expression profile of TCA cycle genes. Red color hues indicates gene up-regulation while green color hues indicates down-regulation. The green-to-red scale below the heatmap describes expression values.
Figure 4
Figure 4
The TCA and ethanol degradation II pathways of Arabidopsis. The Aracyc diagram illustrates the enzymes with corresponding EC numbers and substrates that makeup these metabolic routes.
Figure 5
Figure 5
Representation of the Rubisco shunt in Arabidopsis with consecutive enzymes. The pathway was taken from Aracyc.
Figure 6
Figure 6
The union of tripartite networks. The pie-node representation enables to identify presence/absence of individual nodes across four time dependent networks.
Figure 7
Figure 7
Analysis of network structure. (A) Connectivity of common nodes for all time points. (B) Analysis of network modularity using the clustering algorithm and some statistical descriptor of power law behavior of tripartite networks over time. (C) Boxplots show the span of connectivity measured by node degree for each time point. (D) Analysis of modularity with the FGC (closed circles) and NG (open circles) algorithms.
Figure 8
Figure 8
Sub-network association of pathways at selected time points. (A) Sub-network of redox metabolism at 3 h cold acclimation. (B) Sub-network of energy metabolism at 3 h cold acclimation. (C) Sub-network of carbon metabolism at 12 h cold acclimation. Red color range shows most significant genes, metabolites, and pathways.

Similar articles

Cited by

References

    1. Akkiprik M., Peker I., Özmen T., Amuran G., Güllüoglu B., Kaya H., et al. . (2015). Identification of differentially expressed IGFBP5-related genes in breast cancer tumor tissues using cDNA microarray experiments. Genes 6, 1201–1214. 10.3390/genes6041201 - DOI - PMC - PubMed
    1. Aubert S. (2004). Methyl- -D-glucopyranoside in higher plants: accumulation and intracellular localization in Geum montanum L. leaves and in model systems studied by 13C nuclear magnetic resonance. J. Exp. Bot. 55, 2179–2189. 10.1093/jxb/erh235 - DOI - PubMed
    1. Aziz M. F., Caetano-Anollés K., Caetano-Anollés G. (2016). The early history and emergence of molecular functions and modular scale-free network behavior. Sci. Rep. 6:25058. 10.1038/srep25058 - DOI - PMC - PubMed
    1. Badejo A. A., Tanaka N., Esaka M. (2008). Analysis of GDP-D-mannose pyrophosphorylase gene promoter from Acerola (Malpighia glabra) and Increase in ascorbate content of transgenic tobacco expressing the Acerola gene. Plant Cell Physiol. 49, 126–132. 10.1093/pcp/pcm164 - DOI - PubMed
    1. Bakht J., Bano A., Dominy P. (2006). The role of abscisic acid and low temperature in chickpea (Cicer arietinum) cold tolerance. II. Effects on plasma membrane structure and function . J. Exp. Bot. 57, 3707–3715. 10.1093/jxb/erl120 - DOI - PubMed