

FGF2 crosstalk with Wnt signaling in mediating the anabolic action of PTH on bone formation
- PMID: 30258857
- PMCID: PMC6152810
- DOI: 10.1016/j.bonr.2018.09.003
FGF2 crosstalk with Wnt signaling in mediating the anabolic action of PTH on bone formation
Abstract
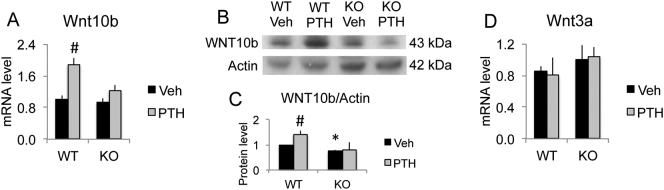
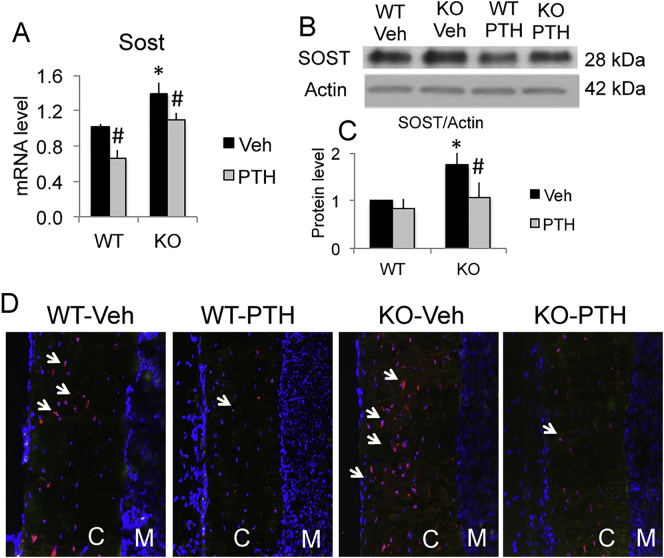
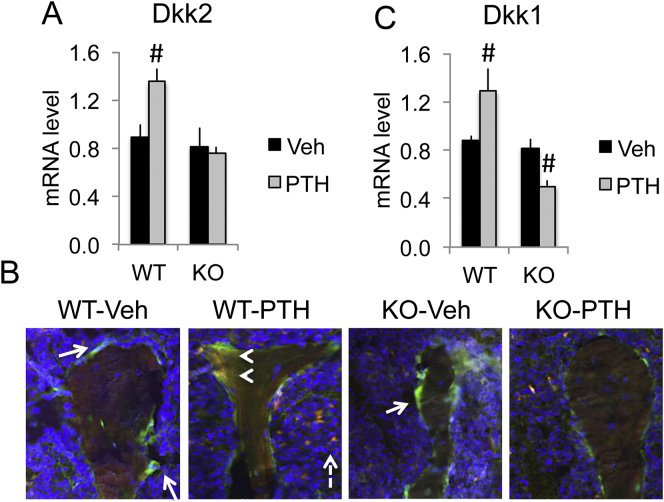
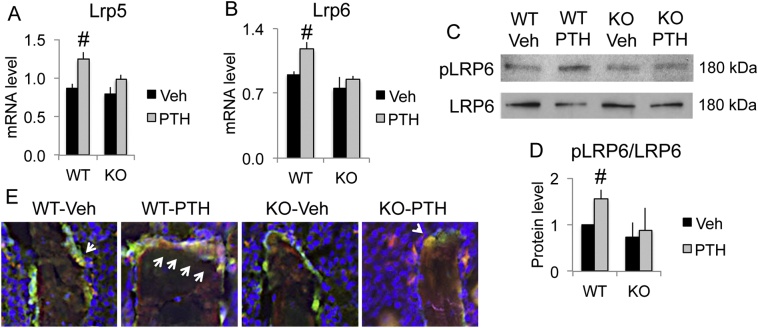
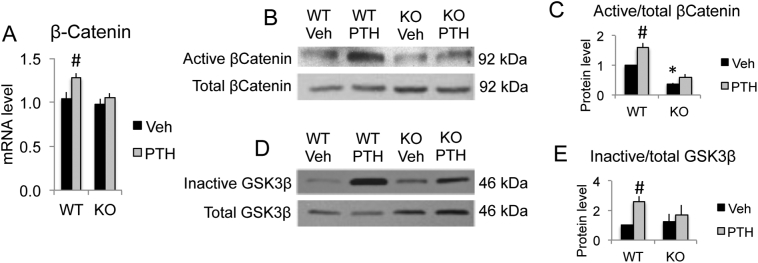
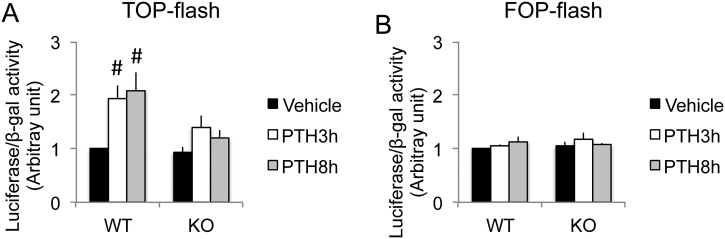
The mechanisms of the anabolic effect of parathyroid hormone (PTH) in bone are not fully defined. The bone anabolic effects of PTH require fibroblast growth factor 2 (FGF2) as well as Wnt signaling and FGF2 modulates Wnt signaling in osteoblasts. In vivo PTH administration differentially modulated Wnt signaling in bones of wild type (WT) and in mice that Fgf2 was knocked out (Fgf2KO). PTH increased Wnt10b mRNA and protein in WT but not in KO mice. Wnt antagonist SOST mRNA and protein was significantly higher in KO group. However, PTH decreased Sost mRNA significantly in WT as well as in Fgf2KO mice, but to a lesser extent in Fgf2KO. Dickhopf 2 (DKK2) is critical for osteoblast mineralization. PTH increased Dkk2 mRNA in WT mice but the response was impaired in Fgf2KO mice. PTH significantly increased Lrp5 mRNA and phosphorylation of Lrp6 in WT but the increase was markedly attenuated in Fgf2KO mice. PTH increased β-catenin expression and Wnt/β-catenin transcriptional activity significantly in WT but not in Fgf2KO mice. These data suggest that the impaired bone anabolic response to PTH in Fgf2KO mice is partially mediated by attenuated Wnt signaling.
Keywords: Bone; FGF2; PTH; Wnt signaling.
Figures
Similar articles
-
Fibroblast growth factor 2 stimulation of osteoblast differentiation and bone formation is mediated by modulation of the Wnt signaling pathway.J Biol Chem. 2011 Nov 25;286(47):40575-83. doi: 10.1074/jbc.M111.274910. Epub 2011 Oct 10. J Biol Chem. 2011. PMID: 21987573 Free PMC article.
-
The impaired bone anabolic effect of PTH in the absence of endogenous FGF2 is partially due to reduced ATF4 expression.Biochem Biophys Res Commun. 2011 Aug 19;412(1):160-4. doi: 10.1016/j.bbrc.2011.07.066. Epub 2011 Jul 22. Biochem Biophys Res Commun. 2011. PMID: 21806973 Free PMC article.
-
Role of fibroblast growth factor 2 and Wnt signaling in anabolic effects of parathyroid hormone on bone formation.J Cell Physiol. 2012 Nov;227(11):3539-45. doi: 10.1002/jcp.24075. J Cell Physiol. 2012. PMID: 22378151 Free PMC article. Review.
-
Gait disturbances and muscle dysfunction in fibroblast growth factor 2 knockout mice.Sci Rep. 2021 May 26;11(1):11005. doi: 10.1038/s41598-021-90565-0. Sci Rep. 2021. PMID: 34040128 Free PMC article.
-
[Parathyroid hormone and Wnt signaling].Clin Calcium. 2013 Jun;23(6):847-52. Clin Calcium. 2013. PMID: 23719497 Review. Japanese.
Cited by
-
Mesenchymal Stem Cells, Bioactive Factors, and Scaffolds in Bone Repair: From Research Perspectives to Clinical Practice.Cells. 2021 Jul 29;10(8):1925. doi: 10.3390/cells10081925. Cells. 2021. PMID: 34440694 Free PMC article. Review.
-
Anabolic actions of PTH in murine models: two decades of insights.J Bone Miner Res. 2021 Oct;36(10):1979-1998. doi: 10.1002/jbmr.4389. Epub 2021 Jul 27. J Bone Miner Res. 2021. PMID: 34101904 Free PMC article.
-
Progress of Wnt Signaling Pathway in Osteoporosis.Biomolecules. 2023 Mar 6;13(3):483. doi: 10.3390/biom13030483. Biomolecules. 2023. PMID: 36979418 Free PMC article. Review.
-
Loss of Nmp4 optimizes osteogenic metabolism and secretion to enhance bone quality.Am J Physiol Endocrinol Metab. 2019 May 1;316(5):E749-E772. doi: 10.1152/ajpendo.00343.2018. Epub 2019 Jan 15. Am J Physiol Endocrinol Metab. 2019. PMID: 30645175 Free PMC article.
-
Emerging insights into the comparative effectiveness of anabolic therapies for osteoporosis.Nat Rev Endocrinol. 2021 Jan;17(1):31-46. doi: 10.1038/s41574-020-00426-5. Epub 2020 Nov 4. Nat Rev Endocrinol. 2021. PMID: 33149262 Review.
References
-
- Bellido T., Ali A.A., Gubrij I., Plotkin L.I., Fu Q., O'Brien C.A., Manolagas S.C., Jilka R.L. Chronic elevation of parathyroid hormone in mice reduces expression of sclerostin by osteocytes: a novel mechanism for hormonal control of osteoblastogenesis. Endocrinology. 2005;146:4577–4583. - PubMed
-
- Bennett C.N., O. H., Ma Y.L., Zeng Q., Gerin I., Sousa K.M., Lane T.F., Krishnan V., Hankenson K.D., MacDougald O.A. Wnt10b increases postnatal bone formation by enhancing osteoblast differentiation. J. Bone Miner. Res. 2007;22:1924–1932. - PubMed
-
- Bovolenta P., Esteve P., Ruiz J.M., Cisneros E., Lopez-Rios J. Beyond Wnt inhibition: new functions of secreted Frizzled-related proteins in development and disease. J. Cell Sci. 2008;121:737–746. - PubMed
Grants and funding
LinkOut - more resources
Full Text Sources
Other Literature Sources
Molecular Biology Databases
Research Materials
