. 2017 Feb;1(1-2):1600013.
doi: 10.1002/adbi.201600013. Epub 2017 Jan 5.

Liposomal Delivery Enhances Immune Activation by STING Agonists for Cancer Immunotherapy

Affiliations

Liposomal Delivery Enhances Immune Activation by STING Agonists for Cancer Immunotherapy

Sandeep T Koshy et al. Adv Biosyst. 2017 Feb.

Abstract

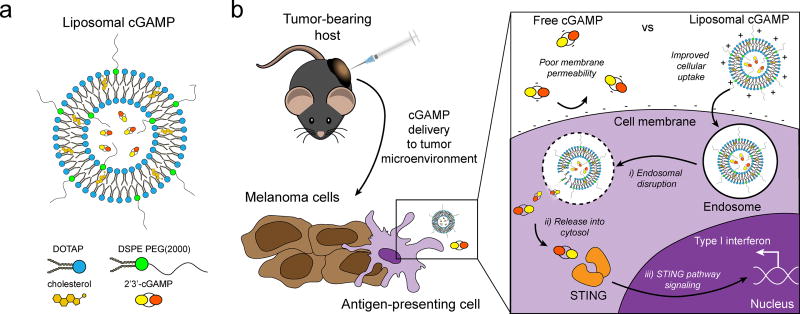
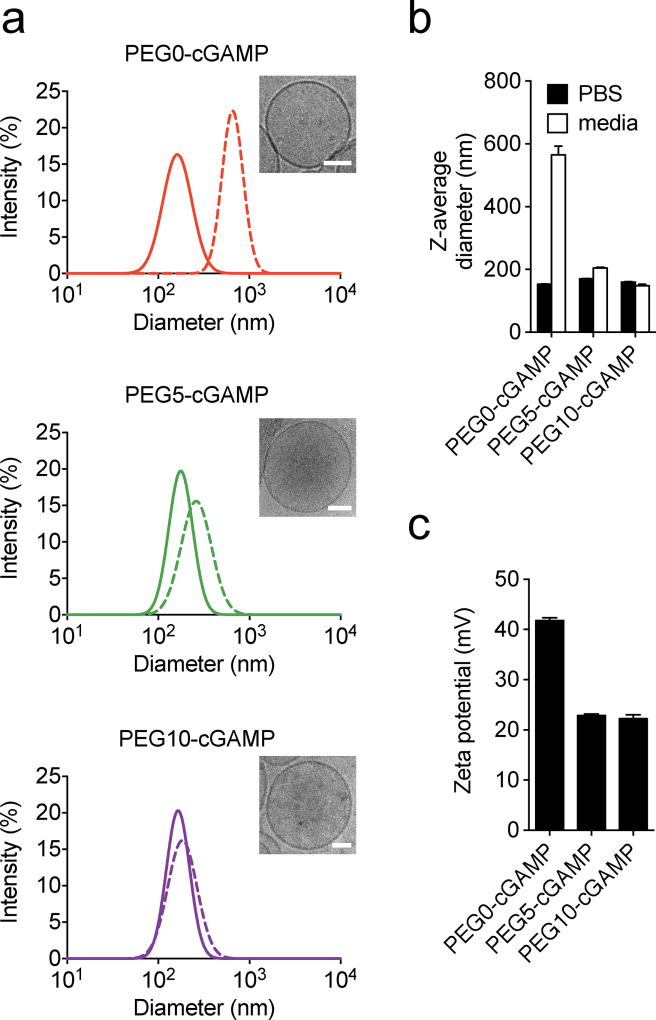
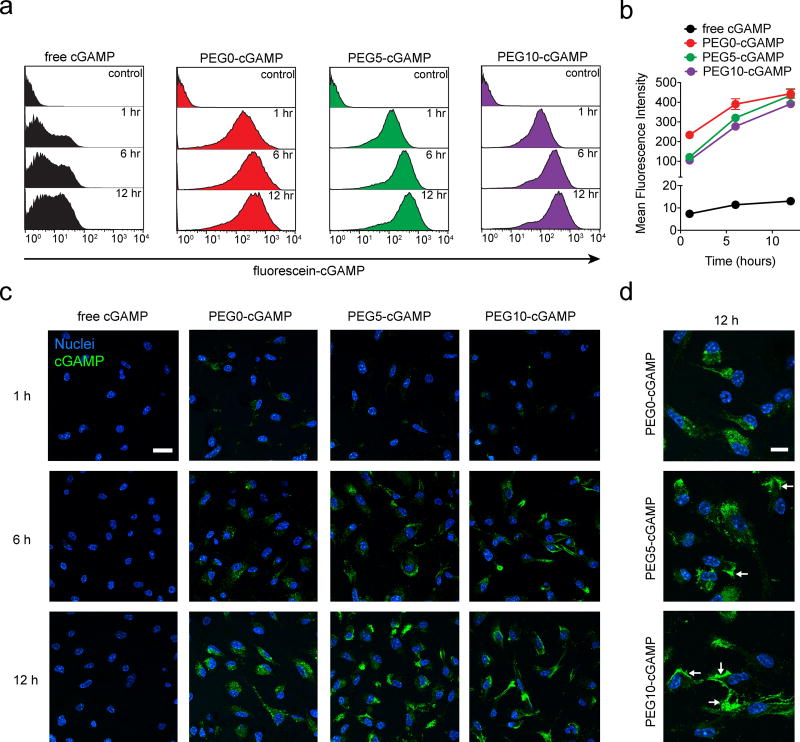
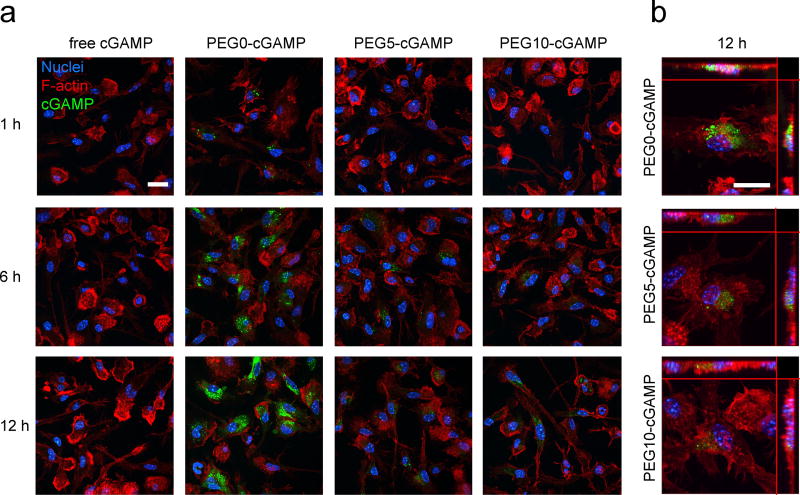
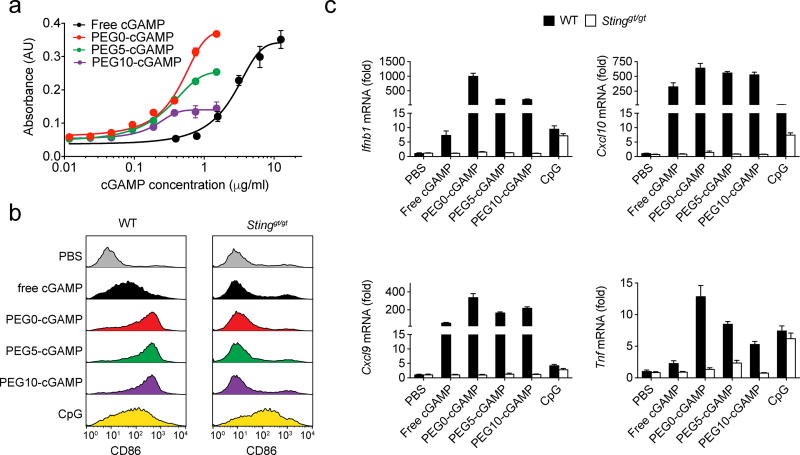
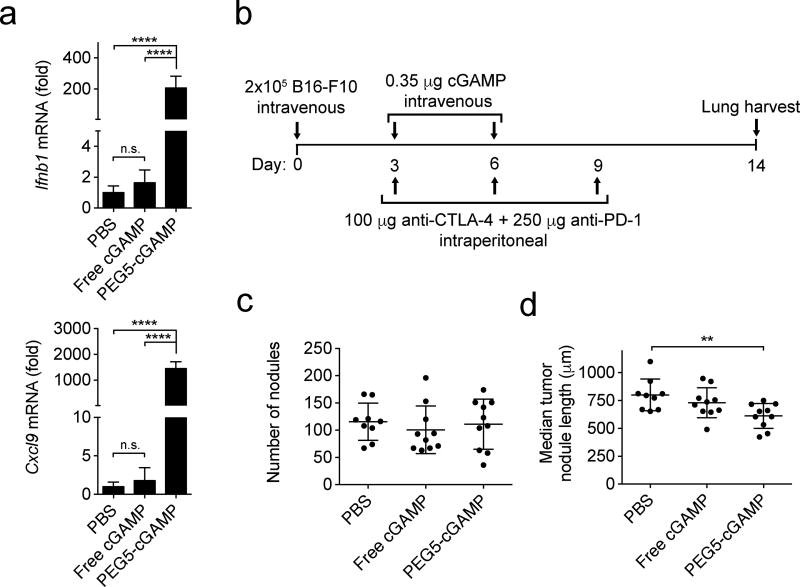
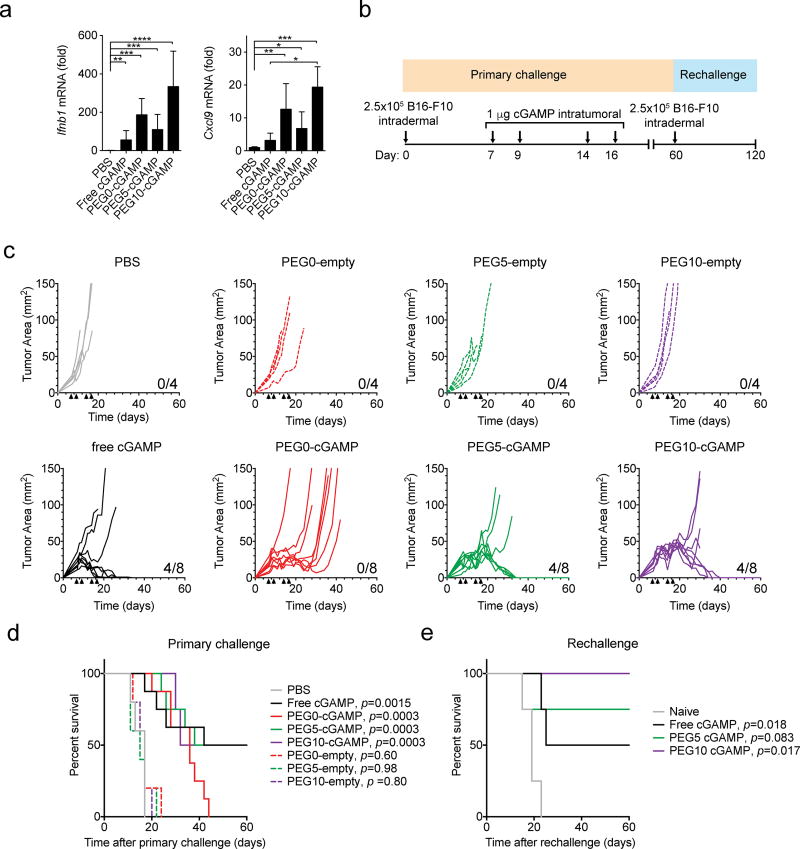
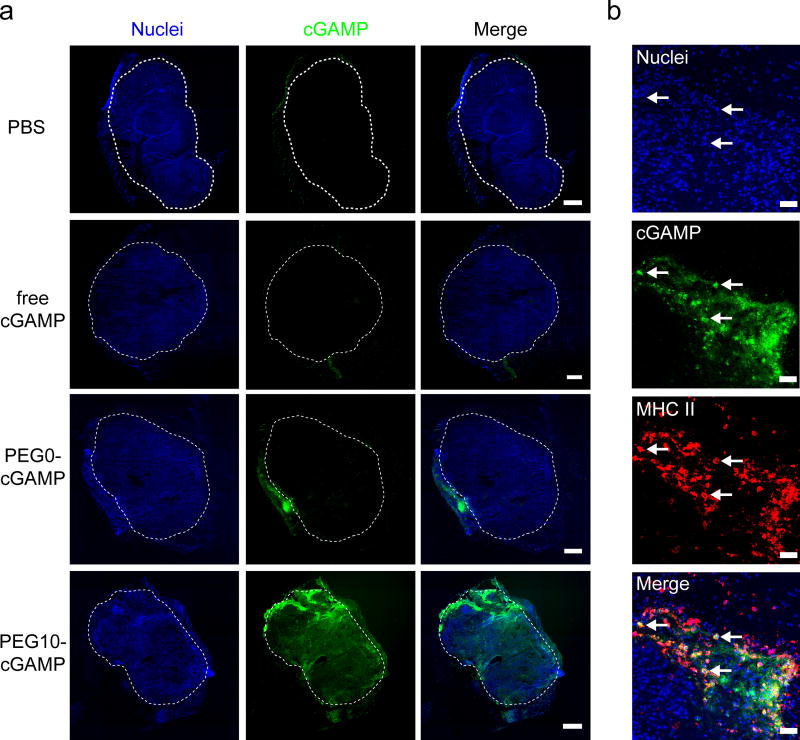
Overcoming the immunosuppressive tumor microenvironment (TME) is critical to realizing the potential of cancer immunotherapy strategies. Agonists of stimulator of interferon genes (STING), a cytosolic immune adaptor protein, have been shown to induce potent anti-tumor activity when delivered into the TME. However, the anionic properties of STING agonists make them poorly membrane permeable, and limit their ability to engage STING in the cytosol of responding cells. In this study, cationic liposomes with varying surface polyethylene glycol (PEG) levels were used to encapsulate cGAMP to facilitate its cytosolic delivery. In vitro studies with antigen-presenting cells (APCs) revealed that liposomal formulations substantially improved the cellular uptake of cGAMP and pro-inflammatory gene induction relative to free drug. Liposomal encapsulation allowed cGAMP delivery to metastatic melanoma tumors in the lung, leading to anti-tumor activity, whereas free drug produced no effect at the same dose. Injection of liposomal cGAMP into orthotopic melanoma tumors showed retention of cGAMP at the tumor site and co-localization with tumor-associated APCs. Liposomal delivery induced regression of injected tumors and produced immunological memory that protected previously treated mice from rechallenge with tumor cells. These results show that liposomal delivery improves STING agonist activity, and could improve their utility in clinical oncology.

Keywords: Liposomes; STING; adjuvants; cGAMP; cancer immunotherapy.


Figures

Figure 1
Figure 1
Schematic of liposomal cGAMP structure and therapeutic strategy. a) 2’3’-cGAMP is encapsulated in cationic liposomes formed from 1,2-dioleoyl-3-trimethylammonium-propane (DOTAP) and cholesterol using thin film rehydration, freeze thawing, and membrane extrusion. A polyethylene glycol(PEG)-containing lipid (1,2-distearoyl-sn-glycero-3-phosphoethanolamine-N-[methoxy(polyethylene glycol)-2000]; DSPE-PEG(2000)) is optionally included in the liposome preparation to create a PEG coating that improves liposome stability. b) In a therapeutic setting, melanoma tumor-bearing hosts are injected with free or liposomal cGAMP, where cells, for example antigen-presenting cells (APCs), in the tumor microenvironment take up liposomal cGAMP concurrent with melanoma cell antigens. (Inset) Free cGAMP has limited transport into the cytosol due to the presence of two negative charges that limit its permeability through the negatively charged cell membrane. cGAMP encapsulated in cationic liposomes shows improved cell membrane binding and uptake. Once internalized into the endosomal compartment, cationic liposomes facilitate the release of cGAMP into the cytosol, where cGAMP binds to the stimulator of interferon genes (STING) adaptor molecule, leading to type I interferon production by the APC.
Figure 2
Figure 2
Physical characterization of liposomal cGAMP formulations. a) Representative Gaussian-smoothed size intensity DLS histograms of liposomal cGAMP formulations containing 0 mol% (PEG0-cGAMP), 5 mol% PEG (PEG5-cGAMP), and 10 mol% PEG (PEG10-cGAMP) measured in PBS (solid lines) or cell culture medium containing 10% FCS (hatched lines). Inset shows a representative cryoEM micrograph of each formulation (scale bars: 50 nm) b) Z-average diameter of the same liposomal cGAMP formulations in PBS or cell culture media. c) Zeta potential measurements of liposomal cGAMP formulations. Data are shown as mean and standard error of three repeated measurements, and are representative of three independent particle preparations.
Figure 3
Figure 3
In vitro association of various cGAMP formulations with BMDC. a) Representative flow cytometry histograms showing timecourse of BMDC association with fluorescein-cGAMP delivered in free or liposomal form at 1 µg ml−1. b) Quantitative flow cytometry timecourse of cell-associated fluorescein-cGAMP signal. Triplicate sampels were used in (a) and (b). c) Confocal microscopy timecourse of BMDC association with fluorescein-cGAMP at 1 µg ml−1 (representative images from 3 slides/condition, scale bar: 20 µm). d) Magnified images of BMDC association with liposomal fluorescein-cGAMP (scale bar: 10 µm). Arrows indicate representative areas of membrane association. Data are shown as mean and standard deviation.
Figure 4
Figure 4
In vitro uptake of various cGAMP formulations by BMDC. a) Confocal microscopy timecourse of BMDC uptake of fluorescein-cGAMP in free or liposomal form at 1 µg ml−1 (representative image from 3 slides/condition, scale bar: 20 µm). b) Z-stack maximum intensity projection image of BMDC uptake of liposomal fluorescein-cGAMP (scale bar: 20 µm). Main image shows view in z-plane and orthogonal side views are shown on top and right.
Figure 5
Figure 5
Comparison of biological activity of various cGAMP formulations. a) Dose-response curves in response to various cGAMP formulations by RAW-Blue ISG cells, which produce a reporter enzyme in response to stimulation of the interferon regulatory factor (IRF) pathway by cGAMP (3 wells/condition). Connecting lines are variable-slope dose-response curve fits. b) Representative flow cytometry histograms of BMDC CD86 expression after stimulation with various cGAMP formulations, and CpG as a positive control, at 1 µg ml−1 for 8 hours (3 wells/condition). Results with BMDCs isolated from both wild-type (WT) and STINGgt/gt mice, which lack STING, are shown. c) Gene expression analysis for interferon-β (Ifnb1), (C-X-C motif) ligand 9 (Cxcl9), (C-X-C motif) ligand 10 (Cxcl10), and tumor necrosis factor (Tnf). WT and STINGgt/gt mice treated with various cGAMP formulations at 1 µg ml−1 for 4 hours. PBS treatment was used as a negative control, while CpG treatment at 1 µg ml−1 for 2 hours was used as a positive control (4 wells/condition). Data are shown as mean and standard deviation.
Figure 6
Figure 6
Impact of systemic delivery of cGAMP in a therapeutic lung metastatic melanoma model. a) Gene expression analysis for interferon-β (Ifnb1), and (C-X-C motif) ligand 9 (Cxcl9) in tumor-bearing lung tissue after intravenous injection of 0.35 µg of free or liposomal cGAMP, or PBS as a control (1-way ANOVA with Tukey’s post hoc test, n=4 mice/condition, ****p < 0.0001, n.s. = not significant). Mice were injected intravenously with B16-F10 cells to establish lung metastases three days prior to treatment. Lungs were harvested for gene expression analysis four hours after treatment. b) Treatment scheme for therapeutic B16-F10 melanoma lung metastatic model. Mice were injected in the tail vein with B16-F10 melanoma cells and treated twice with PBS, free cGAMP or PEG5-cGAMP intravenously on the indicated days. Anti-CTLA-4 and anti-PD-1 antibodies were given by intraperitoneal injection three times as indicated. c) Quantitation of total tumor nodules present on lung surface after study conclusion. Kruskal-Wallis analysis with Dunn’s multiple comparison test was performed and showed no significant differences. d) Quantitation of median tumor nodule length on the lung surface (Kruskal-Wallis analysis with Dunn’s multiple comparison test, **p < 0.01). Data are shown as mean and standard deviation.
Figure 7
Figure 7
Local therapeutic delivery of cGAMP in an orthotopic melanoma model. a) Gene expression analysis for interferon-β (Ifnb1), and (C-X-C motif) ligand 9 (Cxcl9) in orthotopic B16-F10 melanoma tumors treated with various cGAMP formulations at a dose of 1 µg administered intratumorally (1-way ANOVA with Tukey’s post hoc test, n=3 mice/condition, ****p < 0.0001, ***p < 0.001, **p < 0.01, *p < 0.05). Mice were injected intradermally with B16-F10 cells to establish an orthotopic tumor seven days prior to treatment and gene expression analysis. b) Treatment scheme for orthotopic therapeutic B16-F10 melanoma model. B16-F10 cells were injected intradermally in the lateral flank of mice. Four doses of PBS, empty liposomes, free cGAMP, or liposomal cGAMP were injected directly into the tumors at the indicated days, and the tumor size and mouse survival were monitored. Mice that cleared their tumors were injected intradermally in the opposite side of the flank on day 60 with B16-F10 cells and monitored for survival. c) Individual tumor growth curves of mice in various treatment groups. Black arrows indicate the times of intratumoral cGAMP injection. Number of surviving mice in each group are indicated at the bottom right of the graph. d) Overall survival Kaplan-Meier curves for mice treated with the indicated formulations during primary challenge (n=4–8 mice/condition; p values of treatments compared to PBS control by Mantel Cox test shown in legend) e) Overall survival curves for mice previously treated with the indicated formulations during rechallenge (n=3–4 mice/condition; p values of treatments compared to naive control by Mantel Cox test shown in legend). Data in (a) are shown as mean and standard deviation.
Figure 8
Figure 8
Distribution of cGAMP delivered into tumor sites. a) Fluorescence images of 10 µm tissue sections showing distribution of various cGAMP formulations 24 hours after injection into melanoma tumors. Mice were injected intradermally with B16-F10 cells to establish an orthotopic tumor seven days prior to treatment (representative image from n=3 mice/condition, scale bar = 500 µm, white dashed line indicated tumor margin). b) Immunofluorescence on tissue section from PEG10-cGAMP-treated tumor showing cGAMP signal co-localizing with major histocompatibility complex class II (MHC II)-expressing cells (representative image from n=3 mice/condition, scale bar = 50 µm). Arrows show examples of MHC II-expressing cells highly associated with cGAMP signal.

References

    1. Mellman I, Coukos G, Dranoff G. Nature. 2011;480:480. - PMC - PubMed
    1. Topalian SL, Drake CG, Pardoll DM. Cancer Cell. 2015;27:1. - PMC - PubMed
    1. Rosenberg SA, Restifo NP. Science. 2015;348:62. - PMC - PubMed
    1. Barrett DM, Singh N, Porter DL, Grupp SA, June CH. Annu. Rev. Med. 2014;65:333. - PMC - PubMed
    1. Melief CJM, van Hall T, Arens R, Ossendorp F, van der Burg SH. J. Clin. Invest. 2015;125:3401. - PMC - PubMed