Review
. 2019 Apr 1;48(7):2053-2108.
doi: 10.1039/c8cs00618k.

Photothermal therapy and photoacoustic imaging via nanotheranostics in fighting cancer

Affiliations
Review

Photothermal therapy and photoacoustic imaging via nanotheranostics in fighting cancer

Yijing Liu et al. Chem Soc Rev. .

Abstract

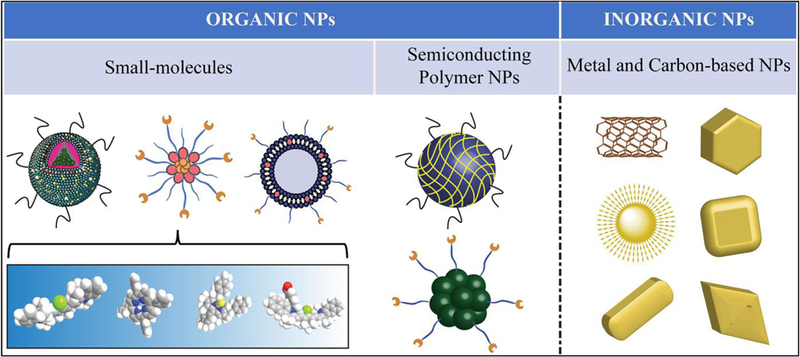
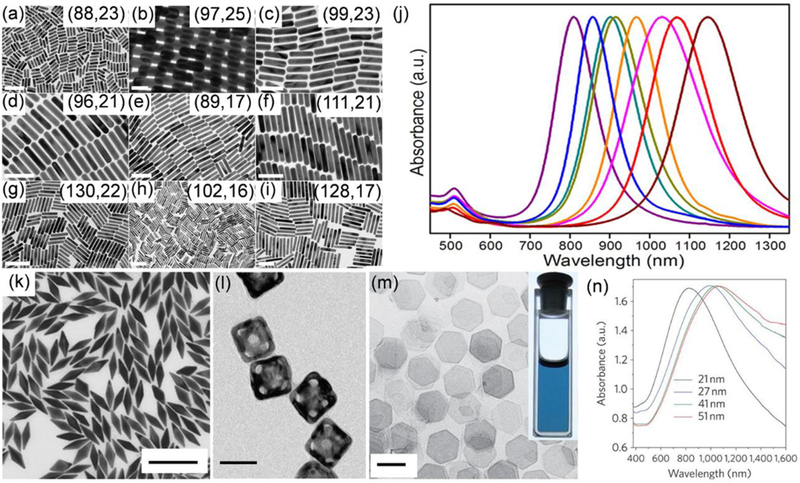
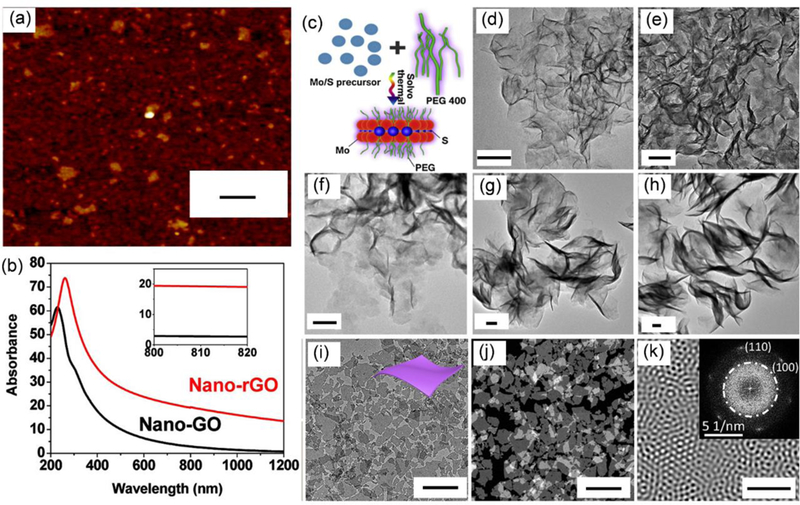
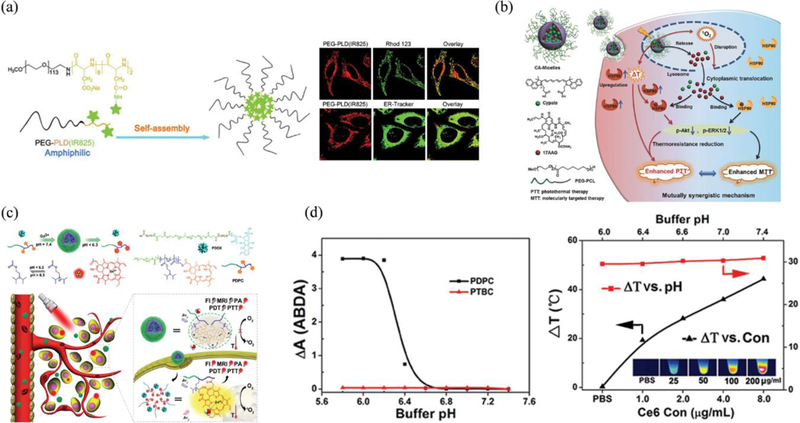
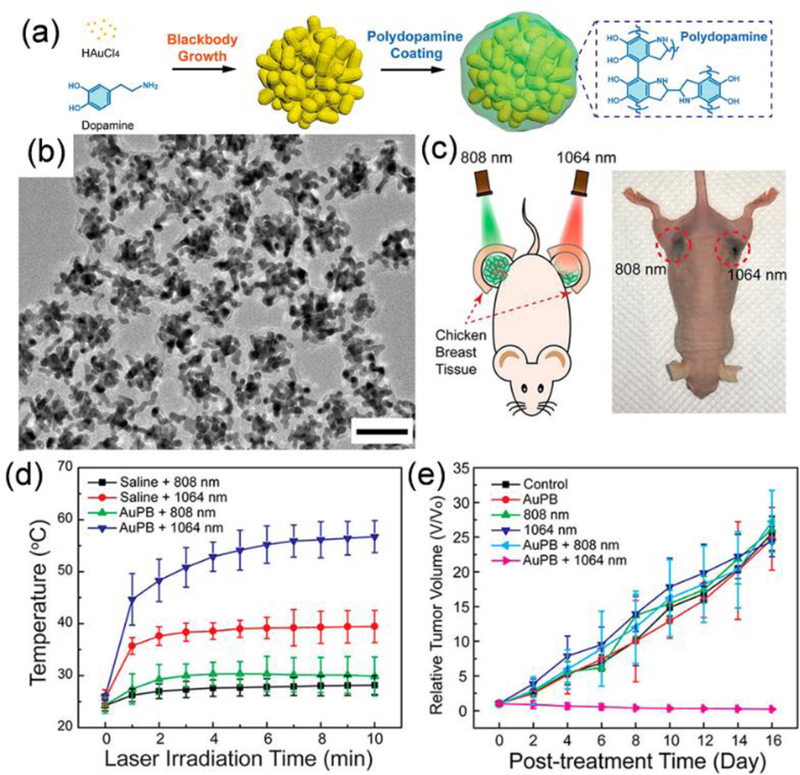
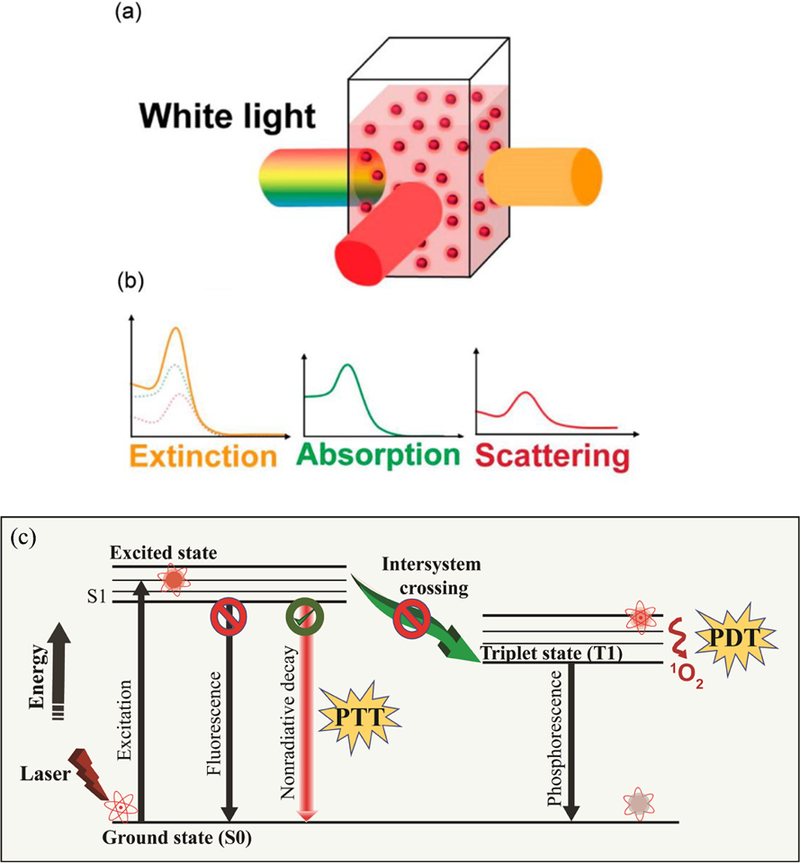
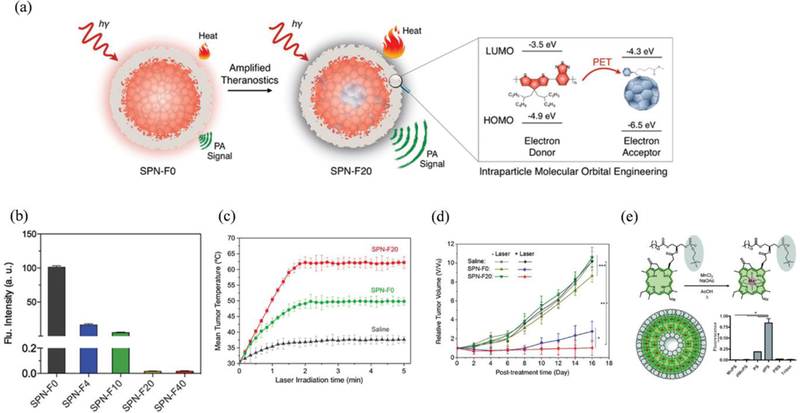
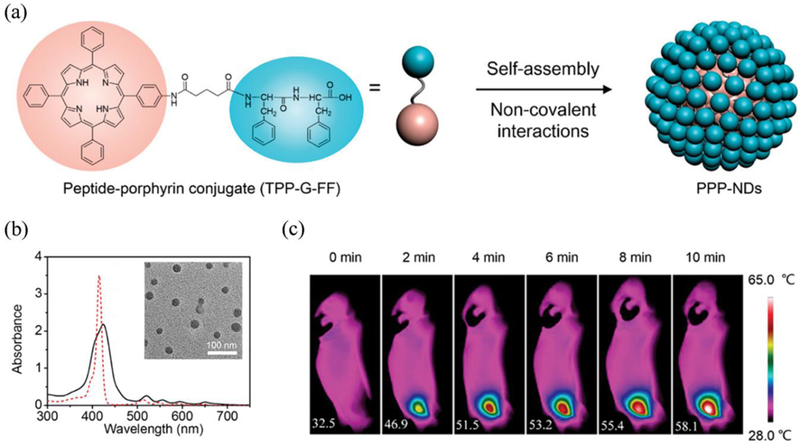
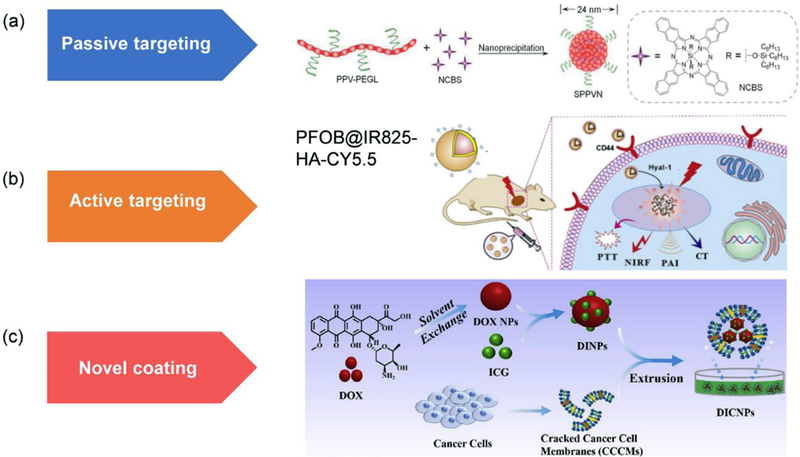
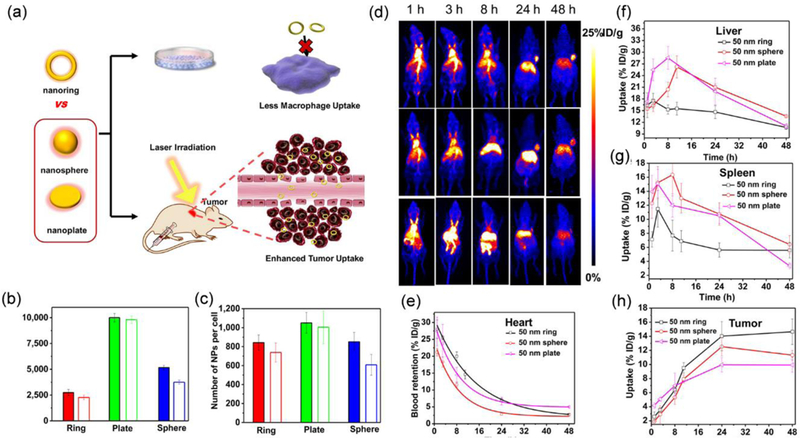
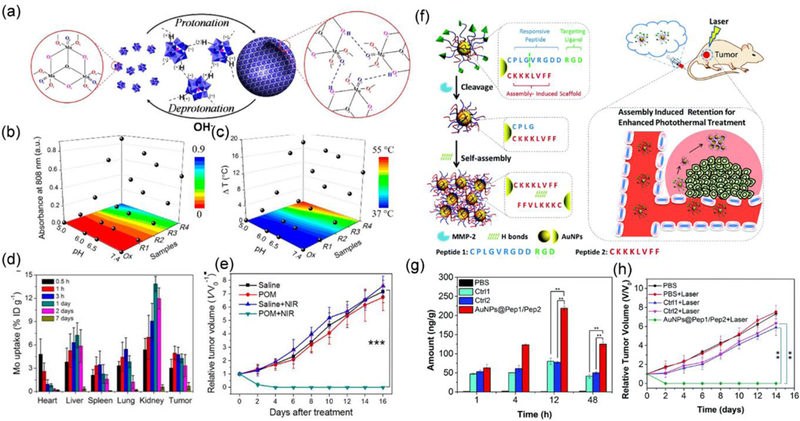
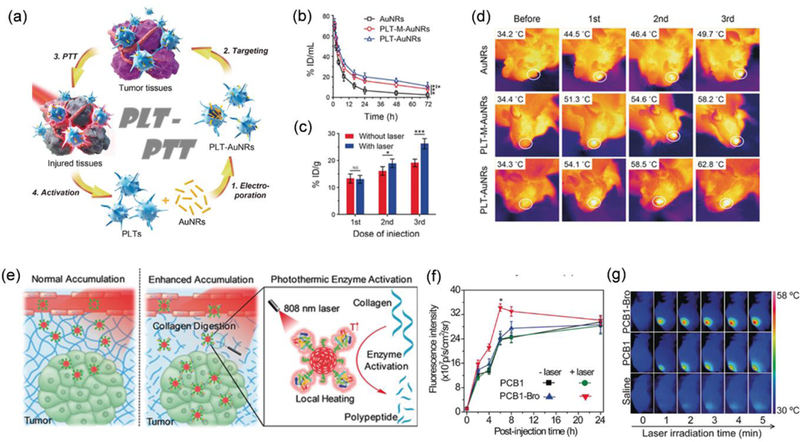
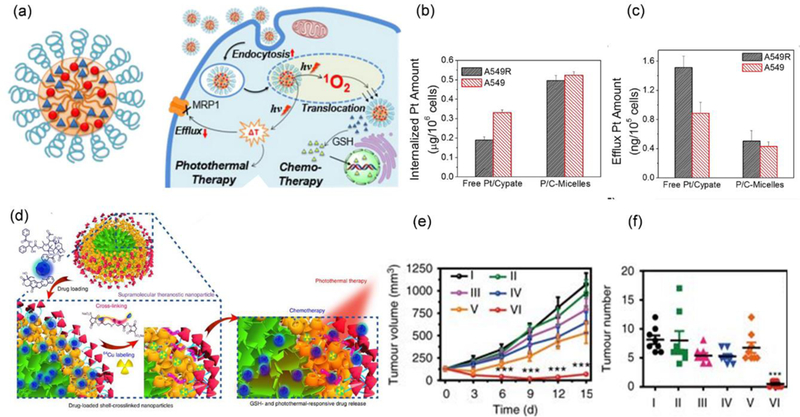
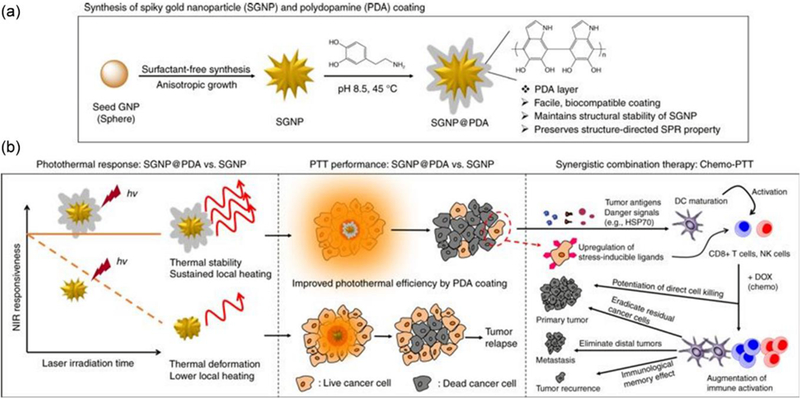
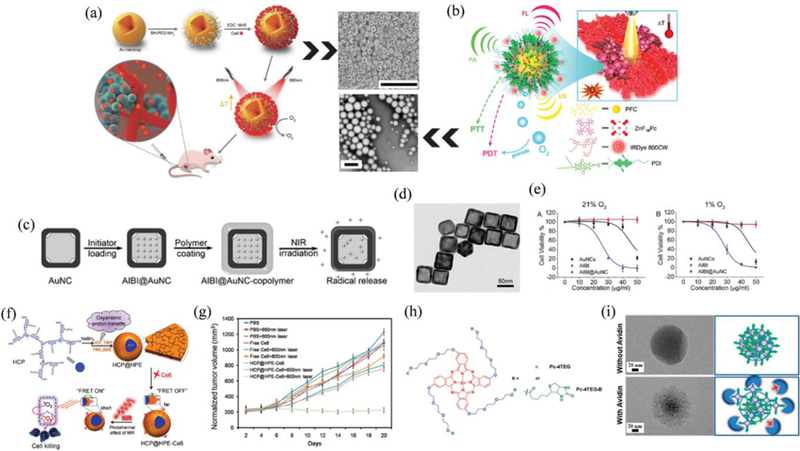
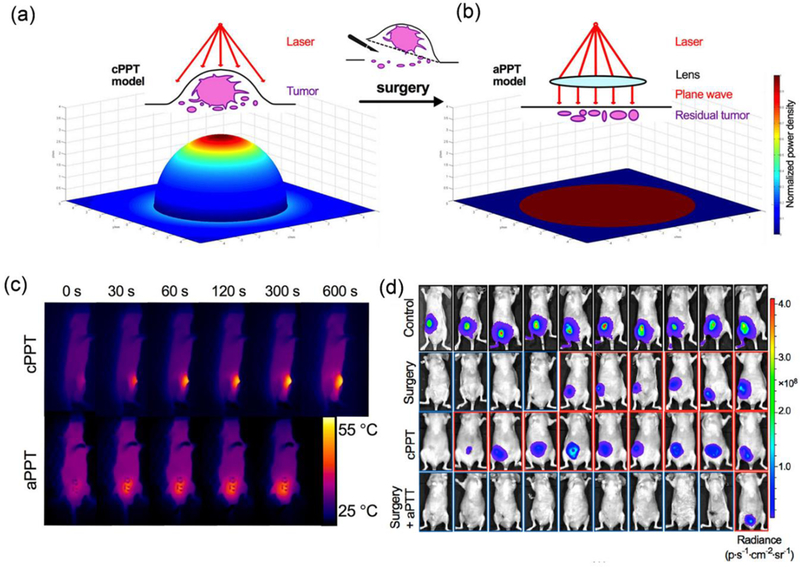
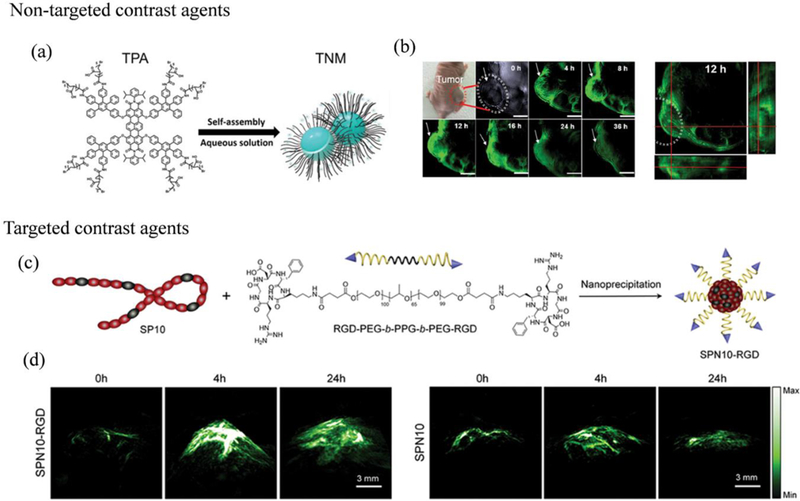
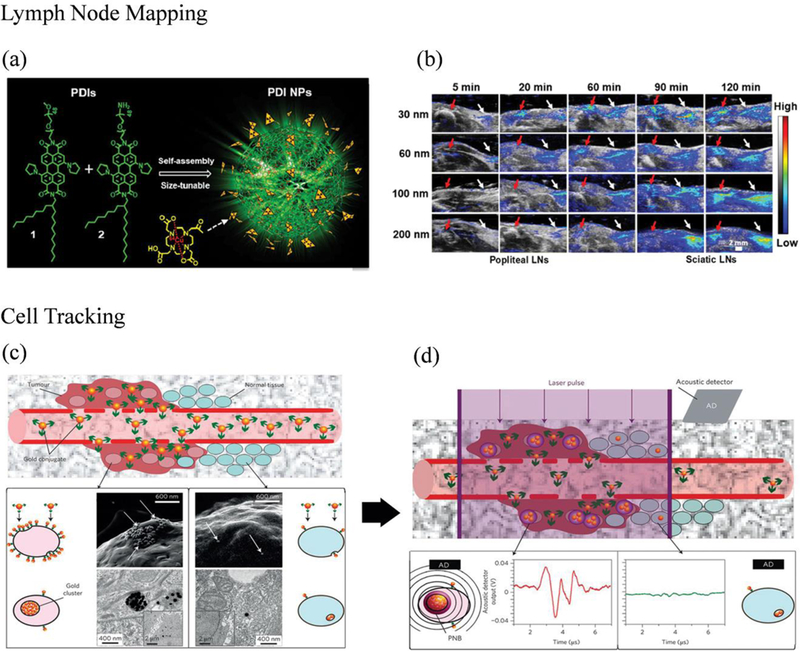
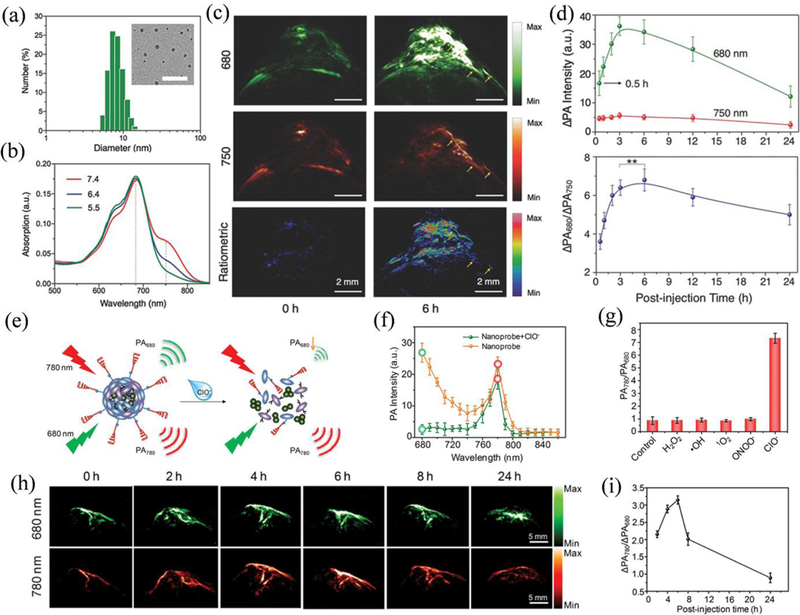
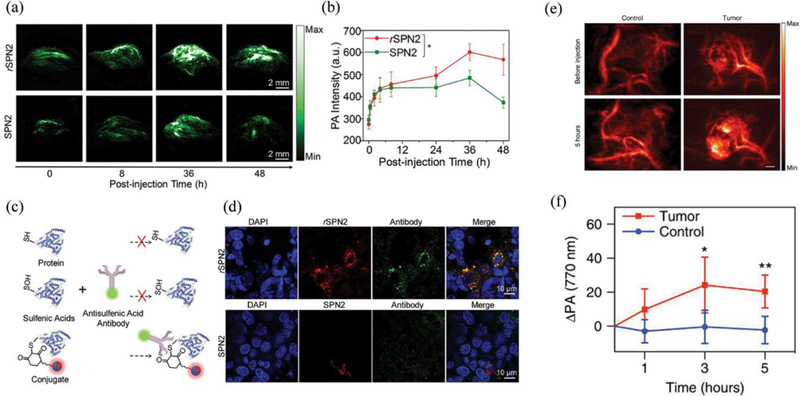
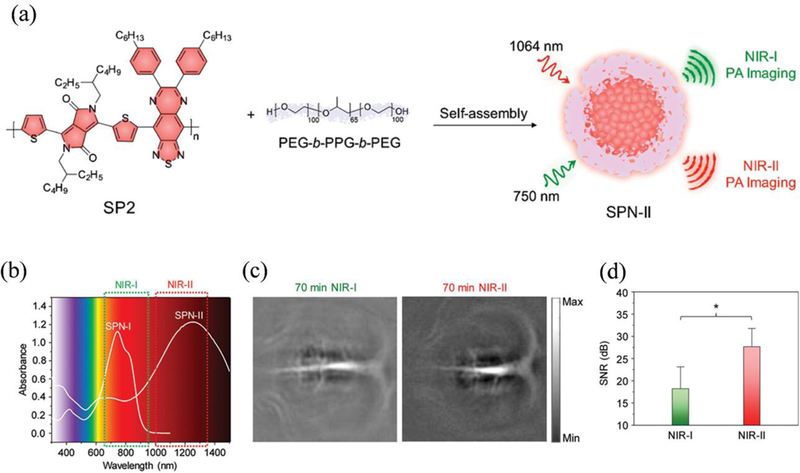
The nonradiative conversion of light energy into heat (photothermal therapy, PTT) or sound energy (photoacoustic imaging, PAI) has been intensively investigated for the treatment and diagnosis of cancer, respectively. By taking advantage of nanocarriers, both imaging and therapeutic functions together with enhanced tumour accumulation have been thoroughly studied to improve the pre-clinical efficiency of PAI and PTT. In this review, we first summarize the development of inorganic and organic nano photothermal transduction agents (PTAs) and strategies for improving the PTT outcomes, including applying appropriate laser dosage, guiding the treatment via imaging techniques, developing PTAs with absorption in the second NIR window, increasing photothermal conversion efficiency (PCE), and also increasing the accumulation of PTAs in tumours. Second, we introduce the advantages of combining PTT with other therapies in cancer treatment. Third, the emerging applications of PAI in cancer-related research are exemplified. Finally, the perspectives and challenges of PTT and PAI for combating cancer, especially regarding their clinical translation, are discussed. We believe that PTT and PAI having noteworthy features would become promising next-generation non-invasive cancer theranostic techniques and improve our ability to combat cancers.


Figures

Figure 1.
Figure 1.
Classification of nano photothermal transduction agents.
Figure 2.
Figure 2.
(a-i) TEM images of Au nanorods synthesized using both CTAB and sodium oleate as ligands in the order of increased aspect ratio from a to i. Scar bars: (a) 200 nm, (b) 50 nm, (c–f) 100 nm, (g–h) 200 nm, and (i) 100 nm. The numbers in the insets represent the average length and width (nm) of each sample measured from TEM images. (j) From left to right are the normalized extinction spectra of Au nanorods corresponding to sample a, c, d, e, f, g, h, and i, respectively. Reproduced from reference 80 with permission from American Chemical Society, copyright 2013. (k) TEM image of Au nanobipyramids. Scar bar: 200 nm. Reproduced from reference 90 with permission from Wiley-VCH, copyright 2015. (l) TEM image of Au nanocages modified with modified by thermal sensitive polymers. Scar bar: 50 nm. Reproduced from reference 102 with permission from Springer Nature, copyright 2009. (m) TEM image of the Pd nanosheets. Scar bar: 100 nm. Inset is a picture of an ethanol dispersion of the Pd nanosheets in a cuvette. (n) The extinction spectra of Pd nanosheets with different edge lengths. Reproduced from reference 103 with permission from Springer Nature, copyright 2011.
Figure 3.
Figure 3.
(a) AFM image of reduced graphene oxide. Scale bar: 50 nm. (b) The absorption spectra of graphene oxide (black) and reduced graphene oxide (red). The inset is the zoom-in absorption spectra in the range between 800 and 820 nm. Reproduced from reference 120 with permission from American Chemical Society, copyright 2011. (c) Schematic illustration of the synthesis of MoS2 nanosheets via solvothermal method and (d-h) TEM images of MoS2 nanosheets with piece diameter of 50.4, 79.2, 103.1, 194.9, and 297.5 nm, respectively. Scale bars: 50 nm. Reproduced from reference 124 with permission from Elsevier Ltd, copyright 2015. (i) TEM image, (j) dark-field TEM image, and (k) Fourier transform patterns of ultrathin Nb2C nanosheets. The inset of k is the original SAED pattern. Scar bars: (i,j) 200 nm and (k) 5 nm. Reproduced from reference 127 with permission from American Chemical Society, copyright 2017
Figure 4:
Figure 4:
(a) Schematic illustration of the synthesis of the PEG-PLD(IR825) nanomicelle-based PTT and confocal images of nanomicelles-treated HeLa cells after staining with Rhod 123 and ER-Tracker Green, respectively. Reproduced from reference 155 with permission from Royal Society of Chemistry, copyright 2018. (b) Illustration of the micelles with mutually synergistic molecularly targeted therapy/PTT for highly potent cancer therapy. Reproduced from reference 156 with permission from Wiley, copyright 2017. (c) Illustration for self-assembly and structural composition of the acid-switchable micelles (PDPC) for multimodal imaging and combinational therapy of drug-resistant tumour. (d) ROS generation and photothermal profile of PDPC micelles vs Ce6 concentration under 655 nm laser irradiation (black curve, pH 7.4) or pH value (red curve, Ce6 concentration 50 μg/mL) Reproduced from reference 173 with permission from American Chemical Society, copyright 2016.
Figure 5:
Figure 5:
(a) Schematic illustration of the enhanced D-A-D structured DPP-TPA NPs as theranostic agents for PAI guided PDT/PTT. (b) Absorption spectra of samples dissolved in toluene with a concentration of 10−5 mol/L. Reproduced from reference 200 with permission from American Chemical Society, copyright 2016. (c) Absorption spectra, (d) photothermal heating and natural cooling cycles, and (e) IR thermal images of 4T1 tumour-bearing mice under 808 nm laser irradiation with a power density of 0.3 W cm−2. (f) Schematic illustration of the degradation of SPNV in the presence of MPO and H2O2. Reproduced from reference 201 with permission from American Chemical Society, copyright 2018. (g) Schematic illustration of the preparation of the TPA-T-TQ ONPs through a nanoprecipitation method and representative TEM image. (h) photoluminescence spectra of TPA-T-TQ in THF solution (black) and the encapsulated ONPs in water (red), (i) antiphotobleaching (five heating-cooling cycles) and (j) antiROS resistant property of ONPs, ICG, and ICG NPs. The power density of the 808 nm laser irradiation is 0.8 W/cm2. Reproduced from reference 203 with permission from American Chemical Society, copyright 2017.
Figure 6.
Figure 6.
(a-c) TEM images of the (a) core and (b) core-shell upconversion NPs and (c) core-shell upconversion NPs with a carbon-layer (csUCNP@C). Scale bars: 50 nm. (d) The schematic illustration of the special set-up to simultaneously characterize the macroscopic temperature rise and microscopic temperature rise of csUCNP@C NPs (e) Standard curve indicating the relationship between temperature and ratio of fluorescence intensities at two wavelengths. (f) Temperature rising curves of macroscopic (hollow triangles) versus microscopic (filled triangles) determined by the special set-up. The samples were irradiated by a laser at an intensity of 0.3 W/cm2 (red) and 0.8 W/cm2 (blue), respectively. (g) Thermal images and fluorescence imaging of cancer cells co-stained by Calcein AM and PI under laser irradiation (0.3 W/cm2) or external heating. (h) Schematic illustration of the PTT of a group of adjacent cancer cells with or without csUCNP@C internalized. (i) Bright field and luminescence imaging of the group of adjacent cancer cells with or without csUCNP@C internalized before and after the laser irradiation. (j) Amplified luminescence imaging of cancer cells after the laser irradiation. Scale bars: 30 µm. Reproduced from reference 31 with licence from Creative Commons, copyright 2016
Figure 7.
Figure 7.
(a) Schematic illustration of the synthesis of Ag2S quantum dots using human serum proteins as templates. (b) TEM image of Ag2S quantum dots with an average diameter of 9.8 nm. Scale bar: 100 nm. (c) Fluorescence spectra and (d) photothermal temperature rising curves of Ag2S quantum dots with diameters of 4.1, 7.9, and 9.8 nm. (e) In vivo NIR-II fluorescence imaging at different times postinjection of Ag2S quantum dots and (f) the calculated fluorescence intensities. (g) Thermal images of the tumours of tumour-bearing mice under PTT at different conditions. Reproduced from reference 131 with permission from American Chemical Society, copyright 2016. (h) Schematic illustration of the chelator free post-labelling method to chemically reduce 64Cu on Au NPs. (i) Representative whole-body coronal PET images of U87MG tumour-bearing mice at 4, 16, 24, and 45 h after intravenous injection of 64Cu Au nanorods with RGD targeting groups. (j) Thermal images and (k) corresponding temperature rising curves of tumours in U87MG tumour-bearing mice during PTT without and with the injection of Au nanorods with RGH targeting groups. Reproduced from reference 209 with permission from American Chemical Society, copyright 2014.
Figure 8.
Figure 8.
(a) Schematic illustration of the synthesis of the metal ion/tannic acid shell outside NP templates for multimodal imaging and PTT. (b) The T1-weighted MRI imaging of tumour before and after injection of polymer NP@ FeIII/tannic acid shell. (c) Thermal imaging of tumours of tumour-bearing mice with the injection of PBS and polymer NP@FeIII/tannic acid shell, respectively. Reproduced from reference 237 with permission from American Chemical Society, copyright 2018. (d) STEM, (e) HAADF-STEM images of the Cu7S4-Au NPs and (f) corresponding elemental mapping of the Cu7S4-Au NPs. (g) 1H- and 19F-MRI imaging of the tumour in vivo before and after the injection of Cu7S4-Au NPs. (h) Temperature rising profile of tumour areas during PTT. (i) Tumour growth curves of PTT after injection of (1) PBS and (2) Cu7S4-Au NPs. Reproduced from reference 241 with permission from American Chemical Society, copyright 2018.
Figure 9.
Figure 9.
(a) Schematic illustration of the synthesis of the plasmonic blackbodies by mixing dopamine and Au precursors. (b) TEM image of the plasmonic blackbodies. Scale bar: 50 nm. (c) Schematic illustration of PTT with 808 nm and 1064 nm lasers on 4T1 tumours covered by 5mm of tissues and picture of the mouse after the PTT. (d) Temperature profiles of tumour regions during PTT irradiated by 808 nm and 1064 nm lasers at their MPE dose and (e) corresponding tumour growth curves. Reproduced from reference 246 with permission from American Chemical Society, copyright 2018.
Figure 10.
Figure 10.
(a) Schematic illustration of transmitted and scattered light upon illumination of a dispersion of NPs. (b) Schematic illustration of the contribution of absorption and scattering spectra to extinction spectrum. Reproduced from reference 252 with permission from American Chemical Society, copyright 2015. (c) Schematic Jablonski diagram representing different energy transfer mechanism.
Figure 11:
Figure 11:
(a) Illustration of photoinduced electron transfer-induced amplified theranostic SPNPs. (b) In vitro quantification of fluorescence. (c) In vivo PTT: Mean tumour temperature as a function of laser irradiation time (at post-injection time of 6 h) and (d) tumour growth curves of different groups of mice (with and without laser irradiation) after systemic administration of saline, SPNP-F0, or SPNP-F20. Error bars were based on standard error of mean (SEM) (*p < 0.05, **p < 0.01, ***p < 0.001, n = 4). Reproduced from reference 266 with permission from American Chemical Society, copyright 2016. (e) Schematic representation for the synthesis of Mn-porphysome nanovesicles and singlet-oxygen generation by porphysomes after 1 min of laser irradiation (671 nm, 100 mW cm−2) as quantified by singlet oxygen sensor green (SOSG) fluorescence (n = 3, *p < 0.05). Reproduced from reference 268 with permission from Wiley, copyright 2014.
Figure 12:
Figure 12:
(a) Molecular structure and self-assembly of a peptide−porphyrin conjugate (TPP-G-FF) into photothermal peptide−porphyrin nanodots (PPP-NDs). (b) UV−vis absorption spectra of PPP-NDs in water (black) and TPPG-FF in ethanol (red) (Inset: TEM image). (c) IR thermal images of intravenous PPP-NDs injected mice under continuous irradiation in vivo. Reproduced from reference 275 with permission from American Chemical Society, copyright 2017.
Figure 13.
Figure 13.
(a) Schematic illustration of the synthesis of SPPVNs with PEG coating that accumulate in tumours by passive targeting. Reproduced from reference 302 with permission from Wiley-VCH, copyright 2018. (b) Schematic illustration of accumulation of PFOB@IR825-HA-CY5.5 NPs in tumours by active targeting. Reproduced from reference 312 with permission from Elsevier Ltd, copyright 2017. (c) Schematic illustration of the synthesis of Dox NPs@ICG@CCC NPs with cancer cell membrane coating. Reproduced from reference 318 with permission from Elsevier Ltd, copyright 2018
Figure 14.
Figure 14.
(a) Schematic illustration of the investigation of shape effects of Au nanorings, Au nanospheres, and Au nanoplates on macrophage uptake and tumour accumulation. (b,c) The macrophage uptake of Au nanorings, Au nanoplates, and Au nanospheres at (b) 37 0C for 8 h and (c) and 4 0C for 1 h without (filled) and with (hollow) preformed protein corona. (d) Representative whole-body coronal PET images of the mice at different time postinjection indicating the biodistribution and tumour accumulation of Au nanorings, Au nanospheres, and Au nanoplates (from top to bottom) and the corresponding time-activity curves of the mean uptake of these nanostructures in (e) hearts, (f) livers, (g) spleens, and (h) tumours. Reproduced from reference 43 with permission from American Chemical Society, copyright 2017.
Figure 15.
Figure 15.
(a) Schematic illustration of the self-assembly of POM clusters into large aggregates in an acidic environment. (b) diagram indicating enhanced absorption at 808 nm of POM clusters solutions in acidic pH and reduction environments and (c) their corresponding temperature upon irradiation by an 808 nm laser (1.5 W/cm−2, 5 min). (d) The biodistribution and tumour accumulation of POM clusters at different time points postinjection. (e) Tumour growth curves of PTT with POM injected and other control groups. Reproduced from reference 284 with permission from American Chemical Society, copyright 2016. (f) Schematic illustration of the MMP-2 induced self-assembly of peptide-stabilized Au NPs into large aggregations. (g) Quantification of the tumour accumulation of Au NPs@Pep1/Pep2, Ctrl 1 and Ctrl 2 at different time points postinjection. Ctrl 1 represents Au NPs stabilized by only MMP-2 responsive Pep 1. Ctrl 2 represents Au NPs stabilized by MMP2-irresponsive Peptide 1 and Peptide 2. (h) Tumour growth curves of PTT with Au NPs@Pep1/Pep2 injected and other control groups. Reproduced with permission from reference 283 with permission from Royal Society of Chemistry, copyright 2017.
Figure 16.
Figure 16.
(a) Schematic illustration of the preparation of PLT-Au nanorods and photothermally induced enhancement of tumour uptake of PLT-Au nanorods for improved PTT. (b) The blood concentration of Au after injection of Au nanorods (black), PLT membrane-cloaked Au nanorods (PLT-M-Au nanorods) (red), and PLT-Au nanorods (blue). (c) The tumour accumulation of PLT-Au nanorods after subsequent doses of injections with or without laser irradiation. (d) Representative thermal images of HNSCC‐bearing Tgfbr1/Pten 2cKO mice before and after each photothermal treatment. From top to bottom were mice injected with Au nanorods, PLT-M-Au nanorods, and PLT-Au nanorods, respectively. Reproduced from reference 296 with permission from Wiley-VCH, copyright 2017. (e) Schematic illustration of the photothermally triggered enhanced digestion activity of PCB-Bro toward collagen to increase the NP accumulation in tumour. (f) Fluorescence intensity of tumour regions at different time postinjection of PCB and PCB-Bro with or without irradiation of tumour regions with NIR lasers. (g) Thermal images of tumour-bearing mice at 6 postinjection of PCB-Bro (first row), PCB (second row), and saline (third row) with the tumour exposed to a NIR laser for 5 min. Reproduced from reference 341 with permission from Wiley-VCH, copyright 2018.
Figure 17.
Figure 17.
(a) Schematic illustration of the micelles containing Pt(IV) prodrug and Cypate (P/C- micelles) for overcoming MDR and a combination of PTT and chemotherapy. (b) The uptake of Pt(IV) prodrug by A549R and A549 cells as the form of free drug or payloads of P/C-micelles. (c) Efflux of Pt(IV) prodrug from A549R and A549 cells after incubation with free Pt(IV) prodrug or Pt(IV) prodrug containing micelles. Reproduced from reference 350 with permission from American Chemical Society, copyright 2015. (d) Schematic illustration of the release of drug from supramolecular micelles triggered by photothermal and GSH. (e) Tumour growth curves in an orthotopic 4T1 tumour model treated with a combination of PTT and chemotherapy and other control therapies. The treatment conditions were: (I) PBS, (II) supramolecular micelles with PTX (PTX, 20 mg/kg), (III) Abraxane (PTX, 20 mg/kg), (IV) supramolecular micelles (PTX, 60 mg/kg), (v) supramolecular micelles + laser, and (VI) supramolecular micelles with PTX (PTX, 60 mg/kg) + laser and (f) The numbers of tumour nodules present on the lung surface from each group. Reproduced from reference 351 with licence from Creative Commons, copyright 2018
Figure 18.
Figure 18.
(a) Schematic illustration of the synthesis of spiky Au NP@dopamine core-shell NPs (SGNP@PDAs) (b) The schematic illustration of how the combination of PTT and a sub-therapeutic dose of Dox triggered anti-tumour immunity for the treatment of primary tumours and tumour metastases and prevention of tumour recurrence. Reproduced from reference 357 with licence from Creative Commons, copyright 2018
Figure 19:
Figure 19:
(a) Schematic illustration of Au nanocage-Ce6 nanostructure for phototherapy followed by a representative SEM image of Au nanocups. Scale bar: 1µm. Reproduced from reference 380 with permission from Wiley, copyright 2017. (b) IRDye800CW-labeled photosensitizer ZnF16Pc loaded PDI nanodroplet (PS-PDI-PAnD) for in vivo multimodal imaging-guided combinational photothermal and oxygen self-enriched PDT and representative TEM image. Scale bar: 200 nm. Reproduced from reference 245 with permission from American Chemical Society, copyright 2018. (c) AIBI@Au nanocage copolymer synthesis and its NIR-responsive free-radical releasing ability. (d) TEM images of Au nanocages. (e) Phototoxicity of Au nanocages (0–50 μg mL−1), AIBI (0–50 μg mL−1), and AIBI@Au nanocage (0–50 μg mL−1) to 4T1 cells under normoxic and hypoxic conditions. Reproduced from reference 382 with permission from Wiley, copyright 2017. (f) Synthesis of thermoresponsive HCP@HPE unimolecular micelles and illustration of the combination of the 2P-FRET and photothermal effect of NIR for PDT. (g) In vivo tumour growth in HeLa-tumour-bearing nude mice after irradiation of 650 nm or 800 nm. Reproduced from reference 383 with permission from American Chemical Society, copyright 2016. (h) Chemical structure of the building block, Pc-4TEG, and Pc-4TEG-B. (i) NanoPcTB morphology changes in water before and after adding avidin and after standing for 24 h, as determined using TEM. The right column illustrates the proposed mechanisms for the morphology changes. Avidin/NanoPcTB mole ratio is 1/1. Reproduced from reference 384 with permission from American Chemical Society, copyright 2017.
Figure 20.
Figure 20.
(a) Schematic illustration of conventional PTT (cPTT) and simulated distribution of laser energy in the tumour area. (b) Schematic illustration of aPTT and simulated distribution of laser energy in surgical bed. (c)Thermal images of tumour-bearing mice during cPTT (2.5 W/cm2) and aPTT (1 W/cm2). (d) Bioluminescent images of different groups of tumour-bearing mice with different treatment, including control group, group treated with surgery only, group treated with cPTT only, and the group treated with a combination of surgery and aPTT (from top to bottom). Reproduced from reference 394 with permission from American Chemical Society, copyright 2018
Figure 21:
Figure 21:
(a) Basic chemical structures of TPAs and illustration of theranostic TNMs through self-assembly. (b) In vivo photoacoustic (MSOT) images of tumours tissue (arrows) at different time points (0, 4, 8, 12, 16, 24, and 36 h) after injection of TNMs via tail vein under 710 nm laser irradiation. Scale bar: 3 mm. The 3D MSOT image and enlarged orthogonal views of tumour at 12 h post-injection based on image reconstruction. Reproduced from reference 34 with permission from American Chemical Society, copyright 2017. (c) Synthesis of the targeted SPNP (SPNP10-RGD). (d) In vivo PAI of the tumour after systemic administration of SPNP10-RGD or SPNP10 (30 µg in 120 µL) for 0, 4 and 24 h, respectively. The representative photoacoustic maximum imaging projection (MIP) images with an axial view for SPNP10-RGD and SPNP10. Reproduced from reference 418 with permission from Elsevier, copyright 2017.
Figure 22:
Figure 22:
(a) Schematic illustration of the synthesis of PDI NP. (b) Representative overlaid coronal PAI and ultrasound images that show size-dependent uptake in popliteal lymph nodes (LNs) and sciatic LNs at different time points postinjection. Reproduced from reference 42 with permission from American Chemical Society, copyright 2017. (c) Systemic delivery and accumulation of Au conjugates to the tumour via their leaky vasculature in vivo. Representative SEM images of cancer cells showing Au NPs accumulation and intracellular clustering f receptor-mediated endocytosis. (d) The acoustic signal of a PNB (illustrative red time response) reports even a single cancer cell in the solid tissue, but not normal cells (illustrative green time response). Reproduced from reference 57 with permission from Springer Nature, copyright 2016.
Figure 23:
Figure 23:
(a) Dynamic light scattering, TEM image (Scale bar: 50 nm) and (b) UV–vis absorption spectra of SON50 at different pH. (c) Photoacoustic and ratiometric images (ΔPAI680/ΔPAI750) of a subcutaneous HeLa tumour in a nude mouse before and 6 h after intravenous administration of SON50. (d) Quantification of the photoacoustic intensity increment at 680 nm and ratiometric photoacoustic signals as a function of time post-injection of SON50. **No statistically significant difference in ratiometric signals between 3 and 6 h (p>0.05). Reproduced from reference 434 with permission from Wiley, copyright 2016. (e) Schematic illustration of the sensing mechanism for the SOA nanoprobe. (f) In vitro PAI in the absence and presence of ClO and (g) Ratiometric photoacoustic responses (PAI780/PAI680) toward different ROS in PBS buffer. (h) In vivo PAI of a subcutaneous 4T1 tumour in a nude mouse before and 2, 4, 6, 8, and 24 h after intravenous administration of the nanoprobe and ratiometric photoacoustic signals as a function of postinjection time. (i) Ratiometric quantitation of photoacoustic signals as a function of postinjection time. Reproduced from reference 441 with permission from American Chemical Society, copyright 2017. The representative PA maximum intensity projection (MIP) images with an axial view are demonstrated in both. The error bars represent the SD of three separate measurements (n=3)
Figure 24:
Figure 24:
(a) In vivo PAI and (b) quantification of protein sulfenic acids using rSPNP2 or SPNP2. The representative photoacoustic maximum intensity projection (MIP) images with an axial view. (c) Illustration of the mechanism and histological analysis of immunofluorescence staining with the antisulfenic acid antibody. (d) Fluorescence microscopy of tumour slices for mice treated with rSPNP2 or SPNP2 at 48 h of postinjection. (red signals from rSPNP2 or SPNP2, green signals from the staining with an antisulfenic acid antibody, and blue from the nucleus staining. Reproduced from reference 447 with permission from American Chemical Society, copyright 2016. (e) In vivo photoacoustic images (770 nm) of the tumour-bearing and control flank before and 5 h following injection of HyP-1. (Scale bar: 2 mm). (f) Time-dependent photoacoustic signal of ischemic limb and control. Results with error bars are represented as mean ± SD. *p < 0.05, **p < 0.01 (n=4). Reproduced from reference 448 with licence from Creative Commons, copyright 2017.
Figure 25:
Figure 25:
(a) Schematic illustration for preparation of SPNP-II. (b) UV−vis-NIR absorption spectra of SPNP-II. (c) In vivo PAI and (d) SNR of rat brain cortex at 70 min postinjection of SPNP-II at 750 (NIR-I) and 1064 nm (NIR-II). *Statistically significant difference (p < 0.05, n = 3). Reproduced from reference 459 with permission from American Chemical Society, copyright 2017.

References

    1. Li Z, Tan S, Li S, Shen Q and Wang K, Oncol. Rep, 2017, 38, 611–624. - PMC - PubMed
    1. Kalbasi A, Komar C, Tooker GM, Liu M, Lee JW, Gladney WL, Ben-Josef E and Beatty GL, Clin. Cancer Res, 2017, 23, 137–148. - PMC - PubMed
    1. Perez-Herrero E and Fernandez-Medarde A, Eur. J. Pharm. Biopharm, 2015, 93, 52–79. - PubMed
    1. Curtin NJ, Nat. Rev. Cancer, 2012, 12, 801–817. - PubMed
    1. Baumann M, Krause M and Hill R, Nat. Rev. Cancer, 2008, 8, 545–554. - PubMed