. 2018 Dec;109(12):3826-3839.
doi: 10.1111/cas.13809. Epub 2018 Nov 8.

Chemokine (C-X-C motif) ligand 1 and CXCL2 produced by tumor promote the generation of monocytic myeloid-derived suppressor cells

Affiliations

Chemokine (C-X-C motif) ligand 1 and CXCL2 produced by tumor promote the generation of monocytic myeloid-derived suppressor cells

Huifang Shi et al. Cancer Sci. 2018 Dec.

Abstract

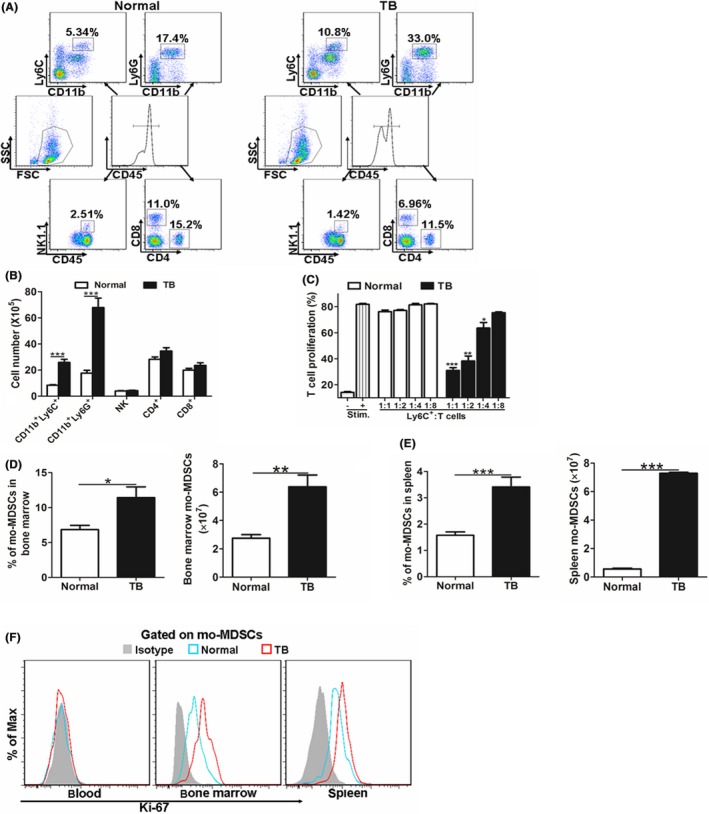
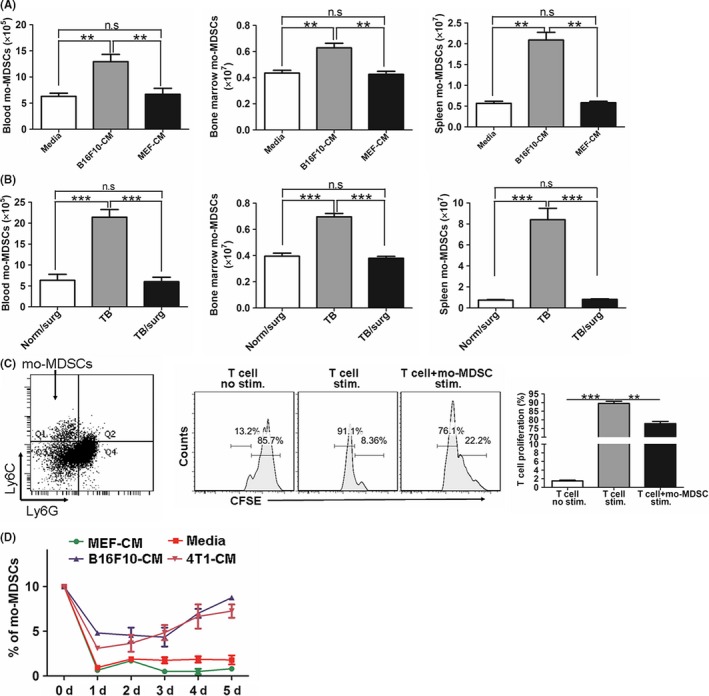
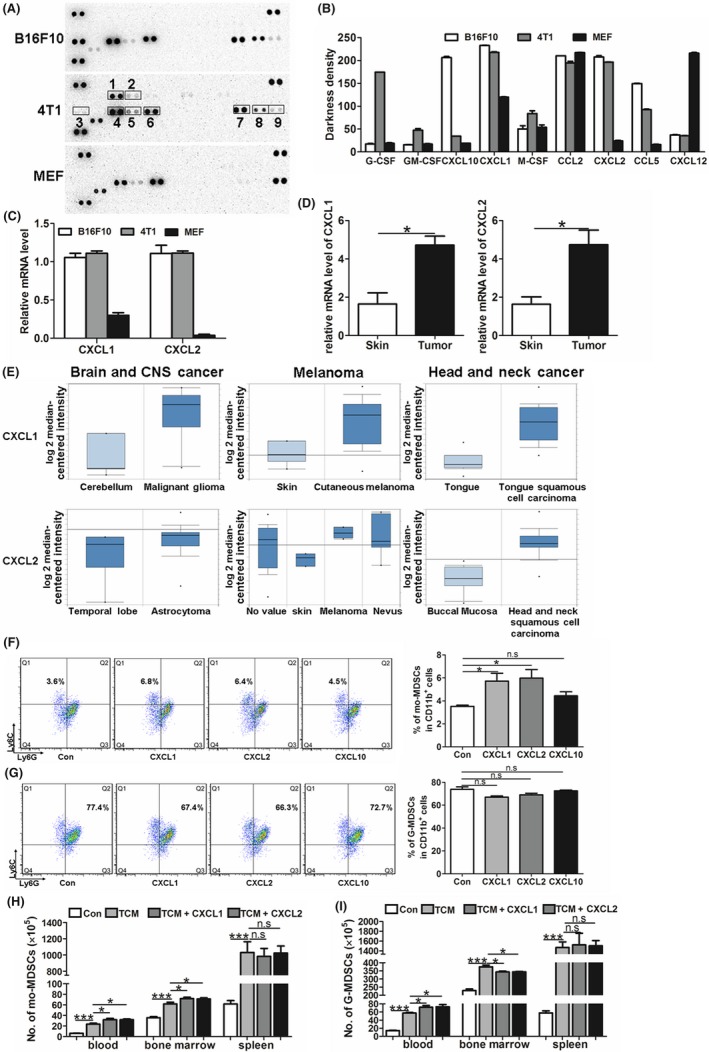
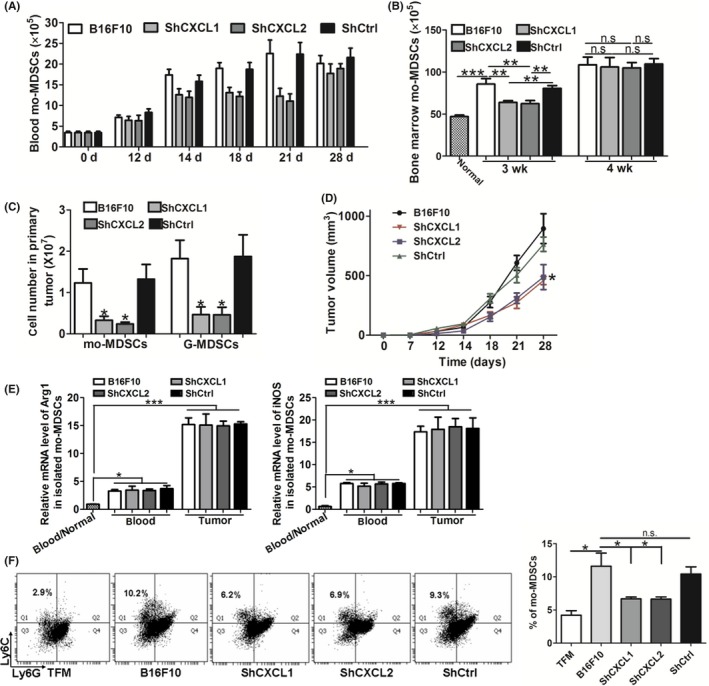
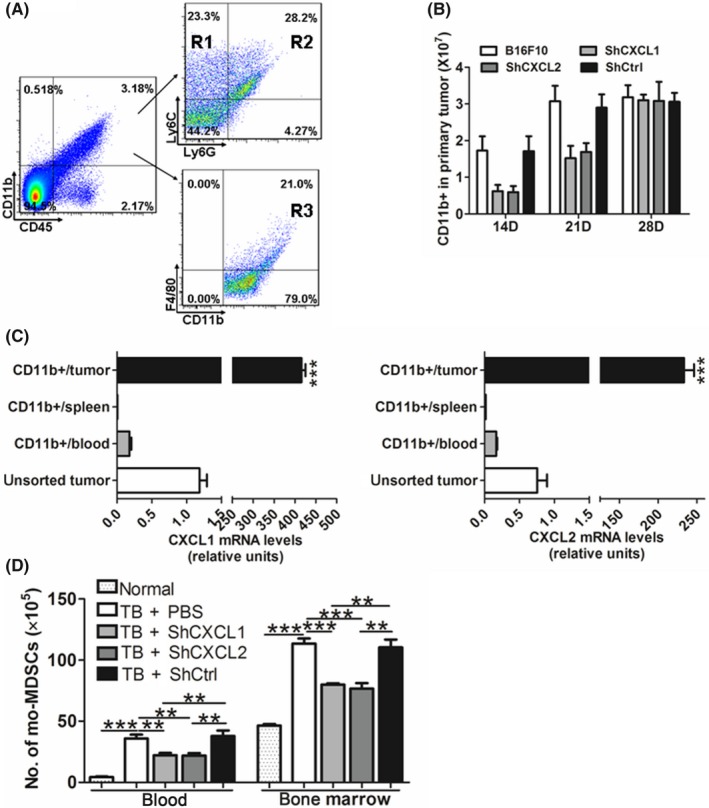
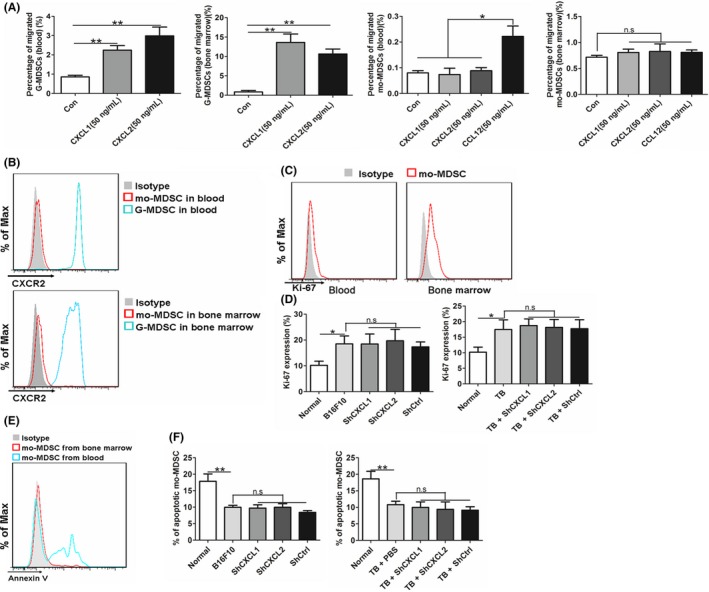
Accumulation of myeloid-derived suppressor cells (MDSC) in tumor-bearing hosts is a hallmark of tumor-associated inflammation, which is thought to be a barrier to immunosurveillance. Multiple factors secreted by tumor cells and tumor stromal cells are reported to be involved in promoting the expansion of MDSC. Herein, we showed that s.c. inoculation of tumor cells and i.v. injection of tumor-conditioned medium increased the number of MDSC. Subsequent investigation elucidated that chemokine (C-X-C motif) ligand 1 (CXCL1) and CXCL2, which were originally characterized as the chemokines of neutrophils, specifically promoted the expansion of monocytic MDSC (mo-MDSC), a subtype of MDSC, in the presence of granulocyte-macrophage colony-stimulating factor. Depletion of CXCL1 or CXCL2 in B16F10 cells or in B16F10-bearing mice noticeably decreased the generation of mo-MDSC in bone marrow. Moreover, we found that, in addition to the tumor cells, tumor-infiltrated CD11b+ myeloid cells also expressed CXCL1 and CXCL2. Furthermore, CXCL1- and CXCL2-induced increase of mo-MDSC was not correlated with chemotaxis, proliferation or apoptosis of mo-MDSC. These findings show a novel role of CXCL1 and CXCL2 in promoting mo-MDSC generation by favoring the differentiation of bone marrow cells in tumor-bearing conditions, which suggests that inhibition of CXCL1 and CXCL2 could decrease mo-MDSC generation and improve host immunosurveillance.

Keywords: CD11b+ myeloid cell; CXCL1; CXCL2; differentiation; mo-MDSC.


Figures

Figure 1
Figure 1
Tumor‐bearing condition drives the accumulation of monocytic myeloid‐derived suppressor cells (mo‐MDSC). A, Mice were s.c. inoculated with or without 3 × 106 B16F10 cells and killed after 3 weeks. Immunomodulatory cells (CD11b+Ly6C+ cells, CD11b+Ly6G+ cells, CD4+T cells, CD8+T cells and natural killer [NK] cells) from the blood of normal mice and tumor‐bearing mice were detected by flow cytometry (TB, tumor‐bearing mice). B, Absolute number of these five cellular compositions in the blood of normal mice and tumor‐bearing mice; n ≥5. C, T cells were prestained with carboxyfluorescein succinimidyl ester (CFSE), and the proliferation of T cells was examined by flow cytometry after coculturing with CD11b+Ly6C+ cells isolated from the blood of normal mice and tumor‐bearing mice in the indicated ratios for 3 days and the percentage of proliferative T cells was quantitatively analyzed (Stim., stimulation with anti‐CD3/CD28 antibodies). D,E, Percentages and numbers of mo‐MDSC in the bone marrow and spleen from normal mice and tumor‐bearing mice were analyzed; n ≥3. F, Expression of Ki‐67 in mo‐MDSC from the blood, bone marrow and spleen of normal mice and tumor‐bearing mice was assessed by flow cytometry. *P < .05; **P < .01; ***P < .0001; n.s means no significance
Figure 2
Figure 2
Tumor cell‐secreted cytokines induce the expansion of monocytic myeloid‐derived suppressor cells (mo‐MDSC). A, Numbers of mo‐MDSC in the blood, bone marrow and spleen were analyzed by flow cytometry after normal mice were i.v. injected with cell‐free media (Media), B16F10‐conditioned media (B16F10‐CM) or mouse embryo fibroblast (MEF)‐conditioned media (MEFCM); n ≥3. B, Numbers of mo‐MDSC in the blood, bone marrow and spleen in normal mice, tumor‐bearing mice and tumor‐removed tumor‐bearing mice were analyzed by flow cytometry (Norm/surg, normal mice with surgery; TB, tumor‐bearing mice; TB/surg, tumor‐bearing mice with tumor‐removing surgery); n ≥3. The primary tumor in the tumor‐bearing mice was surgically removed after s.c. inoculation for 3 weeks, and the number of mo‐MDSC was detected 2 weeks later. C, Mo‐MDSC were generated by culturing bone marrow cells in the presence of 10 ng/mL GMCSF for 5 days in vitro, and the induced mo‐MDSCs were isolated and then cocultured with T cells to examine the proliferation of T cells by flow cytometry; left, differentiated mo‐MDSC from bone marrow in vitro; middle, representative graph showing suppression of T‐cell proliferation; right, quantitative analysis of the percentage of proliferative T cells (stim., stimulation with anti‐CD3/CD28 antibodies). D, Percentages of mo‐MDSC from the bone marrow were analyzed after induction of bone marrow cells using cell‐free media (Media) or conditioned medium from the culture of MEF cells (MEFCM), B16F10 cells (B16F10‐CM) and 4T1 cells (4T1‐CM) for the indicated days. **P < .01; ***P < .0001; n.s means no significance
Figure 3
Figure 3
Tumor cells express chemokine (C‐X‐C motif) ligand 1 (CXCL1) and CXCL2, and CXCL1 and CXCL2 promote the generation of monocytic myeloid‐derived suppressor cells (mo‐MDSC). A, Expression profiles of various cytokines in B16F10‐conditioned media, 4T1‐conditioned media and mouse embryo fibroblast (MEF)‐conditioned media were assessed using a cytokine array (1, granulocyte colony‐stimulating factor [G‐CSF]; 2, granulocyte‐macrophage CSF [GMCSF]; 3, CXCL10; 4, CXCL1; 5, M‐CSF; 6, CCL2; 7, CXCL2; 8, CCL5; 9, CXCL12). B, Quantification of the staining density is shown. C, Expression of CXCL1 and CXCL2 in B16F10 cells, 4T1 cells and MEF cells was analyzed by real‐time PCR. D, mRNA expression of CXCL1 and CXCL2 in the skin of normal mice and the tumor of tumor‐bearing mice. E, Expression levels of CXCL1 and CXCL2 in normal tissue and cancer tissue in brain and central nervous system (CNS) cancer, melanoma and head and neck cancer were collected from the Oncomine database. F,G, Percentages of mo‐MDSC and granulocytic MDSC (G‐MDSC) were analyzed by flow cytometry after CXCL1, CXCL2 or CXCL10 was given to our in vitro mo‐MDSC induction system for 5 days in the presence of GMCSF; right, quantitative analysis. H,I, Mice were i.v. injected with B16F10 tumor cell‐conditioned media (TCM) in the absence or presence of CXCL1 or CXCL2, and the numbers of mo‐MDSC and G‐MDSC in the blood, bone marrow and spleen were analyzed. *P < .05; ***P < .0001; n.s means no significance
Figure 4
Figure 4
Knockdown of chemokine (C‐X‐C motif) ligand 1 (CXCL1) or CXCL2 decreases the differentiation of bone marrow cells into monocytic myeloid‐derived suppressor cells (mo‐MDSC). A,B, Mice were s.c. inoculated with B16F10 cells, CXCL1 ShRNA‐transferred (shCXCL1) B16F10 cells, CXCL2 ShRNA‐transferred (shCXCL2) B16F10 cells and control ShRNA‐transferred (shCtrl) B16F10 cells, and numbers of mo‐MDSC in the (A) blood and (B) bone marrow were analyzed by flow cytometry at the indicated time points; n ≥4. C, Absolute number of tumor‐infiltrated mo‐MDSC and granulocytic MDSC (G‐MDSC) were calculated after the B16F10 cells, shCXCL1 B16F10 cells, shCXCL2 B16F10 cells and shCtrl B16F10 cells were s.c. inoculated into mice for 3 weeks. D, B16F10 cells, shCXCL1 B16F10 cells, shCXCL2 B16F10 cells and shCtrl B16F10 cells were s.c. inoculated into mice, and the size of tumors was measured at indicated time points. Tumor volume (V) was calculated according to the following formula: V = 1/2 × L × W2. E, Immune suppressive function of mo‐MDSC from the blood and tumor was analyzed after the B16F10 cells, shCXCL1 B16F10 cells, shCXCL2 B16F10 cells and shCtrl B16F10 cells were s.c. inoculated into mice for 3 weeks. F, Conditioned medium was collected after CXCL1 or CXCL2 was knocked down in B16F10 cells, and proportion of mo‐MDSC was analyzed by flow cytometry after culturing the bone marrow cells with the collected medium; right, quantitative analysis. *P < .05; **P < .01; ***P < .0001; n.s means no significance
Figure 5
Figure 5
Tumor‐infiltrated CD11b+ myeloid cells were important contributors of chemokine (C‐X‐C motif) ligand 1 (CXCL1) and CXCL2. A, Recruited immune cells, including monocytic myeloid‐derived suppressor cells (mo‐MDSC) (R1), granulocytic MDSC (G‐MDSC) (R2) and macrophages (R3), in the primary tumor were classified by flow cytometry. B, Absolute number of CD11b+ cells in the primary tumor was calculated after s.c. inoculation with B16F10 cells, CXCL1 ShRNA‐transferred (shCXCL1) B16F10 cells, CXCL2 ShRNA‐transferred (shCXCL2) B16F10 cells and control ShRNA‐transferred (shCtrl) B16F10 cells for the indicated times. C, Expression of CXCL1 and CXCL2 in CD11b+ cells isolated from the primary tumor, spleen and blood was tested, and the expression of CXCL1 and CXCL2 in a heterogeneous primary tumor was used as a control. D, Tumor‐bearing mice were i.v. injected with shCXCL1 or shCXCL2 lentivirus, and the numbers of mo‐MDSC in the blood and bone marrow were assessed by flow cytometry; n≥ 4. **P < .01; ***P < .0001
Figure 6
Figure 6
Chemokine (C‐X‐C motif) ligand 1 (CXCL1) or CXCL2 knockdown‐induced decrease in monocytic myeloid‐derived suppressor cells (mo‐MDSC) is not related to their chemotaxis, proliferation or apoptosis. A, Granulocytic MDSC (G‐MDSC) and mo‐MDSC were isolated from the blood and bone marrow of tumor‐bearing mice, and the chemotaxis of G‐MDSC and mo‐MDSC to CXCL1 and CXCL2 was assessed using a transwell assay. Chemotaxis of isolated mo‐MDSC from the blood to CCL12 was used as a positive control. B, Expression of C‐X‐C chemokine receptor type 2 (CXCR2) on G‐MDSC and mo‐MDSC in the blood and bone marrow was analyzed by flow cytometry. C, Expression of Ki‐67 in mo‐MDSC from the blood and bone marrow was assessed by flow cytometry. D, Percentage of Ki‐67‐positive mo‐MDSC from the bone marrow was quantitatively analyzed by flow cytometry after the mice were s.c. inoculated with B16F10 cells, CXCL1 ShRNA‐transferred (shCXCL1) B16F10 cells,CXCL2 ShRNA‐transferred (shCXCL2) B16F10 cells and control ShRNA‐transferred (shCtrl) B16F10 cells (left) or tumor‐bearing mice were i.v. injected with shCXCL1 or shCXCL2 lentivirus (right). E, Annexin V expression of mo‐MDSC from the blood and bone marrow was assessed by flow cytometry; n ≥3. F, Percentage of apoptotic mo‐MDSC from the blood was quantitatively analyzed by flow cytometry after the mice were s.c. inoculated with B16F10 cells, shCXCL1 B16F10 cells, shCXCL2 B16F10 cells and shCtrl B16F10 cells (left) or tumor‐bearing mice were i.v. injected with shCXCL1 or shCXCL2 lentivirus (right). *P < .05; **P < .01; n.s means no significance

Similar articles

Cited by

References

    1. Candido J, Hagemann T. Cancer‐related inflammation. J Clin Immunol. 2013;33:79‐84. - PubMed
    1. Schreiber R, Old L, Smyth M. Cancer immunoediting: integrating immunity's roles in cancer suppression and promotion. Science. 2011;331:1565‐1570. - PubMed
    1. Serafini P, Santo C, Marigo I, et al. Derangement of immune responses by myeloid suppressor cells. Cancer Immunol Immun. 2004;53:64‐72. - PMC - PubMed
    1. Raber P, Thevenot P, Sierra R, et al. Subpopulations of myeloid‐derived suppressor cells impair T cell responses through independent nitric oxide‐related pathways. Int J Cancer. 2014;134:2853‐2864. - PMC - PubMed
    1. Talmadge J, Gabrilovich D. History of myeloid‐derived suppressor cells. Nat Rev Cancer. 2013;13:739‐752. - PMC - PubMed