. 2018 Dec 3;128(12):5517-5530.
doi: 10.1172/JCI122533. Epub 2018 Nov 5.

PLK1 stabilizes a MYC-dependent kinase network in aggressive B cell lymphomas

Affiliations

PLK1 stabilizes a MYC-dependent kinase network in aggressive B cell lymphomas

Yuan Ren et al. J Clin Invest. .

Abstract

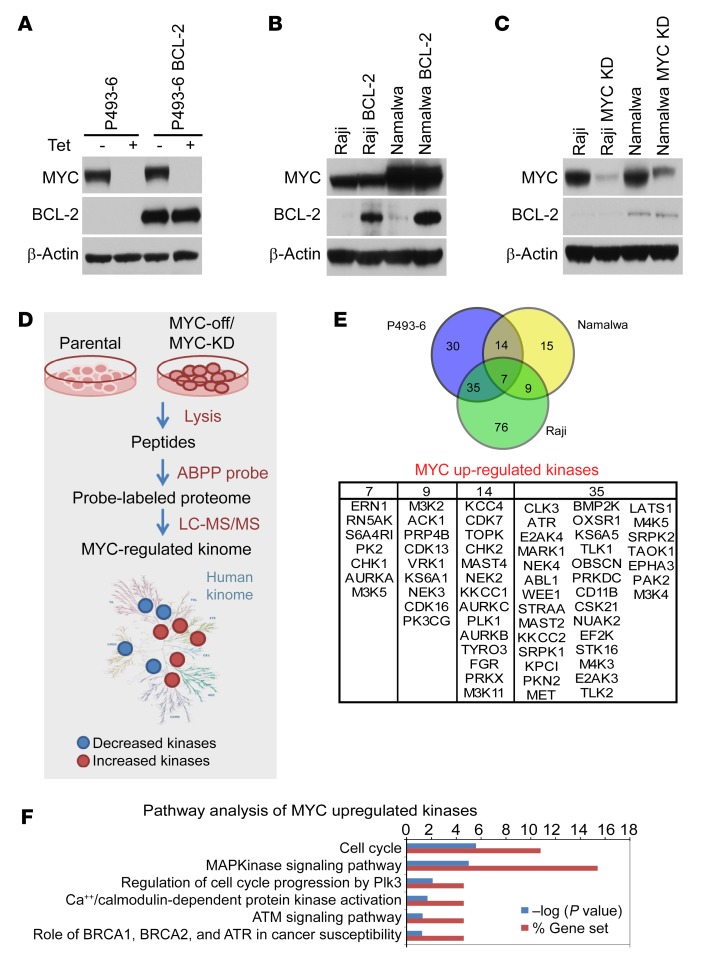
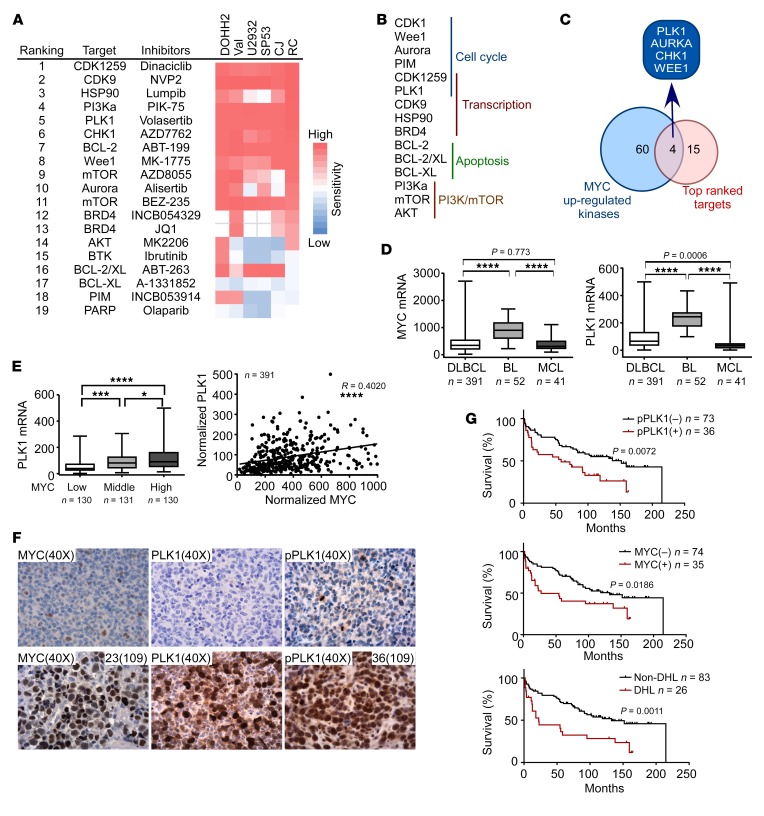
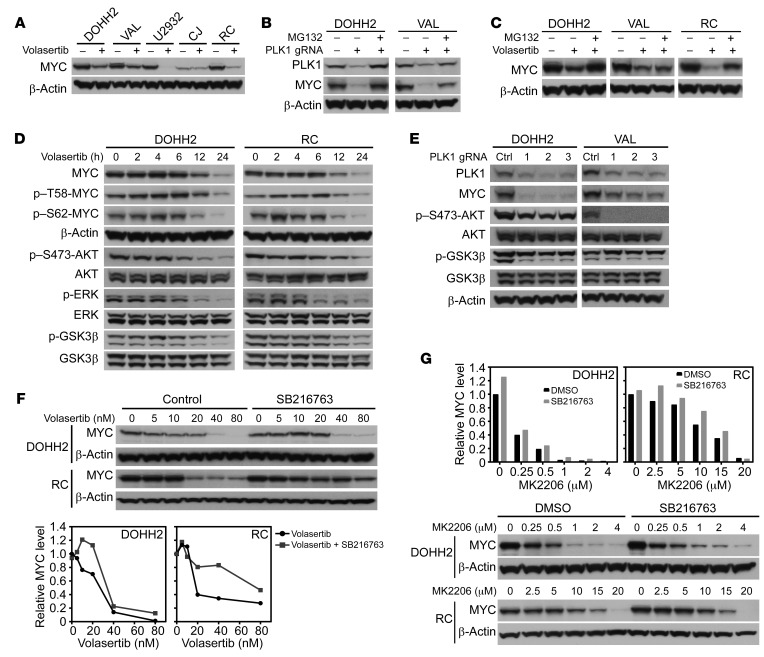
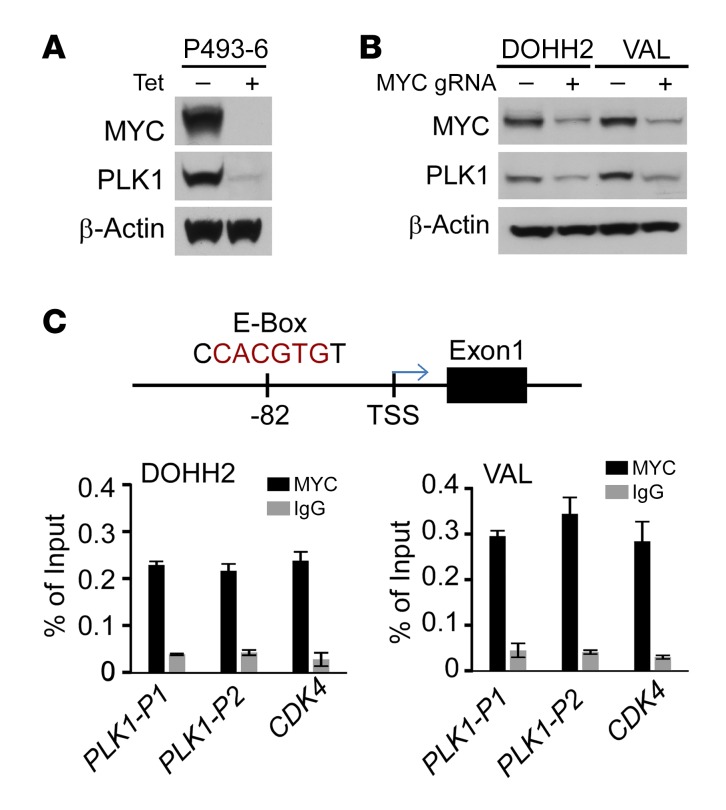
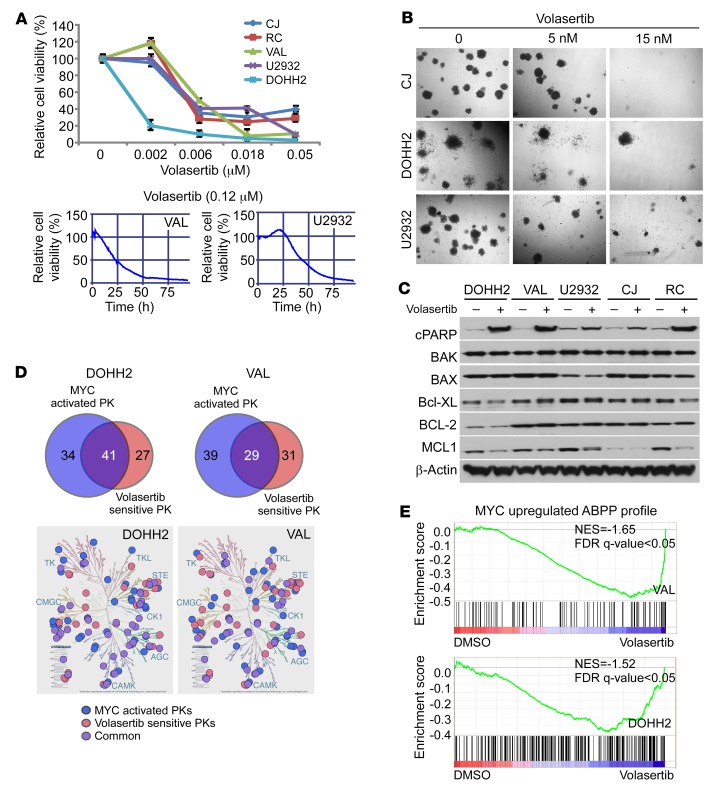
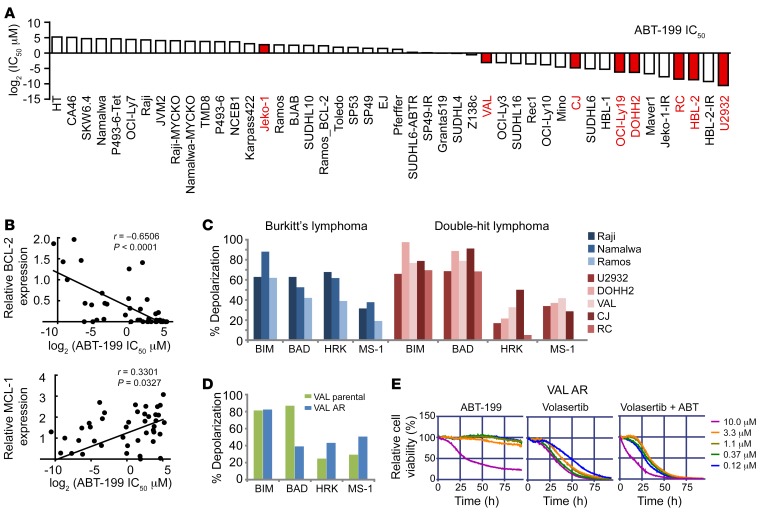
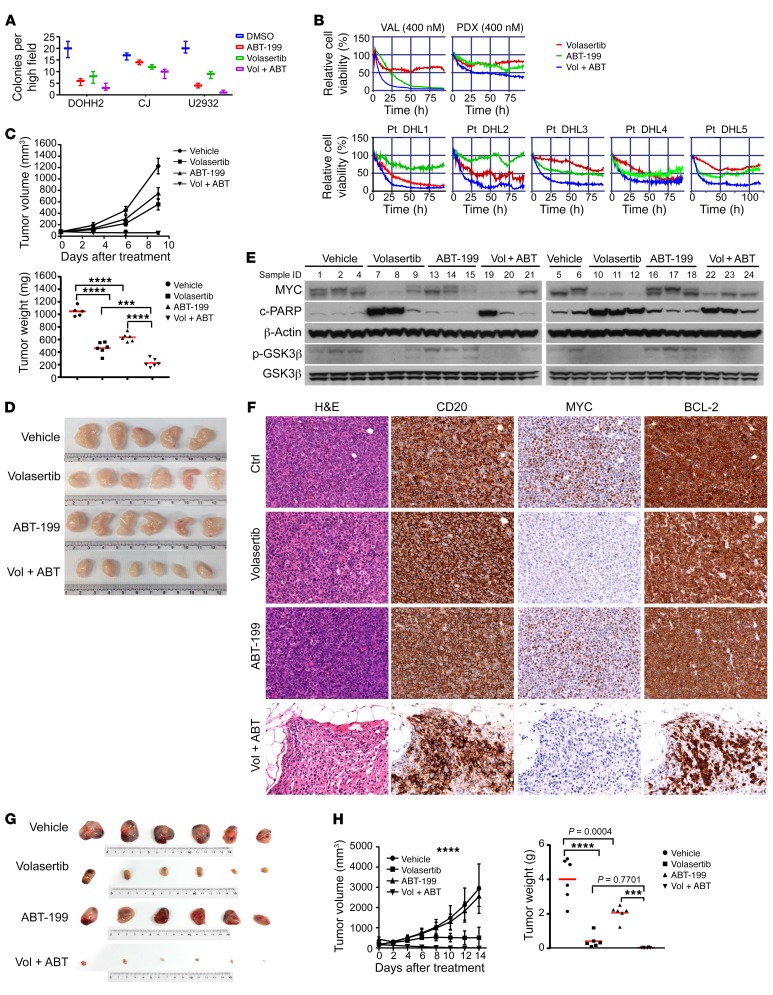
Concordant activation of MYC and BCL-2 oncoproteins in double-hit lymphoma (DHL) results in aggressive disease that is refractory to treatment. By integrating activity-based proteomic profiling and drug screens, polo-like kinase-1 (PLK1) was identified as an essential regulator of the MYC-dependent kinome in DHL. Notably, PLK1 was expressed at high levels in DHL, correlated with MYC expression, and connoted poor outcome. Further, PLK1 signaling augmented MYC protein stability, and in turn, MYC directly induced PLK1 transcription, establishing a feed-forward MYC-PLK1 circuit in DHL. Finally, inhibition of PLK1 triggered degradation of MYC and of the antiapoptotic protein MCL-1, and PLK1 inhibitors showed synergy with BCL-2 antagonists in blocking DHL cell growth, survival, and tumorigenicity, supporting clinical targeting of PLK1 in DHL.

Keywords: Cancer; Hematology; Lymphomas; Molecular biology; Oncology.


Conflict of interest statement

Conflict of interest: The authors have declared that no conflict of interest exists.

Figures

Figure 1
Figure 1. MYC-regulated kinome in lymphoma.
(A) Generation of isogenic BCL-2–expressing (MYC Tet-repressible) P493-6 B lymphoma cells. (B) Generation of isogenic BCL-2–expressing Raji and Namalwa BL cells. (C) Generation of isogenic CRISPR/cas9-mediated MYC KO/KD derivatives of Raji and Namalwa BL cells. (D) Schematic work flow of ABPP studies. (E) Overlap of kinases whose activity is upregulated by MYC in P493-6, Namalwa, and Raji BL cells (upper panel) and list of MYC-upregulated kinases (lower panel). (F) KEGG pathway analysis of MYC-upregulated kinome in models of DHL. See complete unedited blots in the supplemental material.
Figure 2
Figure 2. PLK1 is elevated in DHL, connotes poor survival, and is a therapeutic vulnerability for DHL cells.
(A) Functional drug screens in DHL cells (DOHH2, Val, U2932, SP53, CJ, and RC); summary of top 19 ranked small molecules and corresponding targets, as represented in an IC50 heatmap format. (B) Top ranked small-molecule inhibitors of DHL are categorized according to their target signaling pathways. (C) Overlap of MYC-upregulated kinases by ABPP (see Figure 1E) and top ranked small-molecule inhibitors having activity versus DHL. (D) MYC and PLK1 mRNA levels were analyzed in a gene expression profiling data set of DLBCL, BL, and mantle cell lymphoma (MCL). ****P < 0.0001. (E) Correlation of the mRNA levels of MYC and PLK1 in DLBCL. *P = 0.0406; ***P = 0.0005; ****P < 0.0001. (F) Representative images of MYC, PLK1, and p-PLK1 IHC staining in reactive lymphoma nodes (top panels) versus DHL (bottom panels). Original magnification, ×40. (G) Clinical outcome of 109 cases of DLBCL patients treated with R-CHOP when correlated with p-PLK1 and MYC expression and DHL classification. Comparisons among group means in D and E were performed by 1-way ANOVA, followed by Tukey’s test for multiple-comparison test.
Figure 3
Figure 3. PLK1 sustains MYC protein stability by activating an AKT-GSK3β circuit.
(A) Volasertib treatment (20 nM, 24 hours) reduces steady-state levels of MYC protein in DOHH2, VAL, U2932, CJ, and RC DHL cells. (B) PLK1 KO by CRISPR/cas9 editing provokes marked reductions in MYC protein levels that can be restored by treatment (6 hours) with the proteasome inhibitor MG132 (10 μM). (C) Reductions in MYC protein provoked by volasertib treatment (20 nM, 24 hours) are at least partially blocked by pretreatment (6 hours) with MG132 (10 μM). (D) PLK1 inhibition (volasertib, 20 nM) triggers reductions in MYC and blocks AKT, GSK3β, and ERK1/2 activation in DHL cells. Cells were treated for the indicated intervals and assessed for levels of MYC, p–T58-MYC, p–S62-MYC, β-actin, p–S473-AKT, total AKT, p-ERK1/2, total ERK1/2, p-GSK3β, and total GSK3β. (E) PLK1 KO triggers reductions in MYC and in activation of AKT and GSK3β in DOHH2 and VAL DHL cells. (F and G) GSK3β inhibition with SB216763 (5 μM) (F) or AKT inhibition with MK2206 (G) impairs volasertib-induced reductions of MYC protein in DOHH2 and RC DHL cells. (AG). Data shown are representative of at least 3 independent experiments. See complete unedited blots in the supplemental material.
Figure 4
Figure 4. MYC activates PLK1 transcription in DHL.
(A) PLK1 protein levels are dependent on MYC. P493-6 cells were cultured with Tet for 72 hours, and a portion were then deprived of Tet for 24 hours. Levels of MYC, PLK1, and β-actin were determined by Western blot. (B) MYC KD by CRISPR/cas9 gene editing provokes reductions in PLK1 protein in DHL DOHH2 and VAL cells. (C) Upper panel: an E-box site that conforms to the preferred binding site for MYC (CACGTG, PLK1-P1) is located approximately 80 base pairs upstream of the PLK1 transcription start site (TSS). Lower panel: ChIP assays revealed MYC binds to this region of the PLK1 promoter in DHL cells. Binding of MYC to the CDK4 promoter was assessed as a positive control. A and B are representative of 3 independent experiments. Data presented in C show the mean ± SD of at least 3 independent experiments. See complete unedited blots in the supplemental material.
Figure 5
Figure 5. PLK1 function is required for the maintenance of DHL.
(A) Volasertib treatment compromises DHL cell survival. Dose response and time course of volasertib treatment on cell viability of DHL and BL cells, as indicated by percentage of cell viability, as determined by cell titer blue assays (upper panel) and imaging-based drug screening assay (lower panels). (B) Volasertib treatment inhibits the clonogenic capacity of DHL cells seeded in methylcellulose. Original magnification, ×40. (C) Volasertib treatment (20 nM for 24 hours) provokes the cleavage of PARP and suppresses MCL-1 protein levels in DHL cells. Western blot analysis of the indicated cells was performed to assess the effects of PLK1 inhibition on the expression of BCL-2 family members. (D) Overlap of MYC-upregulated kinases and PLK1-dependent kinases in DOHH2 and VAL DHL cells. MYC-activated protein kinases (PK) were determined by ABPP after CRISPR/cas9-mediated MYC KO/KD in DHL lines DOHH2 and VAL cells (versus parental cells) and PLK1-senstive protein kinases were determined after 2 hours of volasertib treatment (20 nM) in DOHH2 and VAL cells. log2 fold change of more than 1 indicates increased kinase ATP probe binding with relative increased activity, and log2 fold change of –1 or less indicates decreased ATP probe binding with decreased activity relative to parental cells. Data presented are the average of 3 biological replicates performed in duplicate. Kinome tree illustration reproduced courtesy of Cell Signaling Technology (www.cellsignal.com). (E) GSEA of the MYC-activated ABPP profile (upper panel) and of the ABPP profile changes provoked by PLK1 inhibition (lower panel) establish that volasertib treatment represses MYC-activated kinases (from DOHH2 and VAL MYC-KO ABPP profile). Normalized enrichment score (NES) = –1.65 (VAL); NES = –1.52 (DOHH2). Data shown in B and C are representative of at least 3 independent experiments. See complete unedited blots in the supplemental material.
Figure 6
Figure 6. BH3 profiling and sensitivity of DHL and ABT-199–resistant DHL to PLK1 inhibition.
(A) IC50 of the indicated B lymphoma cell lines to ABT-199. DHL/DEL cell lines are highlighted in red. (B) Correlation of BCL-2 and MCL-1 protein levels and ABT-199 IC50. IC50 values were determined using MTT assays, and protein levels were determined by Western blot. (C) BH3 profiling of DHL (red, MYChi/BCL-2hi) and BL (blue, MYChi/BCL-2lo) cell lines showing the dependency of most lines to BCL-2 priming. Increased sensitivity (mitochondrial membrane depolarization) to (BAD-HRK) peptides is indicative of BCL-2 dependency; thus, DHL cells are sensitive to ABT-199. (D) BH3 profiling of ABT-199–resistant DHL cells (VAL_AR) reveals a shift to dependency on MCL-1. (E) Viability of VAL_AR cells treated with ABT-199 (left), volasertib (middle), or both volasertib and ABT-199 (right).
Figure 7
Figure 7. Dual PLK1/BCL-2 inhibition is a therapeutic strategy for DHL.
(A) Combination treatment of volasertib (2 nM) with ABT-199 (DOHH2, U2932, 15 nM; CJ, 40 nM) augments clonogenic suppression of DHL cells. (B) Combination treatment of volasertib plus ABT-199 (400 nM in VAL and PDX; 3.3 μM in patient [Pt] DHL specimens Pt-DHL1, Pt-DHL2, and Pt-DHL3) compromises survival of DHL cell lines (VAL cells shown), DHL PDX, and primary DHL patient specimens (n = 3) on a platform that recapitulates the lymphoma microenvironment. (C) Combination treatment of volasertib with ABT-199 has superior anti-DHL activity in VAL xenograft tumors. Left, tumor volume; right, tumor weight. ***P = 0.0002; ****P < 0.0001. (D) Representative images of the tumors from the therapeutic study shown in C. (E) Levels of MYC, p-GSK3β, total GSK3β, and cleaved PARP in tumors from the therapeutic study shown in C. (F) IHC analyses of MYC, CD20, and BCL-2 protein expression in DHL PDX, and effects of volasertib or/and ABT-199 treatment on their expression in this DHL PDX. Original magnification, ×40. (G, H) Combination treatment of volasertib with ABT-199 provokes regression of DHL PDX tumors. (G) Representative images of tumors from the 4 cohorts of treated NSG recipient mice bearing DHL PDX tumors. (H) Tumor volume (left) and tumor weight (right) in the 4 cohorts of mice bearing DHL PDX. ***P = 0.0003; ****P < 0.0001. Results are shown as mean ± SD of 6 animals/group for C and F. Data shown in A and E represent mean ± SD or are representative of at least 3 independent experiments, respectively. Comparisons among group means in C and F were performed by 1-way ANOVA, followed by Tukey’s multiple-comparison test. See complete unedited blots in the supplemental material.

Comment in

Similar articles

Cited by

References

    1. Nilsson JA, Cleveland JL. Myc pathways provoking cell suicide and cancer. Oncogene. 2003;22(56):9007–9021. doi: 10.1038/sj.onc.1207261. - DOI - PubMed
    1. Posternak V, Cole MD. Strategically targeting MYC in cancer. F1000Res. 2016;5:408. - PMC - PubMed
    1. Dave SS, et al. Molecular diagnosis of Burkitt’s lymphoma. N Engl J Med. 2006;354(23):2431–2442. doi: 10.1056/NEJMoa055759. - DOI - PubMed
    1. Slack GW, Gascoyne RD. MYC and aggressive B-cell lymphomas. Adv Anat Pathol. 2011;18(3):219–228. doi: 10.1097/PAP.0b013e3182169948. - DOI - PubMed
    1. Aukema SM, et al. Double-hit B-cell lymphomas. Blood. 2011;117(8):2319–2331. doi: 10.1182/blood-2010-09-297879. - DOI - PubMed

Publication types

MeSH terms

Substances