

doi: 10.1093/ons/opy261.
A Connectomic Atlas of the Human Cerebrum-Chapter 7: The Lateral Parietal Lobe
Affiliations
- PMID: 30260428
- PMCID: PMC6887702
- DOI: 10.1093/ons/opy261
Item in Clipboard
A Connectomic Atlas of the Human Cerebrum-Chapter 7: The Lateral Parietal Lobe
Oper Neurosurg.
.
Abstract
In this supplement, we build on work previously published under the Human Connectome Project. Specifically, we seek to show a comprehensive anatomic atlas of the human cerebrum demonstrating all 180 distinct regions comprising the cerebral cortex. The location, functional connectivity, and structural connectivity of these regions are outlined, and where possible a discussion is included of the functional significance of these areas. In part 7, we specifically address regions relevant to the lateral parietal lobe.
Figures
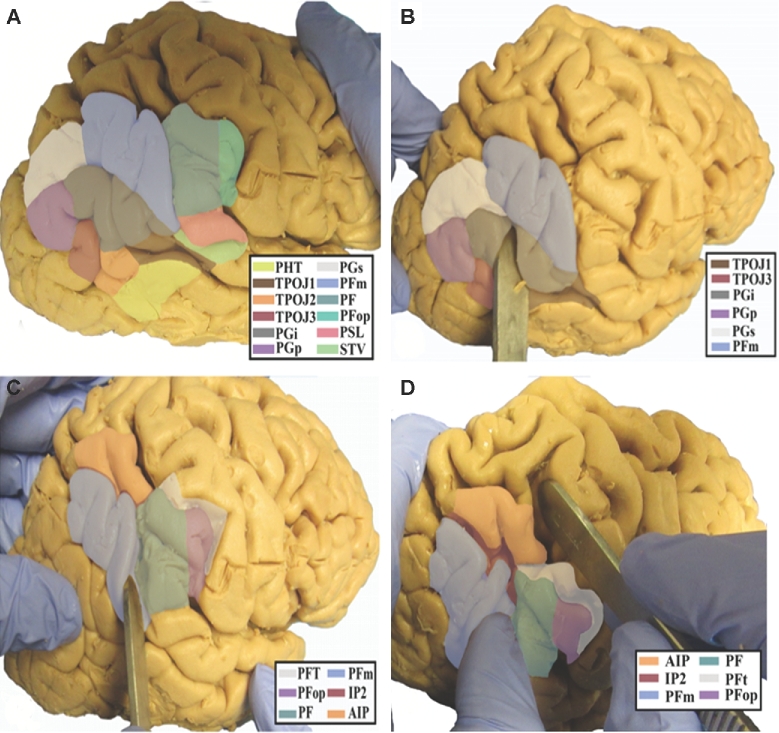
Anatomic view of the inferior parietal lobule and TPOJ. Parcellations are shown on the right hemisphere of a cadaver brain. A, Lateral view of the inferior parietal lobule. B, Lateral view of the inferior parietal lobule with widening of the superior temporal sulcus at the junction of the angular gyrus. C, Lateral view of the inferior parietal lobule with widening of the postcentral sulcus to show the extent of PFm and PF. D, Lateral view of the inferior parietal lobule with widening of the intraparietal sulcus.
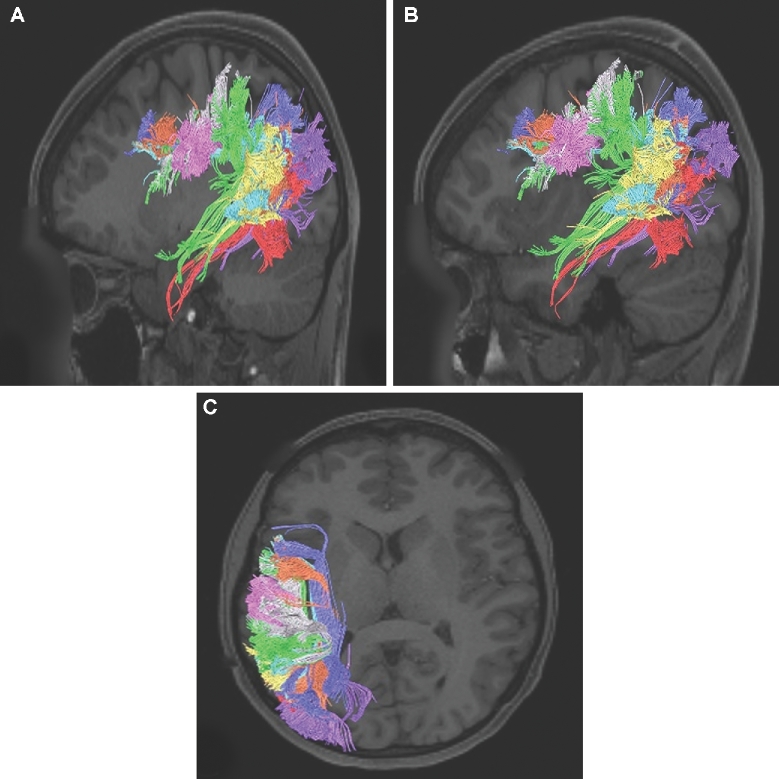
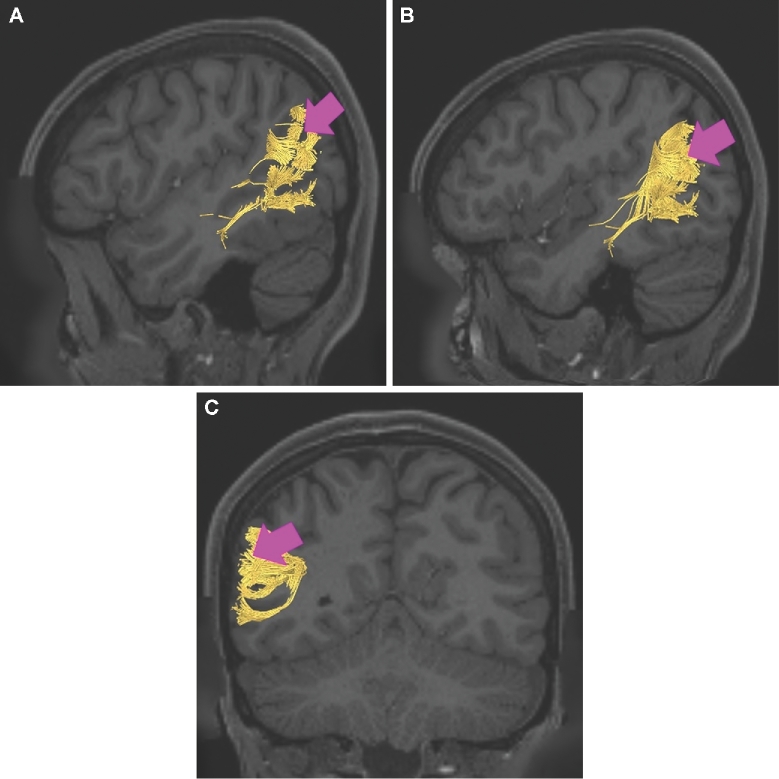
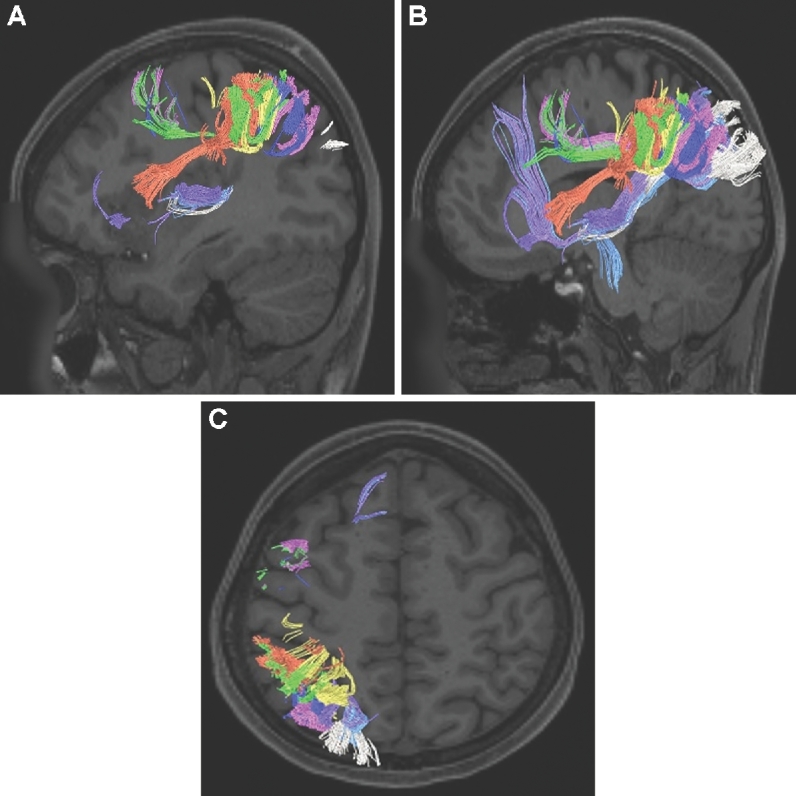
Combined structural connectivity of the parcellations comprising the inferior parietal lobule and the TPOJ, shown on T1-weighted magnetic resonance (MR) images. A and B, Sagittal views and C, axial view.
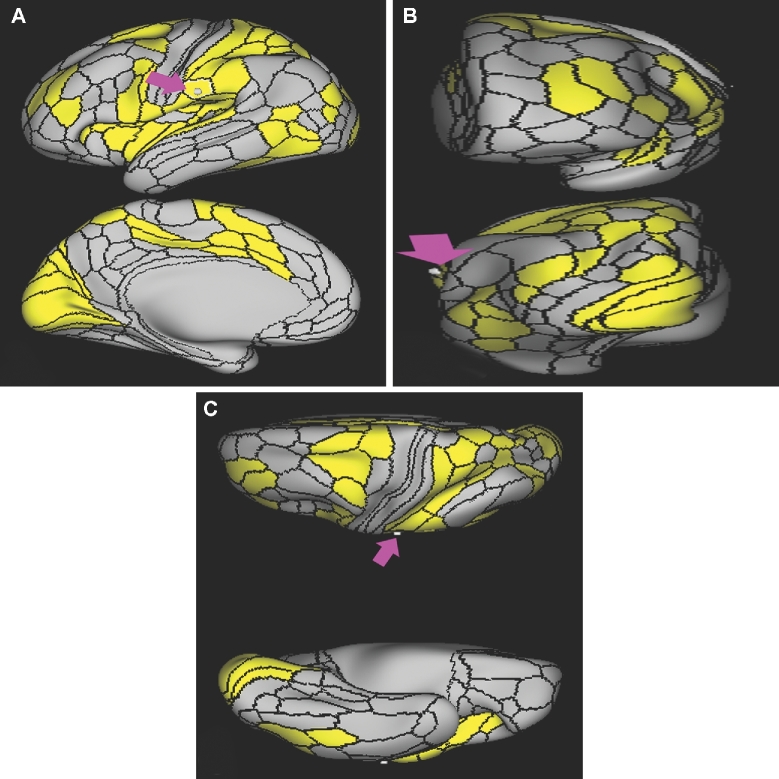
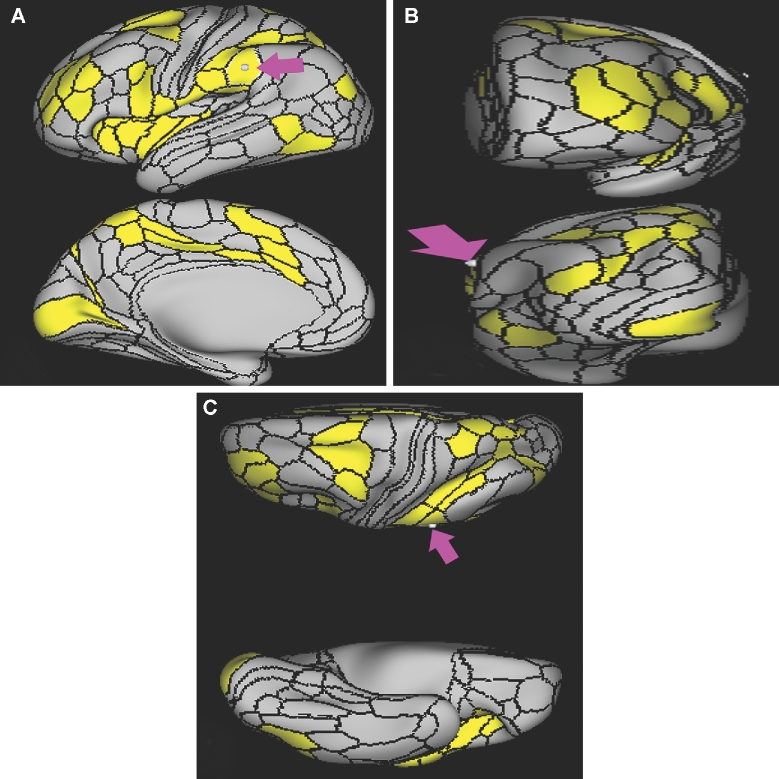
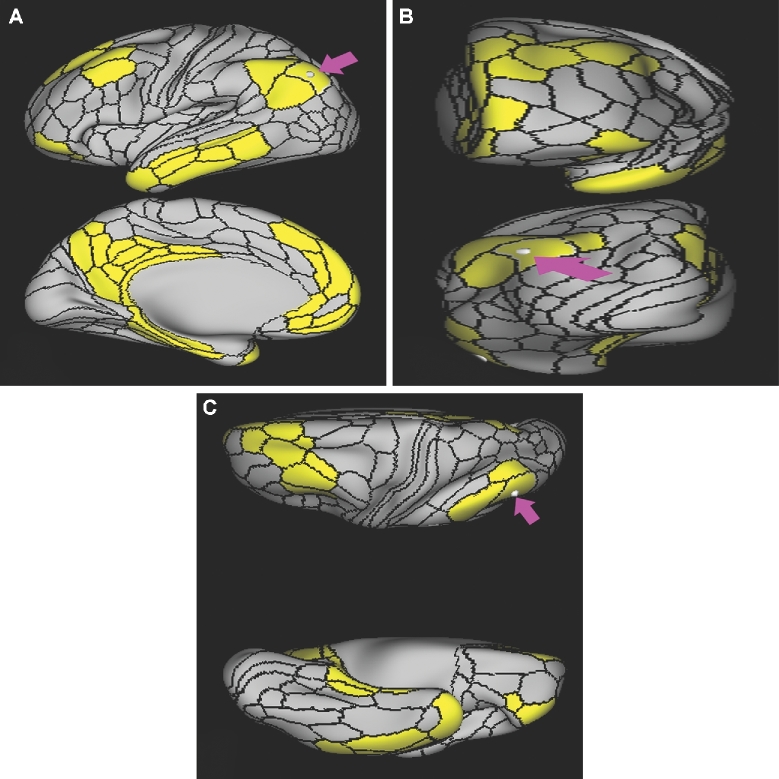
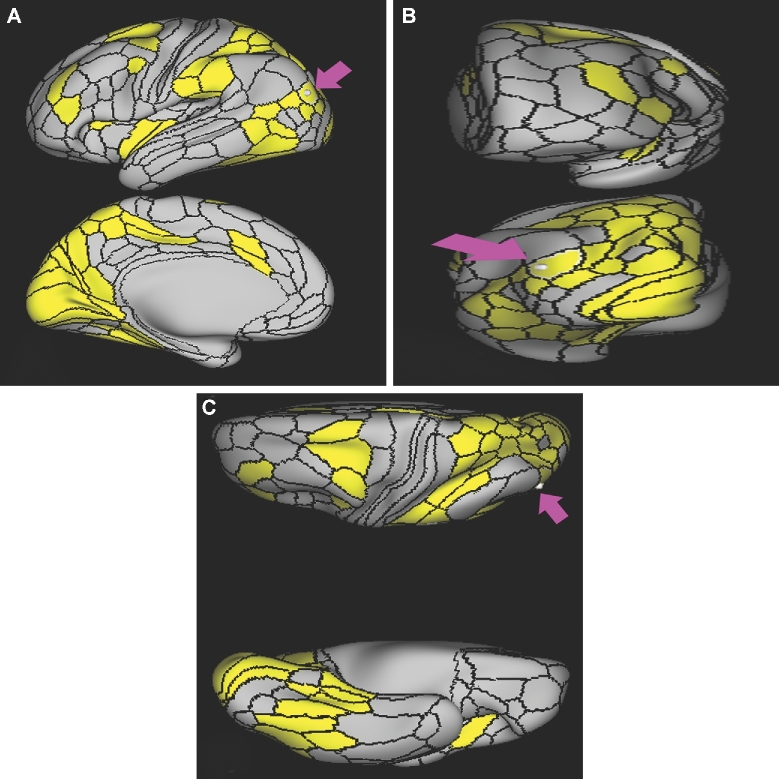
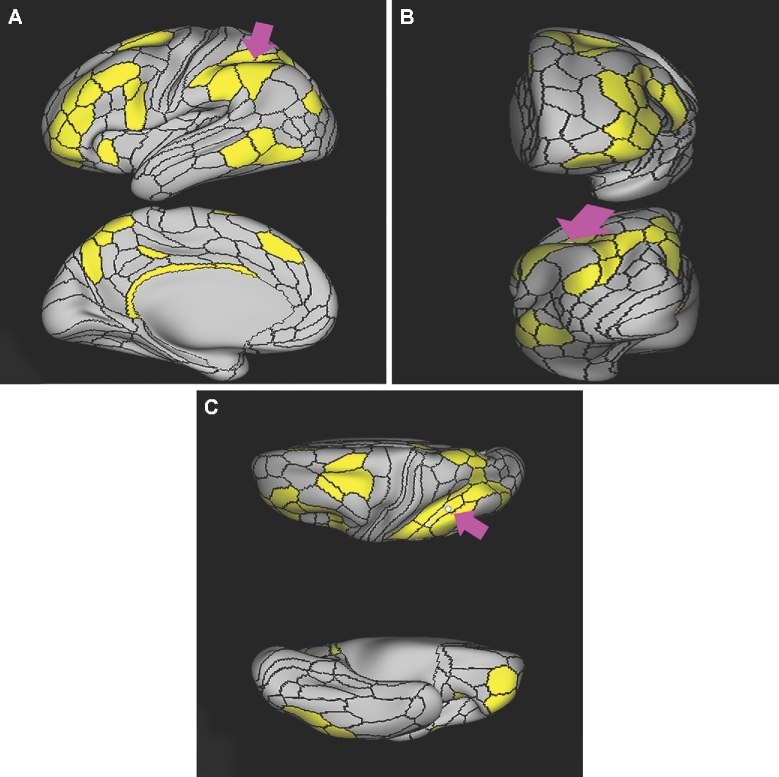
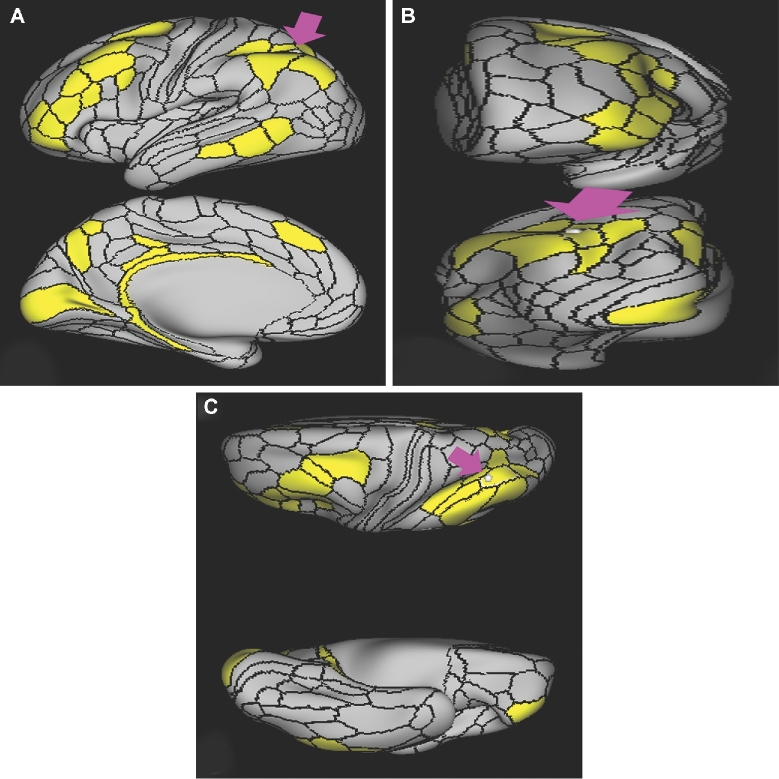
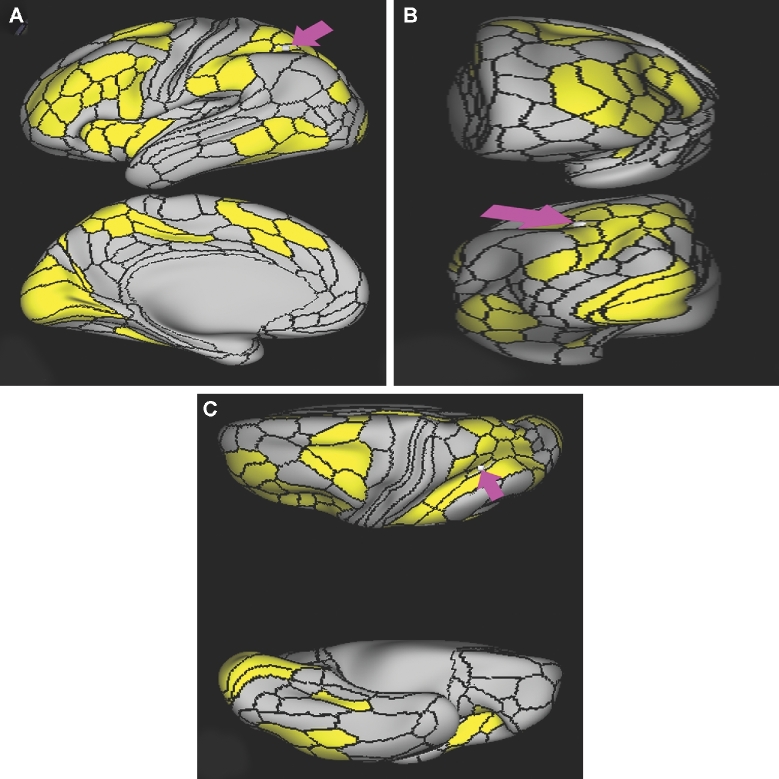
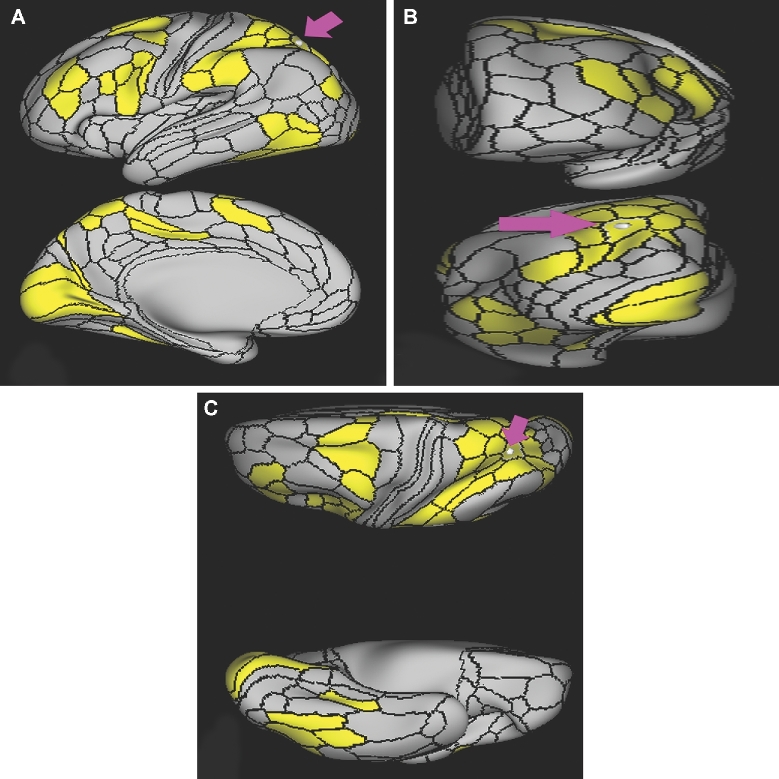
Functional connectivity of PFop demonstrated on an inflated left hemisphere. A, Lateral and medial views. B, Rostral and caudal views. C, Dorsal and ventral views. Parcellations with the strongest functional connectivity are shown in yellow. Pink arrows designate the parcellation of interest.
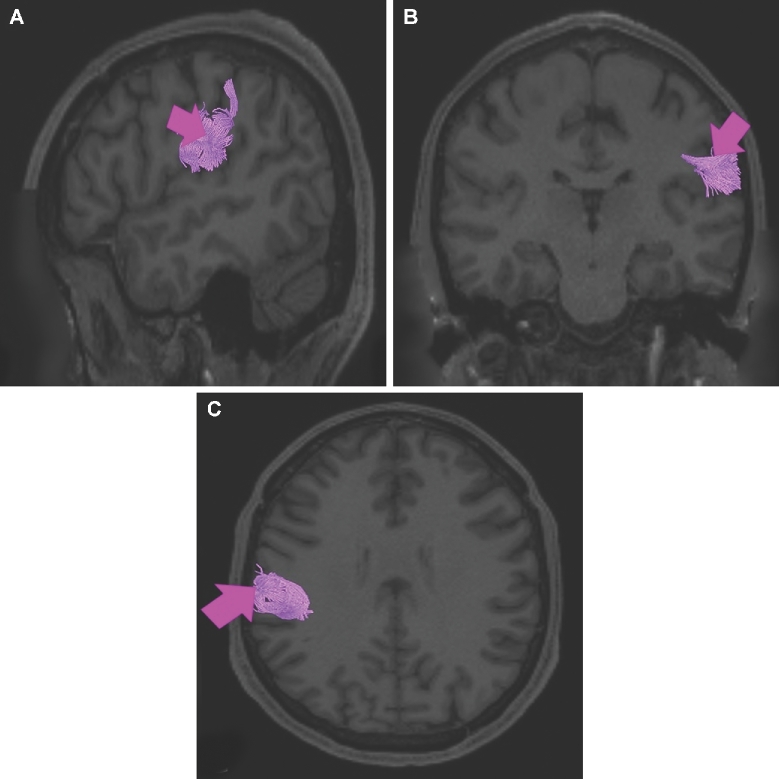
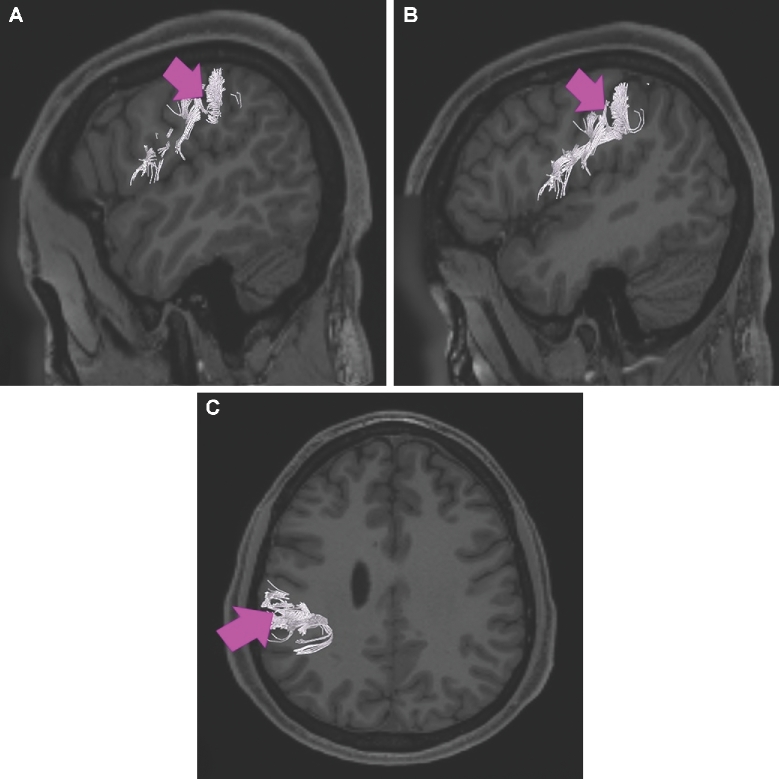
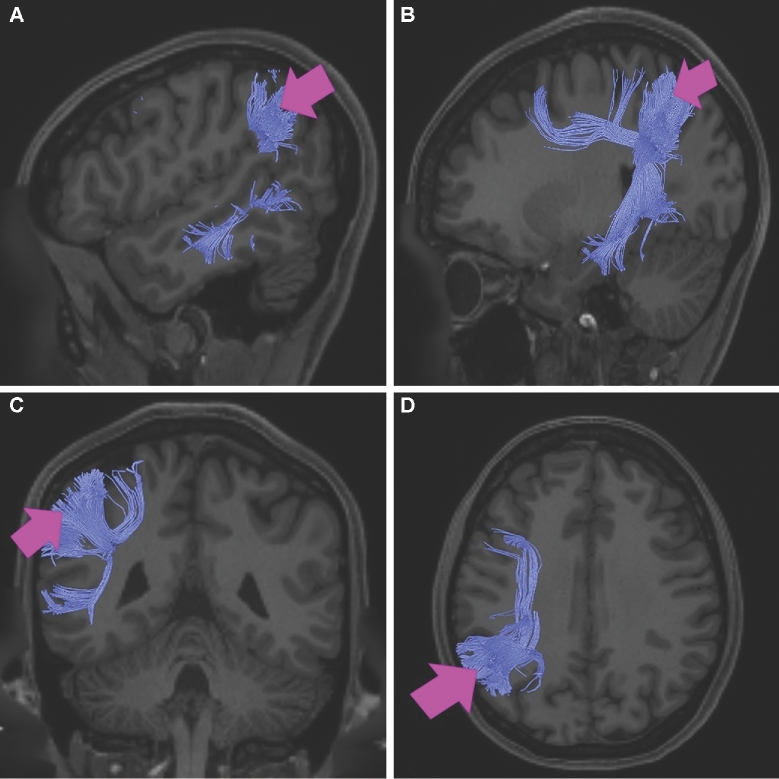
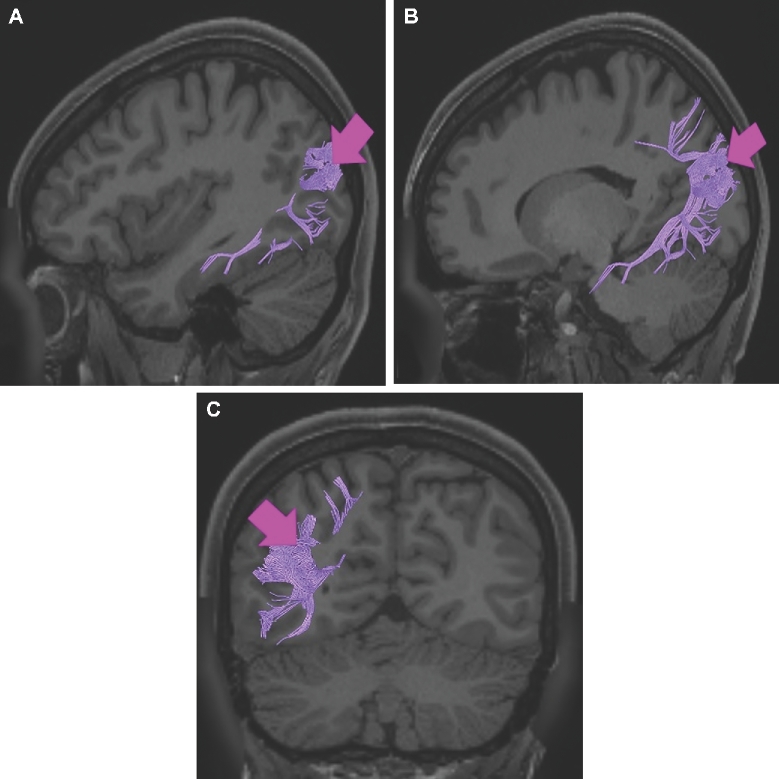
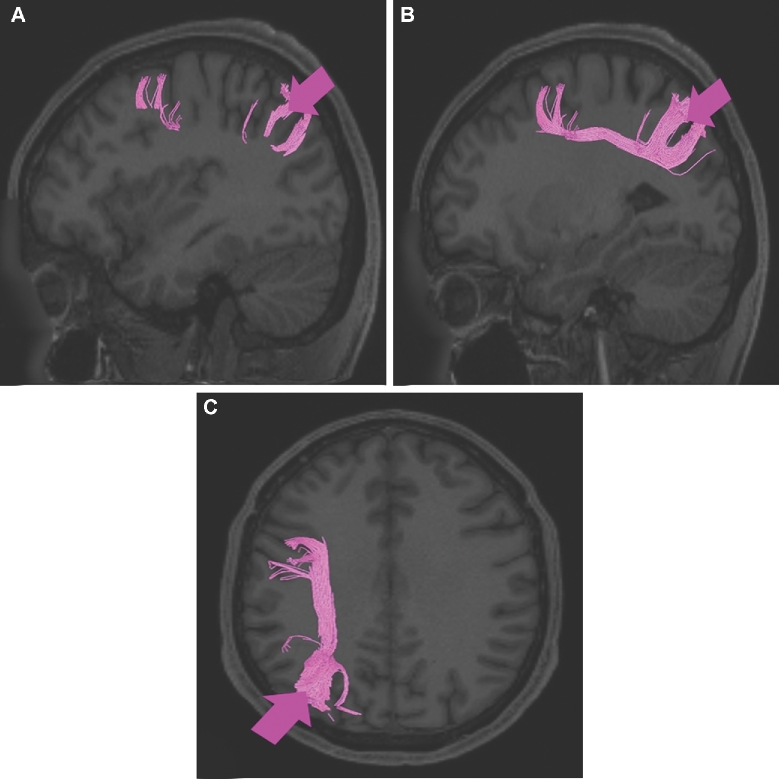
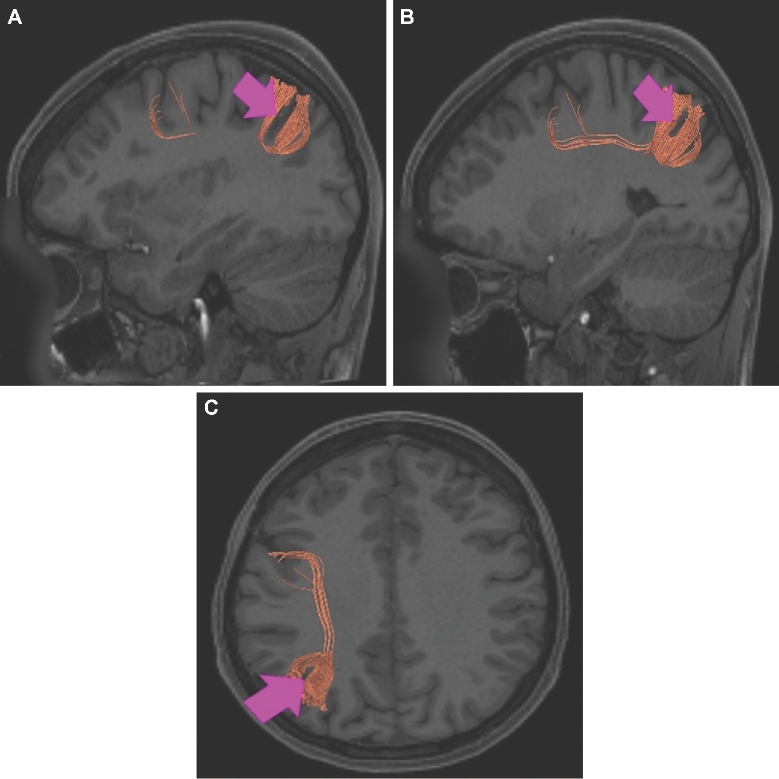
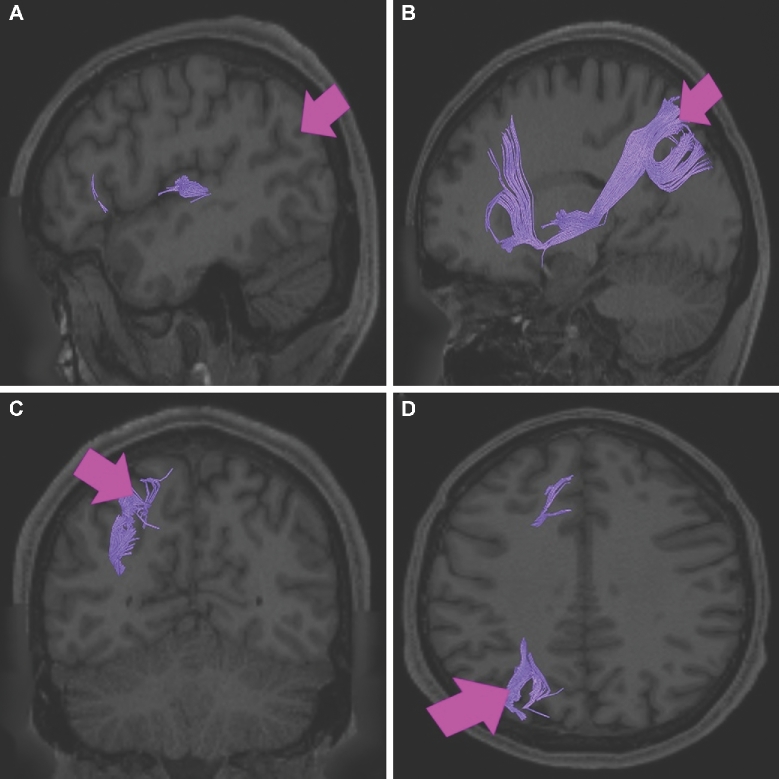
Structural connectivity of PFop in the left hemisphere, shown on T1-weighted MR images. A, Sagittal view, B, coronal view, and C, axial view showing projections to local parcellations. Light purple: white matter tracts of PFop demonstrating connections with local parcellations. Pink arrows indicate the location of the parcellation of interest.

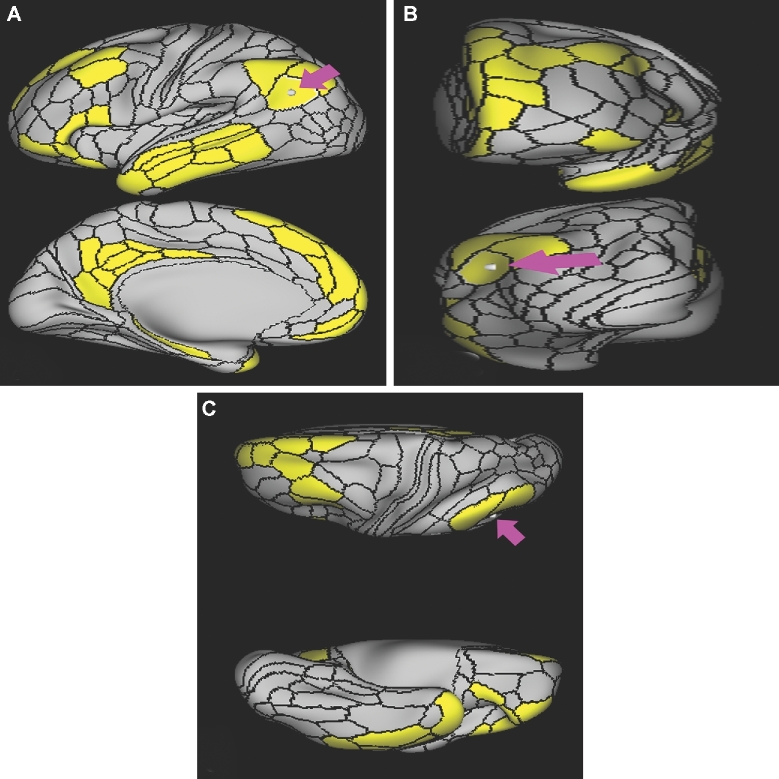
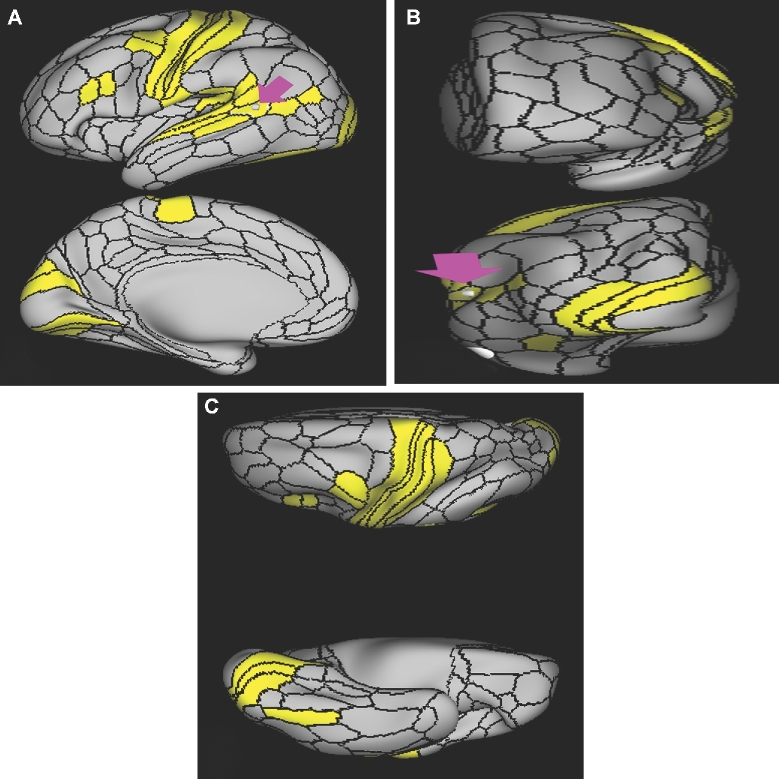
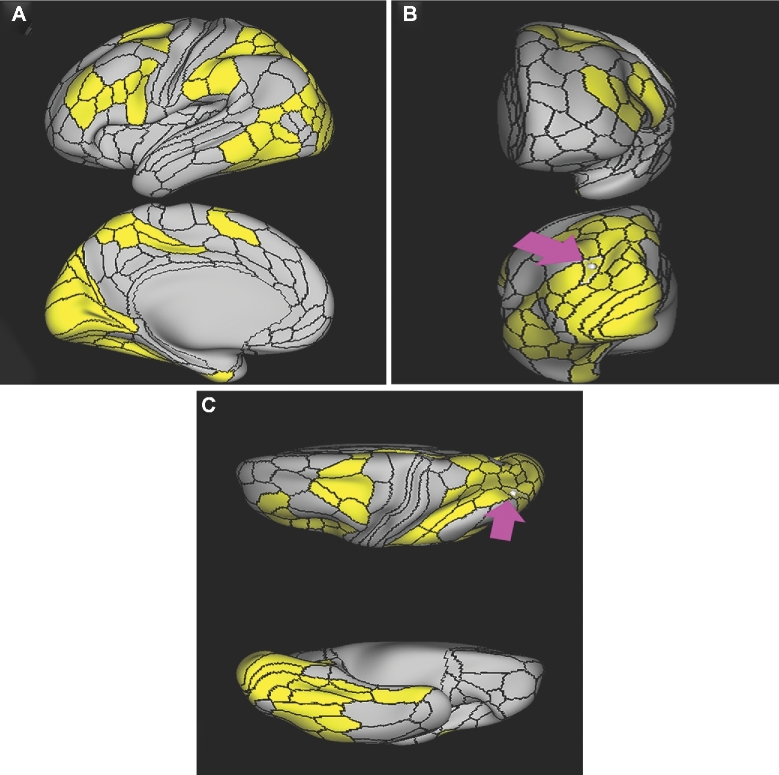
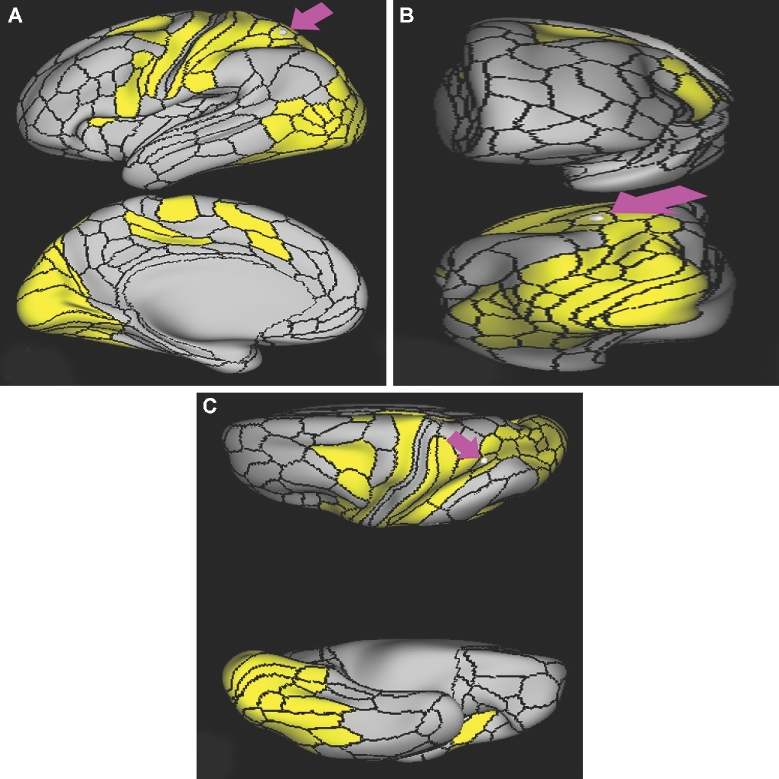
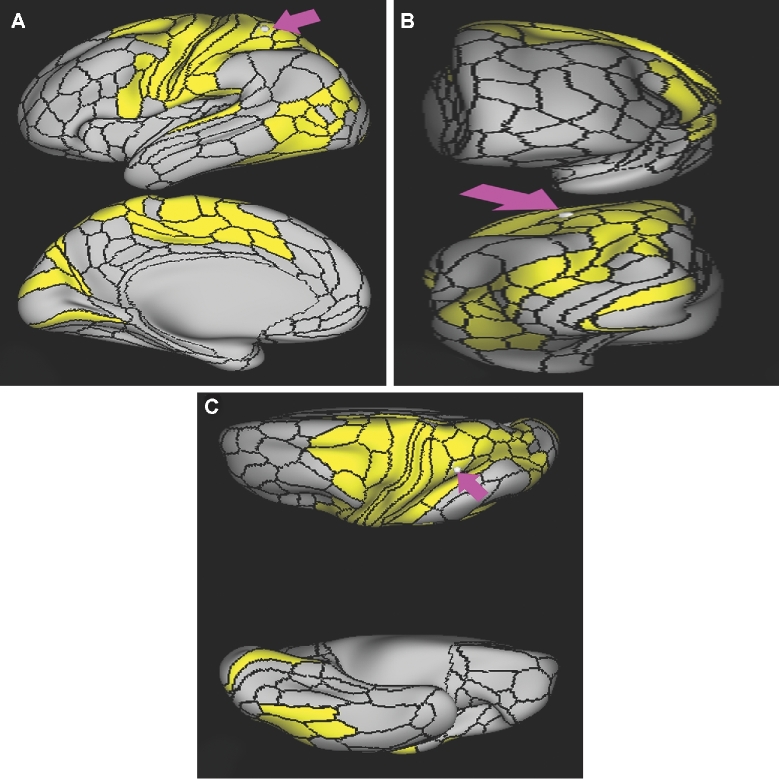
Functional connectivity of PFt demonstrated on an inflated left hemisphere. A, Lateral and medial views. B, Rostral and caudal views. C, Dorsal and ventral views. Parcellations with the strongest functional connectivity are shown in yellow. Pink arrows designate the parcellation of interest.
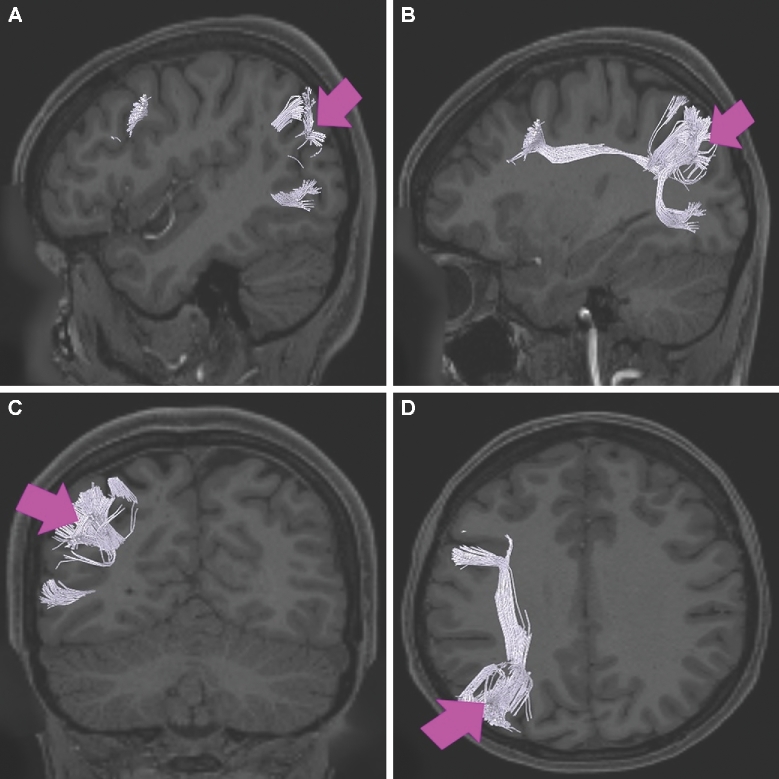
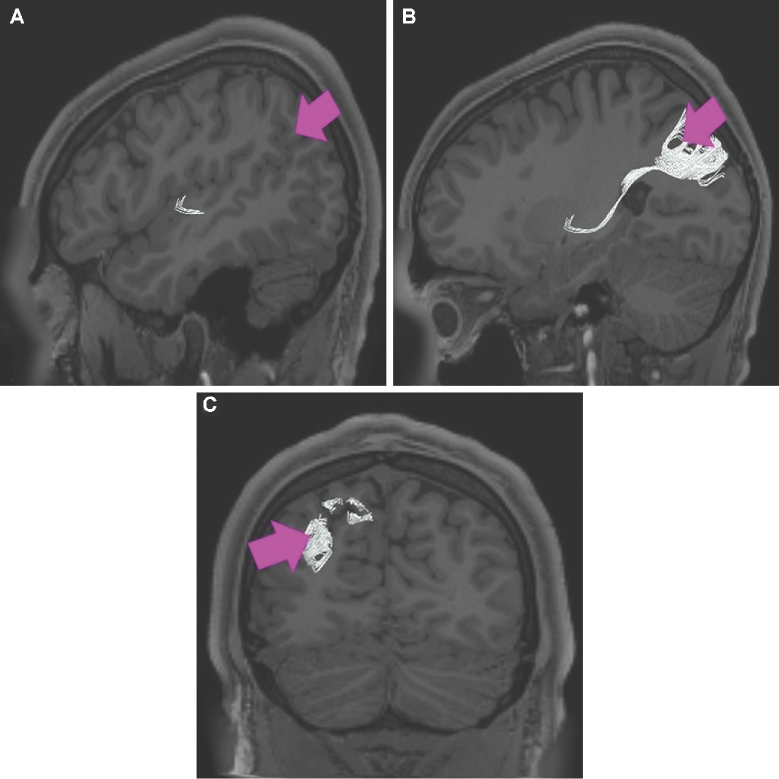
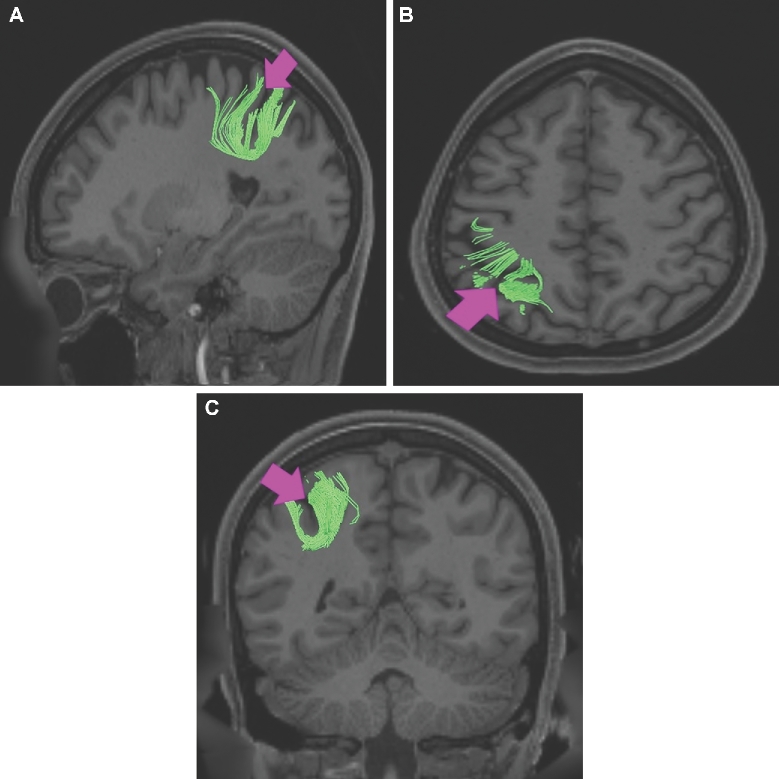
Structural connectivity of PFt in the left hemisphere, shown on T1-weighted MR images. A and B, Sagittal and C, axial views showing projections to local parcellations and the arcuate/SLF. White: white matter tracts of PFt demonstrating connections with local parcellations and the arcuate/SLF. Pink arrows indicate the location of the parcellation of interest.
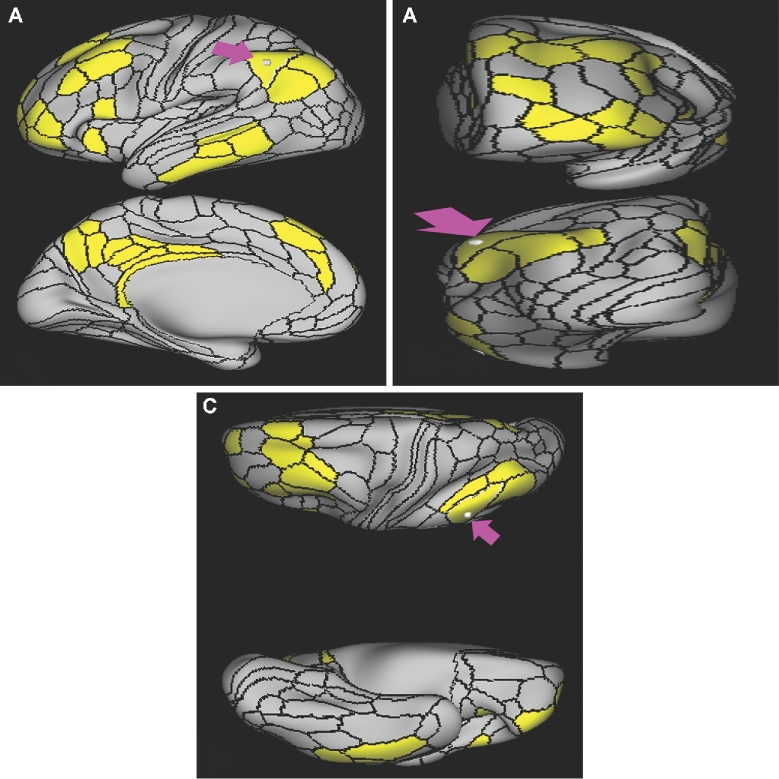
Functional connectivity of PF demonstrated on an inflated left hemisphere. A, Lateral and medial views. B, Rostral and caudal views. C, Dorsal and ventral views. Parcellations with the strongest functional connectivity are shown in yellow. Pink arrows designate the parcellation of interest.
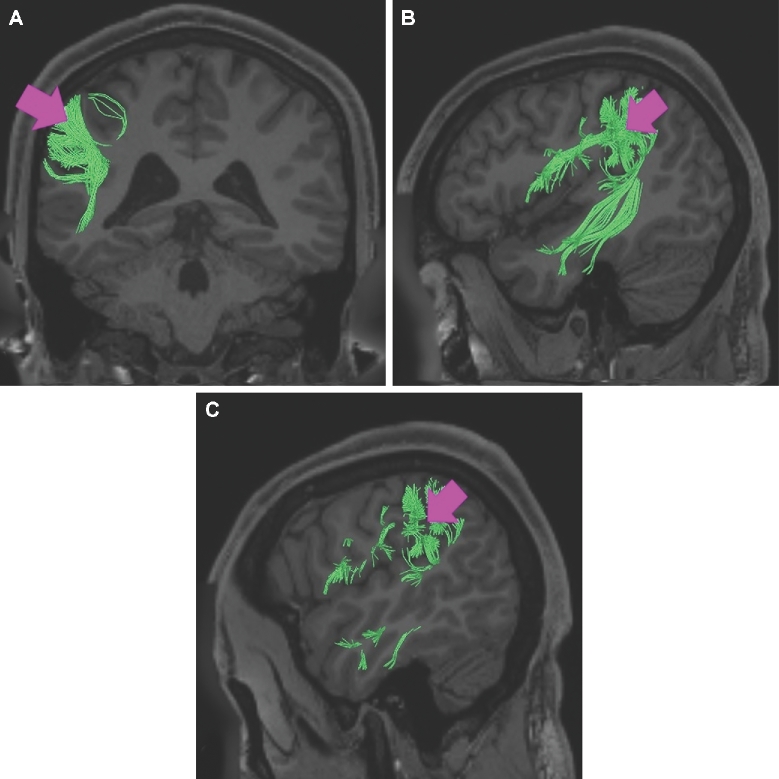
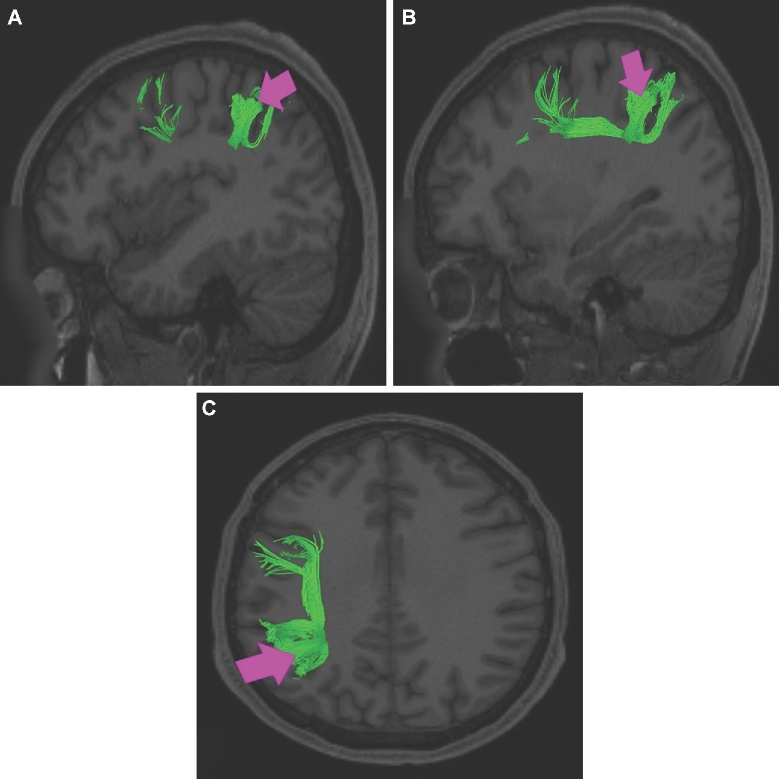
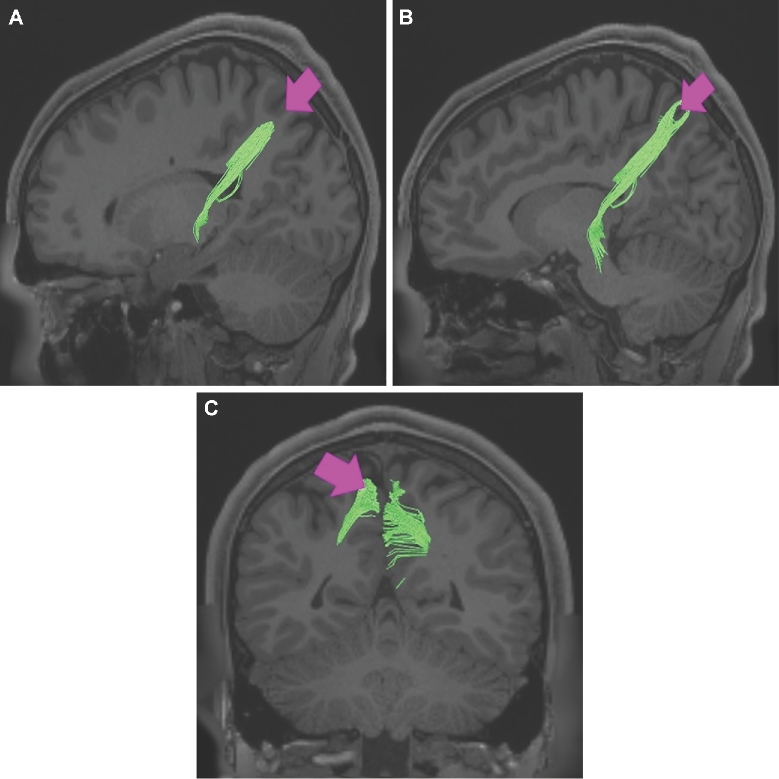
Structural connectivity of PF in the left hemisphere, shown on T1-weighted MR images. A, Coronal view, B, medial sagittal view and C, lateral sagittal view showing projections to local parcellations and the arcuate/SLF. Green: white matter tracts of PF demonstrating connections with local parcellations and the arcuate/SLF. Pink arrows indicate the location of the parcellation of interest.
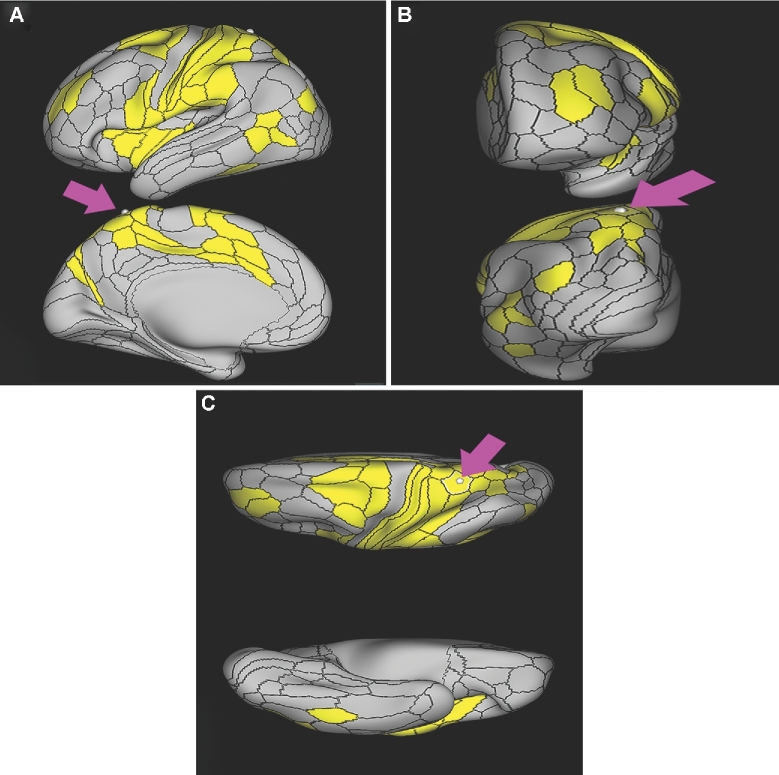
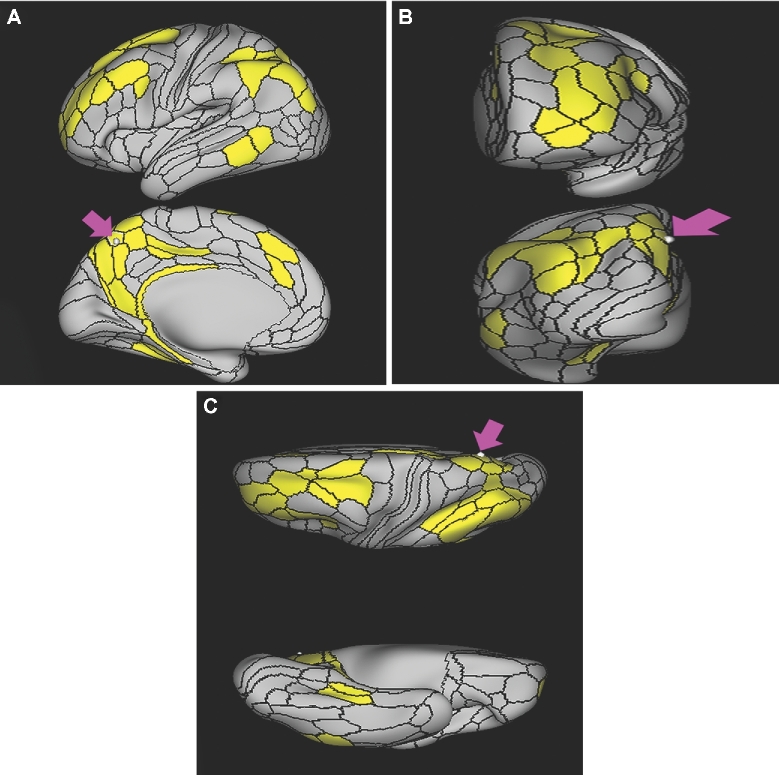
Functional connectivity of PFm demonstrated on an inflated left hemisphere. A, Lateral and medial views. B, Rostral and caudal views. C, Dorsal and ventral views. Parcellations with the strongest functional connectivity are shown in yellow. Pink arrows designate the parcellation of interest.
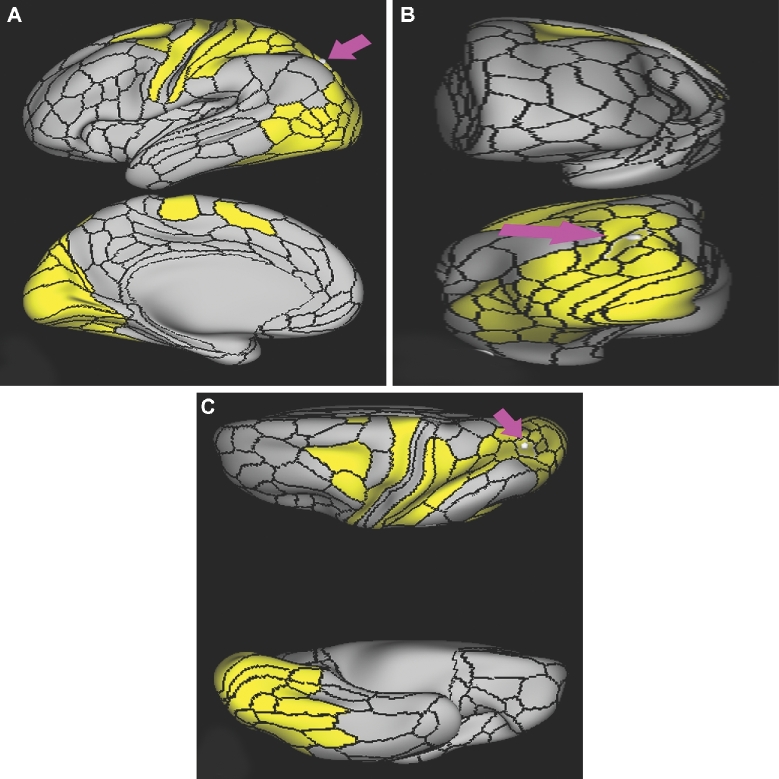
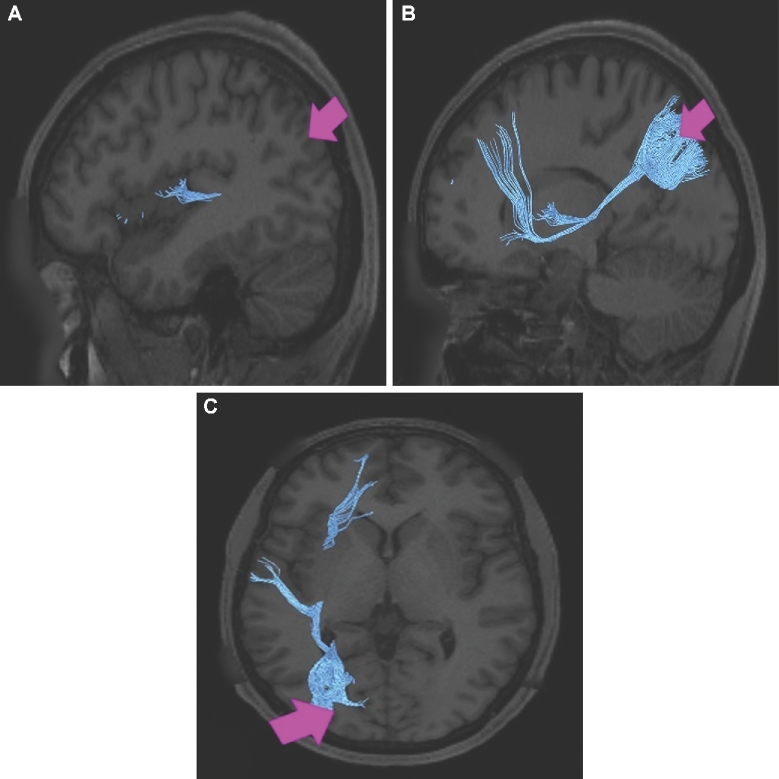
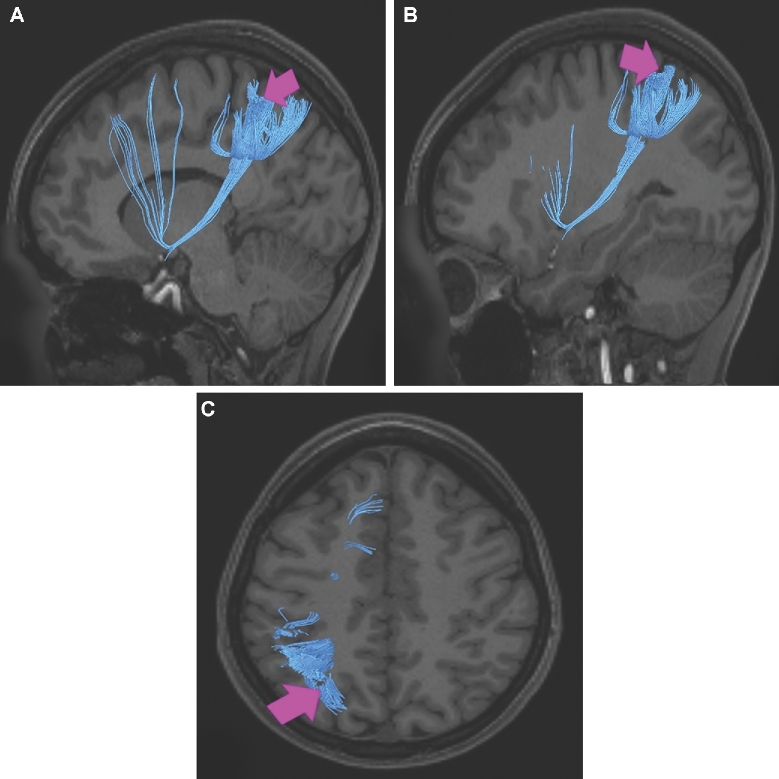
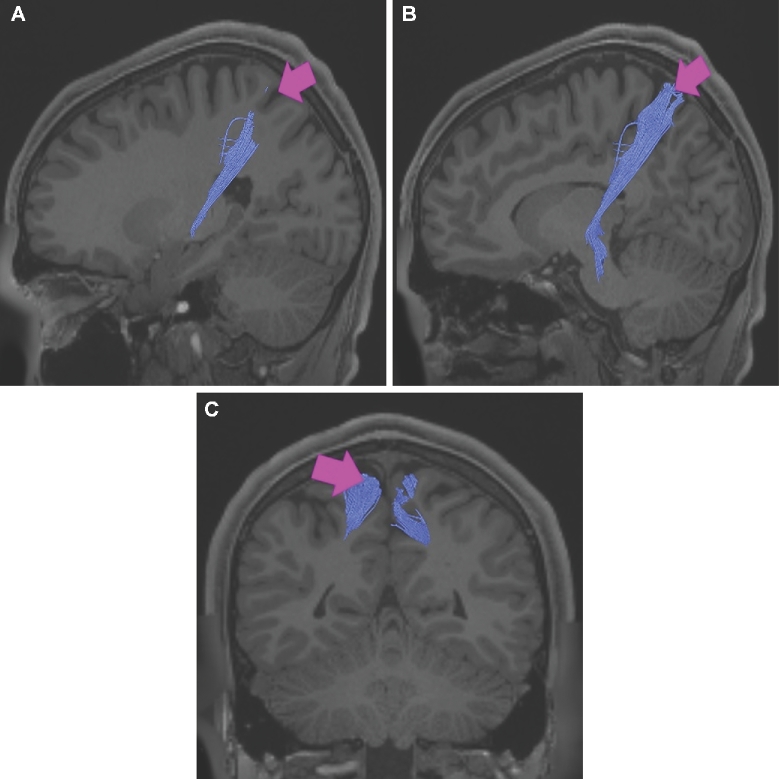
Structural connectivity of PFm in the left hemisphere, shown on T1-weighted MR images. A and B, Sagittal views, C, coronal view, and D, axial view showing projections to local parcellations and the arcuate/SLF. Blue: white matter tracts of PFm demonstrating connections with local parcellations and arcuate/SLF. Pink arrows indicate the location of the parcellation of interest.
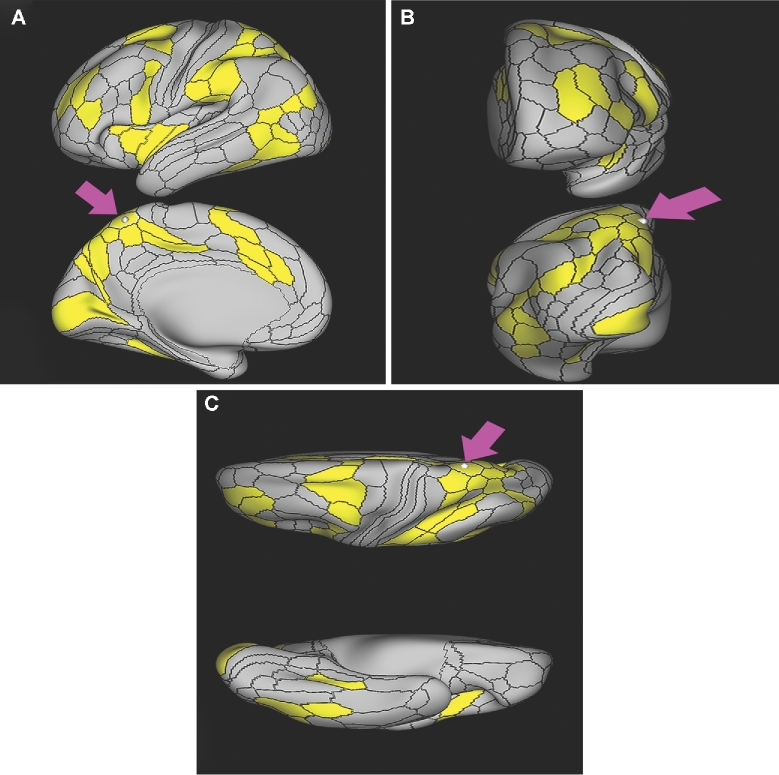
Functional connectivity of PGs demonstrated on an inflated left hemisphere. A, Lateral and medial views. B, Rostral and caudal views. C, Dorsal and ventral views. Parcellations with the strongest functional connectivity are shown in yellow. Pink arrows designate the parcellation of interest.
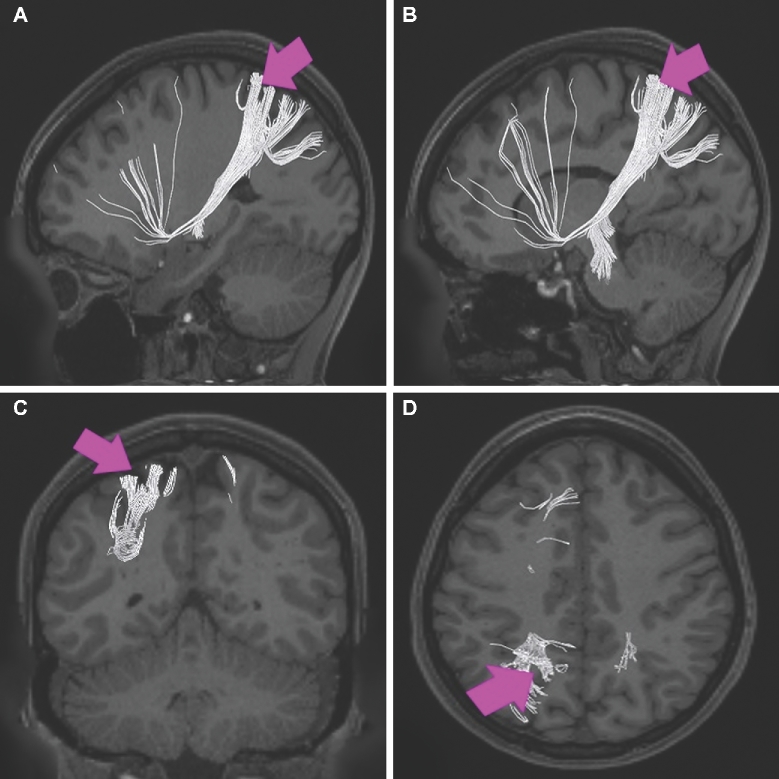
Structural connectivity of PGs in the left hemisphere, shown on T1-weighted MR images. A and B, Sagittal views, C, coronal view, and D, axial view showing projections to local parcellations and the arcuate/SLF. White: white matter tracts of PGs demonstrating connections with local parcellations and the arcuate/SLF. Pink arrows indicate the location of the parcellation of interest.
Functional connectivity of PGi demonstrated on an inflated left hemisphere. A, Lateral and medial views. B, Rostral and caudal views. C, Dorsal and ventral views. Parcellations with the strongest functional connectivity are shown in yellow. Pink arrows designate the parcellation of interest.
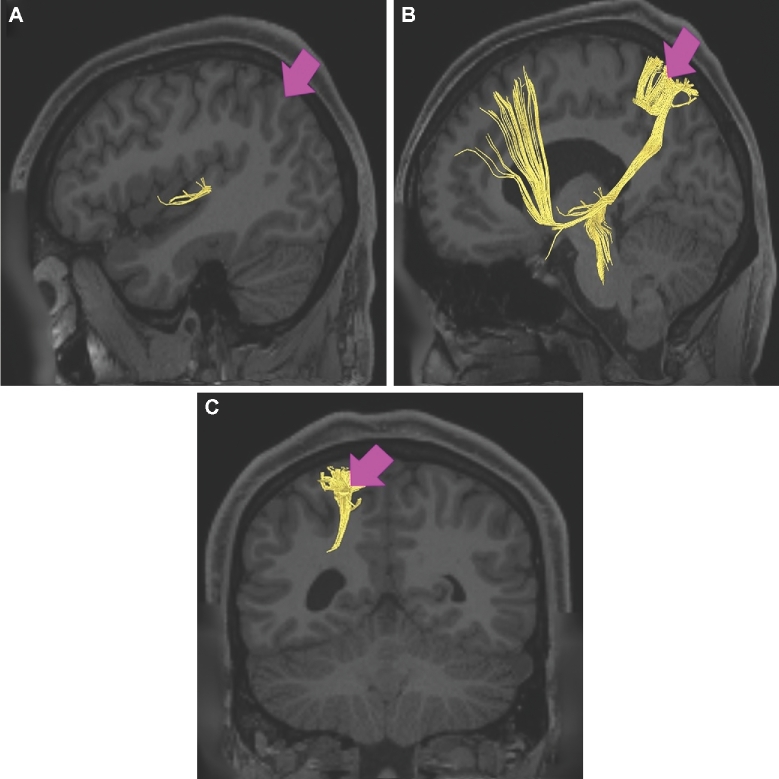
Structural connectivity of PGi in the left hemisphere, shown on T1-weighted MR images. A and B, Sagittal views and C, coronal view showing projections to local parcellations and the arcuate/SLF. Yellow: white matter tracts of PGi demonstrating connections with local parcellations and the arcuate/SLF. Pink arrows indicate the location of the parcellation of interest.
Functional connectivity of PGp demonstrated on an inflated left hemisphere. A, Lateral and medial views. B, Rostral and caudal views. C, Dorsal and ventral views. Parcellations with the strongest functional connectivity are shown in yellow. Pink arrows designate the parcellation of interest.
Structural connectivity of PGp in the left hemisphere, shown on T1-weighted MR images. A and B, Sagittal views and C, coronal view showing projections to local parcellations and the inferior longitudinal fasiculus (ILF). Blue: white matter tracts of PGs demonstrating connections with local parcellations and the ILF. Pink arrows indicate the location of the parcellation of interest.
Functional connectivity of TPOJ1 demonstrated on an inflated left hemisphere. A, Lateral and medial views. B, Rostral and caudal views. C, Dorsal and ventral views. Parcellations with the strongest functional connectivity are shown in yellow. Pink arrows designate the parcellation of interest.
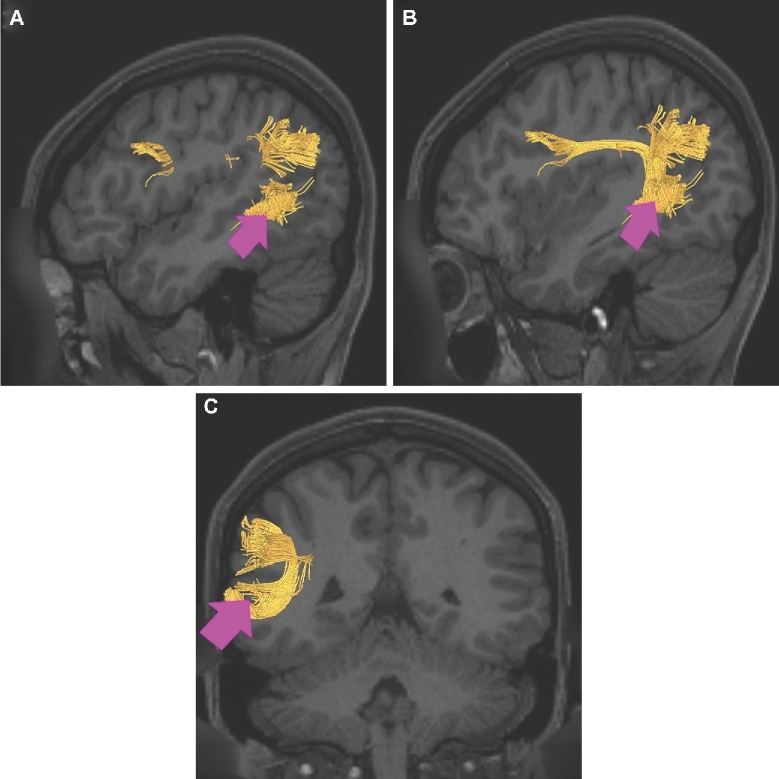
Structural connectivity of TPOJ1 in the left hemisphere, shown on T1-weighted MR images. A and B, Sagittal views and C, coronal view showing projections to local parcellations and the arcuate/SLF. Yellow: white matter tracts of TPOJ1 demonstrating connections with local parcellations and the arcuate/SLF. Pink arrows indicate the location of the parcellation of interest.
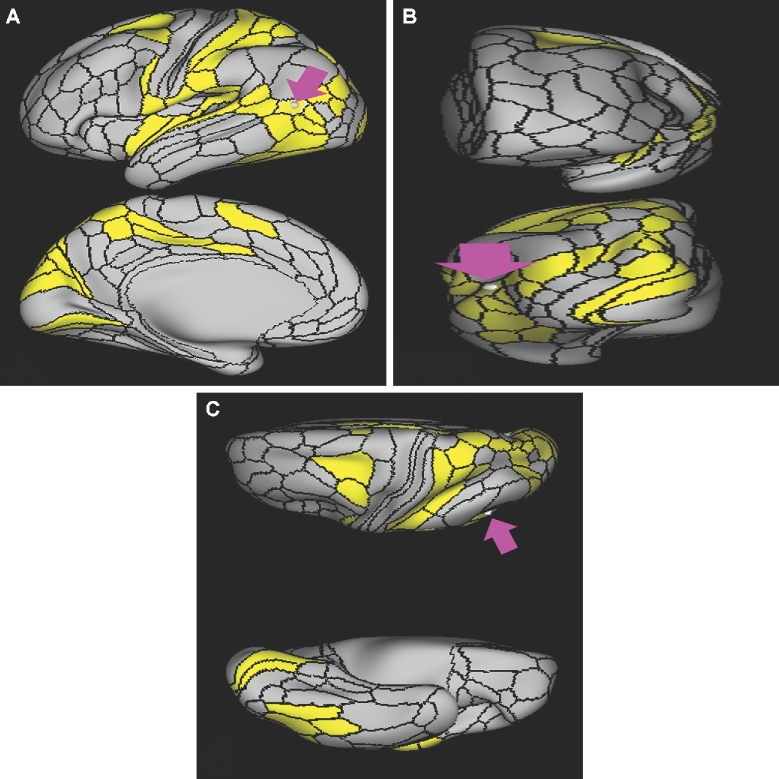
Functional connectivity of TPOJ2 demonstrated on an inflated left hemisphere. A, Lateral and medial views. B, Rostral and caudal views. C, Dorsal and ventral views. Parcellations with the strongest functional connectivity are shown in yellow. Pink arrows designate the parcellation of interest.
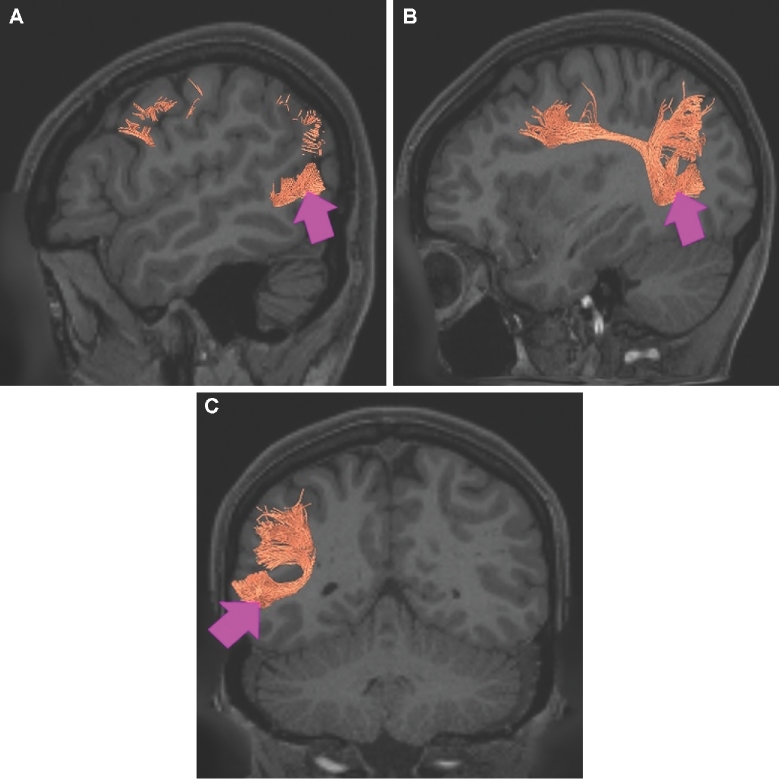
Structural connectivity of TPOJ2 in the left hemisphere, shown on T1-weighted MR images. A and B, Sagittal views and C, coronal view showing projections to local parcellations and the arcuate/SLF. Orange: white matter tracts of TPOJ2 demonstrating connections with local parcellations and the SLF/arcuate. Pink arrows indicate the location of the parcellation of interest.

Functional connectivity of TPOJ3 demonstrated on an inflated left hemisphere. A, Lateral and medial views. B, Rostral and caudal views. C, Dorsal and ventral views. Parcellations with the strongest functional connectivity are shown in yellow. Pink arrows designate the parcellation of interest.
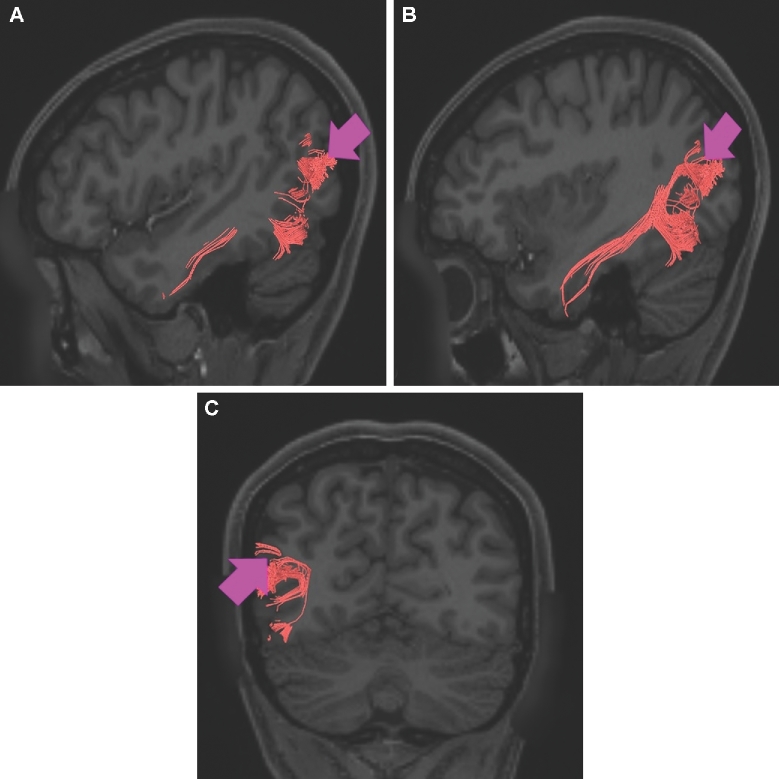
Structural connectivity of TPOJ3 in the left hemisphere, shown on T1-weighted MR images. A and B, Sagittal views and C, coronal view showing projections to local parcellations and the ILF. Red: white matter tracts of TPOJ2 demonstrating connections with local parcellations and the ILF. Pink arrows indicate the location of the parcellation of interest.
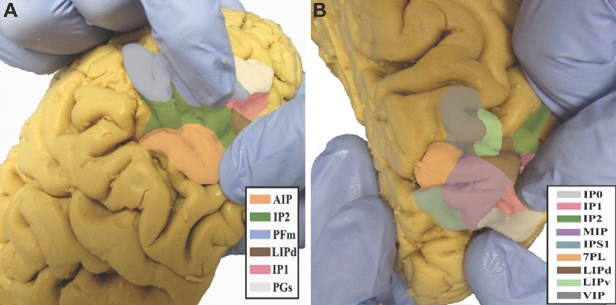
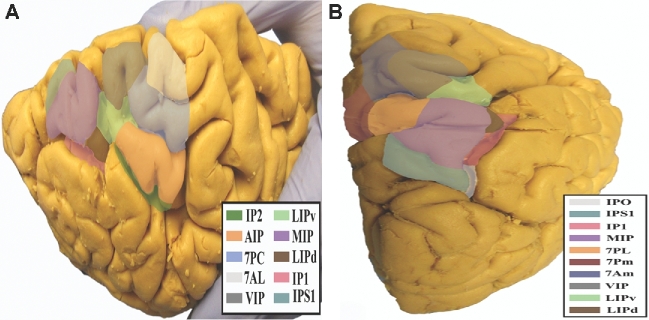
Anatomic view of the intraparietal sulcus parcellations shown on the right hemisphere of a cadaver brain. A, Superior caudal view of the intraparietal sulcus. B, Lateral view of the intraparietal sulcus with widening of the sulcus to show extent the parcellations.
Combined structural connectivity of the parcellations comprising the intraparietal sulcus shown on T1-weighted MR images. Sagittal views, A, lateral and B, medial. C, Axial view.
Functional connectivity of IP2 demonstrated on an inflated left hemisphere. A, Lateral and medial views. B, Rostral and caudal views. C, Dorsal and ventral views. Parcellations with the strongest functional connectivity are shown in yellow. Pink arrows designate the parcellation of interest.
Structural connectivity of IP2 in the left hemisphere, shown on T1-weighted MR images. A and B, Sagittal views and C, axial view showing projections to local parcellations and the arcuate/SLF. Green: white matter tracts of IP2 demonstrating connections with local parcellations and the arcuate/SLF. Pink arrows indicate the location of the parcellation of interest.
Functional connectivity of IP1 demonstrated on an inflated left hemisphere. A, Lateral and medial views. B, Rostral and caudal views. C, Dorsal and ventral views. Parcellations with the strongest functional connectivity are shown in yellow. Pink arrows designate the parcellation of interest.
Structural connectivity of IP1 in the left hemisphere, shown on T1-weighted MR images. A and B, Sagittal views and C, axial view showing projections to local parcellations and the arcuate/SLF. Pink: white matter tracts of IP1 demonstrating connections with local parcellations and the arcuate/SLF. Pink arrows indicate the location of the parcellation of interest.
Functional connectivity of IP0 demonstrated on an inflated left hemisphere. A, Lateral and medial views. B, Rostral and caudal views. C, Dorsal and ventral views. Parcellations with the strongest functional connectivity are shown in yellow. Pink arrows designate the parcellation of interest.
Structural connectivity of IP0 in the left hemisphere, shown on T1-weighted MR images. A and B, Sagittal views and C, coronal view showing projections to local parcellations and the MdLF. White: white matter tracts of IP0 demonstrating connections with local parcellations and the MdLF. Pink arrows indicate the location of the parcellation of interest.
Functional connectivity of IPS1 demonstrated on an inflated left hemisphere. A, Lateral and medial views. B, Rostral and caudal views. C, Dorsal and ventral views. Parcellations with the strongest functional connectivity are shown in yellow. Pink arrows designate the parcellation of interest.
Structural connectivity of IPS1 in the left hemisphere, shown on T1-weighted MR images. A and B, Sagittal views and C, axial view showing projections to local parcellations, the IFOF, and the MdLF. Light blue: white matter tracts of IPS1 demonstrating connections with local parcellations, IFOF, and MdLF. Pink arrows indicate the location of the parcellation of interest.
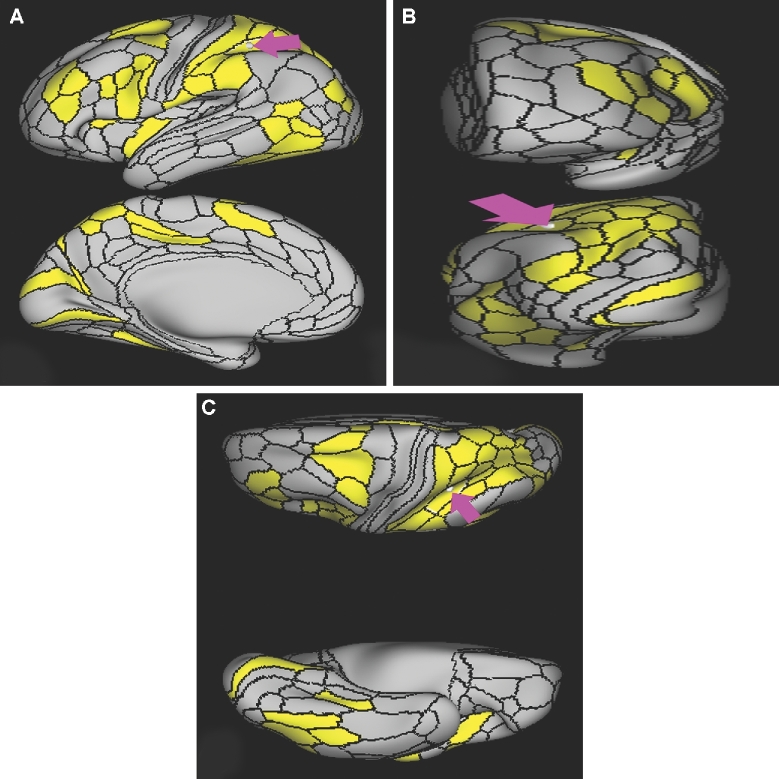
Functional connectivity of AIP demonstrated on an inflated left hemisphere. A, Lateral and medial views. B, Rostral and caudal views. C, Dorsal and ventral views. Parcellations with the strongest functional connectivity are shown in yellow. Pink arrows designate the parcellation of interest.
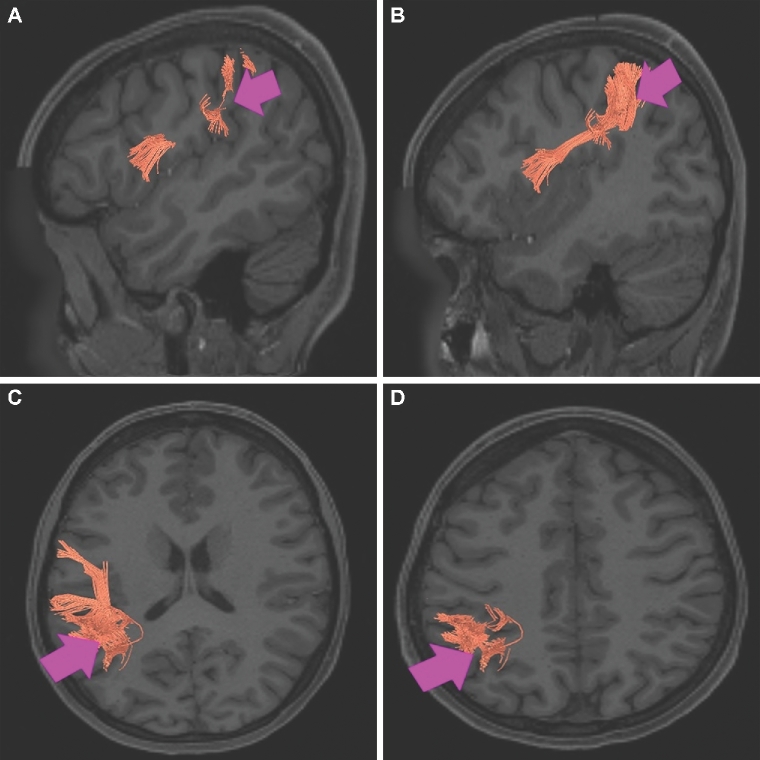
Structural connectivity of AIP in the left hemisphere, shown on T1-weighted MR images. A and B, Sagittal views and C and D, axial views showing projections to local parcellations and the arcuate/SLF. Orange: white matter tracts of AIP demonstrating connections with local parcellations and arcuate/SLF. Pink arrows indicate the location of the parcellation of interest.
Functional connectivity of LIPd demonstrated on an inflated left hemisphere. A, Lateral and medial views. B, Rostral and caudal views. C, Dorsal and ventral views. Parcellations with the strongest functional connectivity are shown in yellow. Pink arrows designate the parcellation of interest.
Structural connectivity of LIPd in the left hemisphere, shown on T1-weighted MR images. A and B, Sagittal views and C, axial view showing projections to local parcellations and the arcuate/SLF. Red: white matter tracts of LIPd demonstrating connections with local parcellations and arcuate/SLF. Pink arrows indicate the location of the parcellation of interest.
Functional connectivity of LIPv demonstrated on an inflated left hemisphere. A, Lateral and medial views. B, Rostral and caudal views. C, Dorsal and ventral views. Parcellations with the strongest functional connectivity are shown in yellow. Pink arrows designate the parcellation of interest.
Structural connectivity of LIPv in the left hemisphere, shown on T1-weighted MR images. A, Sagittal, B, axial, and C, coronal views showing projections to local parcellations. Light green: white matter tracts of LIPv demonstrating connections with local parcellations. Pink arrows indicate the location of the parcellation of interest.
Functional connectivity of MIP demonstrated on an inflated left hemisphere. A, Lateral and medial views. B, Rostral and caudal views. C, Dorsal and ventral views. Parcellations with the strongest functional connectivity are shown in yellow. Pink arrows designate the parcellation of interest.
Structural connectivity of MIP in the left hemisphere, shown on T1-weighted MR images. A and B, Sagittal views, C, coronal view, and D, axial view showing projections to local parcellations, the IFOF, and the MdLF. Purple: white matter tracts of MIP demonstrating connections with local parcellations, IFOF, and MdLF. Pink arrows indicate the location of the parcellation of interest.
Anatomic view of the superior parietal lobule parcellations shown on the right hemisphere of a cadaver brain. A, Dorsolateral view of the superior parietal lobule. B, Caudal view of the superior parietal lobule.

Combined structural connectivity of the parcellations comprising the superior parietal lobule shown on T1-weighted MR images. A-C, Sagittal views, from A, most medial to B and C, most lateral. D, Coronal view.
Functional connectivity of 7PC demonstrated on an inflated left hemisphere. A, Lateral and medial views. B, Rostral and caudal views. C, Dorsal and ventral views. Parcellations with the strongest functional connectivity are shown in yellow. Pink arrows designate the parcellation of interest.
Structural connectivity of 7PC in the left hemisphere, shown on T1-weighted MR images. A and B, Sagittal views, C, axial view showing projections to local parcellations and the IFOF. Light blue: white matter tracts of 7PC demonstrating connections with local parcellations and IFOF. Pink arrows indicate the location of the parcellation of interest.
Functional connectivity of 7AL demonstrated on an inflated left hemisphere. A, Lateral and medial views. B, Rostral and caudal views. C, Dorsal and ventral views. Parcellations with the strongest functional connectivity are shown in yellow. Pink arrows designate the parcellation of interest.
Structural connectivity of 7AL in the left hemisphere, shown on T1-weighted MR images. A and B, Sagittal views, C, coronal view, and D, axial view showing projections to local parcellations, the IFOF, and the ipsilateral thalamus and contralateral hemishere. White: white matter tracts of 7PC demonstrating connections with local parcellations, IFOF, thalamus, and contralateral hemisphere. Pink arrows indicate the location of the parcellation of interest.
Functional connectivity of 7AM demonstrated on an inflated left hemisphere. A, Lateral and medial views. B, Rostral and caudal views. C, Dorsal and ventral views. Parcellations with the strongest functional connectivity are shown in yellow. Pink arrows designate the parcellation of interest.
Structural connectivity of 7AM in the left hemisphere, shown on T1-weighted MR images. A and B, Sagittal views and C, coronal view showing projections to local parcellations, the ipsilateral thalamus, and the contralateral hemisphere. Blue: white matter tracts of 7AM demonstrating connections with local parcellations, thalamus, and the contralateral hemisphere. Pink arrows indicate the location of the parcellation of interest.

Functional connectivity of 7PL demonstrated on an inflated left hemisphere. A, Lateral and medial views. B, Rostral and caudal views. C, Dorsal and ventral views. Parcellations with the strongest functional connectivity are shown in yellow. Pink arrows designate the parcellation of interest.

Structural connectivity of 7PL in the left hemisphere, shown on T1-weighted MR images. A and B, Sagittal views and C, coronal view showing projections to local parcellations, the IFOF, the MdLF, and the ipsilateral thalamus. Orange: white matter tracts of 7PL demonstrating connections with local parcellations, IFOF, MdLF, and thalamus. Pink arrows indicate the location of the parcellation of interest.
Functional connectivity of 7Pm demonstrated on an inflated left hemisphere. A, Lateral and medial views. B, Rostral and caudal views. C, Dorsal and ventral views. Parcellations with the strongest functional connectivity are shown in yellow. Pink arrows designate the parcellation of interest.
Structural connectivity of 7Pm in the left hemisphere, shown on T1-weighted MR images. A and B, Sagittal views and C, coronal view showing projections to local parcellations, the ipsilateral thalamus, and the contralateral hemisphere. Light green: white matter tracts of 7Pm demonstrating connections with local parcellations, thalamus, and the contralateral hemisphere. Pink arrows indicate the location of the parcellation of interest.

Functional connectivity of VIP demonstrated on an inflated left hemisphere. A, Lateral and medial views. B, Rostral and caudal views. C, Dorsal and ventral views. Parcellations with the strongest functional connectivity are shown in yellow. Pink arrows designate the parcellation of interest.
Structural connectivity of VIP in the left hemisphere, shown on T1-weighted MR images. A and B, Sagittal views and C, coronal view showing projections to local parcellations, the MdLF, the IFOF, and thalamus. Yellow: white matter tracts of 7PC demonstrating connections with local parcellations, MdLF, IFOF, and thalamus. Pink arrows indicate the location of the parcellation of interest.
Similar articles
-
A Connectomic Atlas of the Human Cerebrum-Chapter 8: The Posterior Cingulate Cortex, Medial Parietal Lobe, and Parieto-Occipital Sulcus.Oper Neurosurg. 2018 Dec 1;15(suppl_1):S350-S371. doi: 10.1093/ons/opy262. Oper Neurosurg. 2018. PMID: 30260425 Free PMC article.
-
A Connectomic Atlas of the Human Cerebrum-Chapter 6: The Temporal Lobe.Oper Neurosurg. 2018 Dec 1;15(suppl_1):S245-S294. doi: 10.1093/ons/opy260. Oper Neurosurg. 2018. PMID: 30260447 Free PMC article.
-
A Connectomic Atlas of the Human Cerebrum-Chapter 9: The Occipital Lobe.Oper Neurosurg. 2018 Dec 1;15(suppl_1):S372-S406. doi: 10.1093/ons/opy263. Oper Neurosurg. 2018. PMID: 30260435 Free PMC article.
-
Microarchitecture and connectivity of the parietal lobe.Handb Clin Neurol. 2018;151:53-72. doi: 10.1016/B978-0-444-63622-5.00003-6. Handb Clin Neurol. 2018. PMID: 29519479 Review.
-
Exploration of the neural substrates of executive functioning by functional neuroimaging.Neuroscience. 2006 Apr 28;139(1):209-21. doi: 10.1016/j.neuroscience.2005.05.035. Epub 2005 Dec 1. Neuroscience. 2006. PMID: 16324796 Review.
Cited by
-
Temporal Electroencephalography Traits Dissociating Tactile Information and Cross-Modal Congruence Effects.Sensors (Basel). 2023 Dec 21;24(1):45. doi: 10.3390/s24010045. Sensors (Basel). 2023. PMID: 38202907 Free PMC article.
-
Spatiotemporal dynamics of cortical somatosensory network in typically developing children.Cereb Cortex. 2024 Jun 4;34(6):bhae230. doi: 10.1093/cercor/bhae230. Cereb Cortex. 2024. PMID: 38836408 Free PMC article.
-
Beyond eloquence and onto centrality: a new paradigm in planning supratentorial neurosurgery.J Neurooncol. 2020 Jan;146(2):229-238. doi: 10.1007/s11060-019-03327-4. Epub 2020 Jan 1. J Neurooncol. 2020. PMID: 31894519
-
Visuomotor processing is altered after peripheral nerve damage in neuralgic amyotrophy.Brain Commun. 2022 Feb 16;4(1):fcac034. doi: 10.1093/braincomms/fcac034. eCollection 2022. Brain Commun. 2022. PMID: 35233524 Free PMC article.
-
Cortical gyrification in children with attention deficit-hyperactivity disorder and prenatal alcohol exposure.Drug Alcohol Depend. 2021 Aug 1;225:108817. doi: 10.1016/j.drugalcdep.2021.108817. Epub 2021 Jun 18. Drug Alcohol Depend. 2021. PMID: 34171826 Free PMC article.
References
-
- Shalom DB, Poeppel D. Functional anatomic models of language: assembling the pieces. Neuroscientist. 2008;14(1):119-127. - PubMed
-
- Ishibashi R, Lambon Ralph MA, Saito S, Pobric G. Different roles of lateral anterior temporal lobe and inferior parietal lobule in coding function and manipulation tool knowledge: Evidence from an rTMS study. Neuropsychologia. 2011;49(5):1128-1135. - PubMed
Publication types
MeSH terms
Grants and funding
LinkOut - more resources
Full Text Sources
Other Literature Sources
