

doi: 10.1093/ons/opy263.
A Connectomic Atlas of the Human Cerebrum-Chapter 9: The Occipital Lobe
Affiliations
- PMID: 30260435
- PMCID: PMC6888039
- DOI: 10.1093/ons/opy263
Item in Clipboard
A Connectomic Atlas of the Human Cerebrum-Chapter 9: The Occipital Lobe
Oper Neurosurg.
.
Abstract
In this supplement, we build on work previously published under the Human Connectome Project. Specifically, we seek to show a comprehensive anatomic atlas of the human cerebrum demonstrating all 180 distinct regions comprising the cerebral cortex. The location, functional connectivity, and structural connectivity of these regions are outlined, and where possible a discussion is included of the functional significance of these areas. In part 9, we specifically address regions relevant to the occipital lobe and the visual system.
Figures

Anatomic location of medial occipital lobe parcellations shown on the right hemisphere of a cadaver brain. A, Medial view of the occipital lobe. B, Medial view with widening of the calcarine sulcus to show extension of V1. C, Caudal view of the occipital pole. Corresponding labels are shown in the lower right corner of each figure.

Combined structural connectivity of medial surface parcellations. A, Medial and B, lateral views of sagittal plane, C, axial plane, and D, coronal plane are shown. Tracks include V1 (purple), V2 (light blue), V3 (white), and V4 (green).

Functional connectivity of V1 demonstrated on an inflated left hemisphere. A, Lateral and medial views. B, Rostral and caudal views. C, Dorsal and ventral views. Parcellations with the strongest functional connectivity are shown in yellow. Pink arrows designate the parcellation of interest.
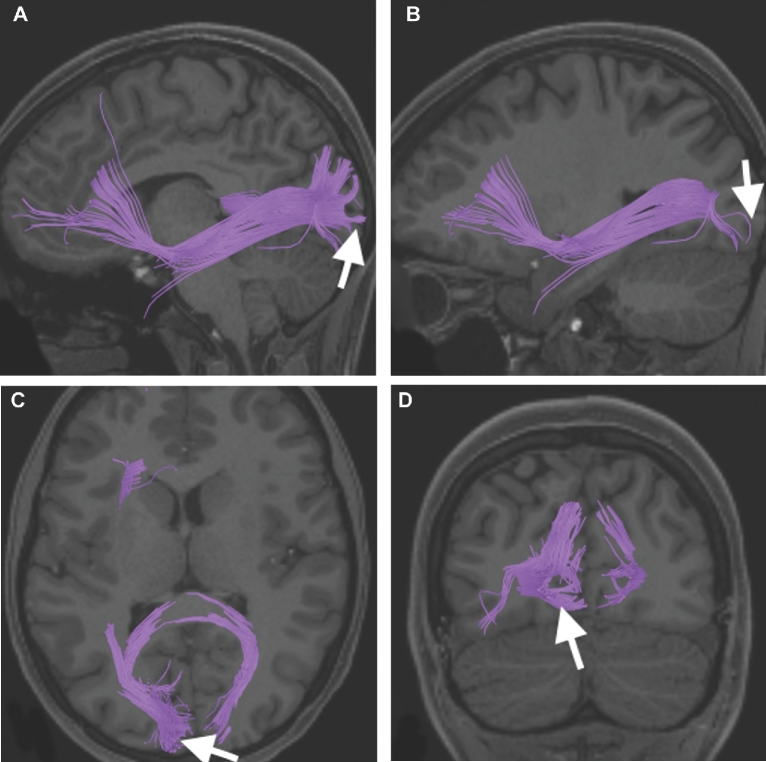
Structural connectivity of V1 in the left hemisphere, shown on T1-weighted magnetic resonance (MR) images. Sagittal views of A, medial and B, lateral planes. C, Axial and D, coronal views showing projections to the contralateral hemisphere. Purple: white matter tracts of V1 demonstrating connections with the IFOF, MdLF and optic radiations, and FM.

Functional connectivity of V2 demonstrated on an inflated left hemisphere. A, Lateral and medial views. B, Rostral and caudal views. C, Dorsal and ventral views. Parcellations with the strongest functional connectivity are shown in yellow. Pink arrows designate the parcellation of interest.

Structural connectivity of V2 in the left hemisphere, shown on T1-weighted MR images. Sagittal views of A, medial and B, lateral planes. C, Axial and D, coronal views showing projections to the contralateral hemisphere. Light blue: white matter tracts of V2 demonstrating connections with the IFOF, ILF, MdLF, and contralateral hemisphere.

Functional connectivity of V3 demonstrated on an inflated left hemisphere. A, Lateral and medial views. B, Rostral and caudal views. C, Dorsal and ventral views. Parcellations with the strongest functional connectivity are shown in yellow. Pink arrows designate the parcellation of interest.

Structural connectivity of V3 in the left hemisphere, shown on T1-weighted MR images. Sagittal views of A, medial and B, lateral planes. C, Axial and D, coronal views showing projections to the contralateral hemisphere. White: white matter tracts of V3 demonstrating connections with the IFOF, ILF, MdLF, and FM.

Functional connectivity of V4 demonstrated on an inflated left hemisphere. A, Lateral and medial views. B, Rostral and caudal views. C, Dorsal and ventral views. Parcellations with the strongest functional connectivity are shown in yellow. Pink arrows designate the parcellation of interest.

Structural connectivity of V4 in the left hemisphere, shown on T1-weighted MR images. Sagittal views of A, medial and B, lateral planes. C, Axial and D, coronal views showing projections to the contralateral hemisphere. Green: white matter tracts of V4 demonstrating connections with the ILF, MdLF, and portions of IFOF.

Anatomic location of basal occipital lobe parcellations shown on the right hemisphere of a cadaver brain. A, Ventral view of the occipital lobe. B, Ventral view with widening of the collateral sulcus to show extension of VMV2, VMV3, PHA2, and PHA3. Corresponding labels are shown in the lower right corner of each figure.
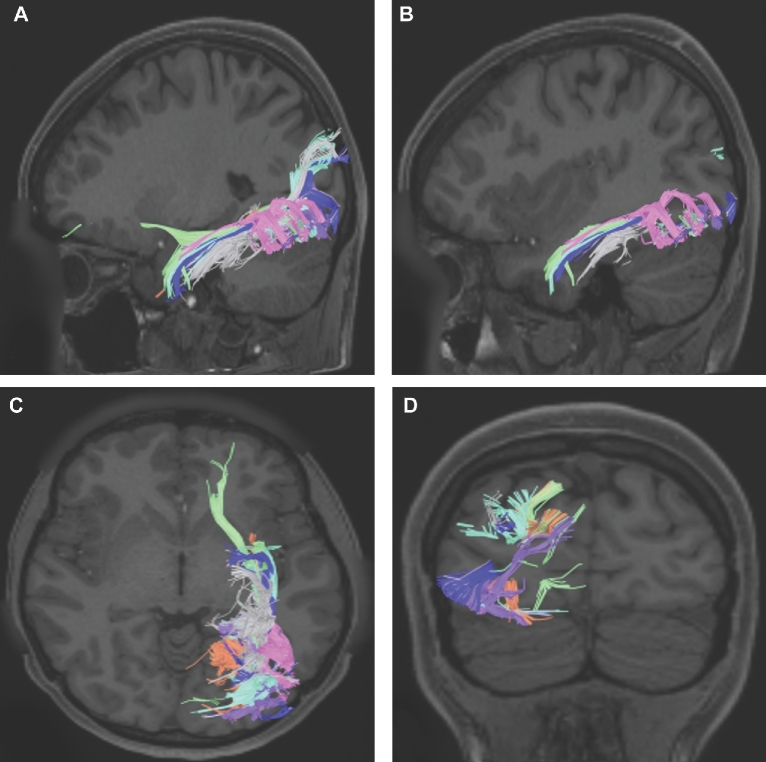
Combined structural connectivity of basal surface parcellations. A, Medial and B, lateral views of sagittal plane, C, axial plane, and D, coronal plane are shown. Tracks include V8 (turquoise), PIT (dark blue), FFC (pink), VVC (gray), VMV1 (orange), VMV2 (light green), and VMV3 (purple).

Functional connectivity of V8 demonstrated on an inflated left hemisphere. A, Lateral and medial views. B, Rostral and caudal views. C, Dorsal and ventral views. Parcellations with the strongest functional connectivity are shown in yellow. Pink arrows designate the parcellation of interest.

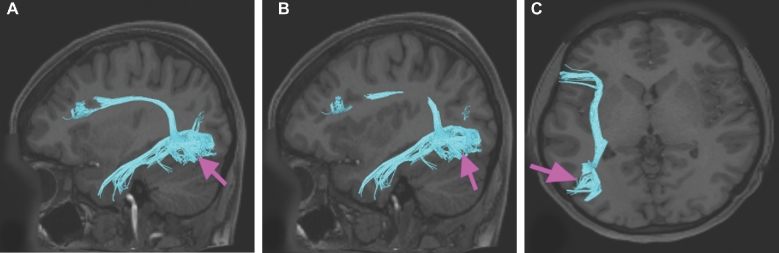
Structural connectivity of V8 in the left hemisphere, shown on T1-weighted MR images. Sagittal views of A, medial and B, lateral planes, and C, coronal view showing. Turquoise: white matter tracts of V8 demonstrating connections with the ILF and VOF.

Functional connectivity of PIT demonstrated on an inflated left hemisphere. A, Lateral and medial views. B, Rostral and caudal views. C, Dorsal and ventral views. Parcellations with the strongest functional connectivity are shown in yellow. Pink arrows designate the parcellation of interest.

Structural connectivity of PIT in the left hemisphere, shown on T1-weighted MR images. Sagittal views of A, medial and B, lateral planes, and C, coronal view showing. Dark blue: white matter tracts of PIT demonstrating connections with the VOF and its surrounding parcellations.

Functional connectivity of FFC demonstrated on an inflated left hemisphere. A, Lateral and medial views. B, Rostral and caudal views. C, Dorsal and ventral views. Parcellations with the strongest functional connectivity are shown in yellow. Pink arrows designate the parcellation of interest.

Structural connectivity of FFC in the left hemisphere, shown on T1-weighted MR images. Sagittal views of A, medial and B, lateral planes, and C, coronal view showing. Pink: white matter tracts of FFC demonstrating connections with the ILF.

Functional connectivity of VVC demonstrated on an inflated left hemisphere. A, Lateral and medial views. B, Rostral and caudal views. C, Dorsal and ventral views. Parcellations with the strongest functional connectivity are shown in yellow. Pink arrows designate the parcellation of interest.

Structural connectivity of VVC in the left hemisphere, shown on T1-weighted MR images. Sagittal views of A, medial and B, lateral planes, and C, coronal view showing. Gray: white matter tracts of VVC demonstrating connections with the ILF and VOF.

Functional connectivity of VMV1 demonstrated on an inflated left hemisphere. A, Lateral and medial views. B, Rostral and caudal views. C, Dorsal and ventral views. Parcellations with the strongest functional connectivity are shown in yellow. Pink arrows designate the parcellation of interest.

Structural connectivity of VMV1 in the left hemisphere, shown on T1-weighted MR images. Sagittal views of A, medial and B, lateral planes, and C, coronal view showing. Orange: white matter tracts of VMV1 demonstrating connections with the ILF and VOF.

Functional connectivity of VMV2 demonstrated on an inflated left hemisphere. A, Lateral and medial views. B, Rostral and caudal views. C, Dorsal and ventral views. Parcellations with the strongest functional connectivity are shown in yellow. Pink arrows designate the parcellation of interest.

Structural connectivity of VMV2 in the left hemisphere, shown on T1-weighted MR images. Sagittal views of A, medial and B, lateral planes, and C, coronal view. Light green: white matter tracts of VMV2 demonstrating connections with the ILF, IFOF, and VOF.

Functional connectivity of VMV3 demonstrated on an inflated left hemisphere. A, Lateral and medial views. B, Rostral and caudal views. C, Dorsal and ventral views. Parcellations with the strongest functional connectivity are shown in yellow. Pink arrows designate the parcellation of interest.

Structural connectivity of VMV3 in the left hemisphere, shown on T1-weighted MR images. Sagittal views of A, medial and B, lateral planes, and C, coronal view. Purple: white matter tracts of VMV3 demonstrating connections with the ILF and VOF.

Anatomic location of superior occipital lobe parcellations shown on the right hemisphere of a cadaver brain. A, Medial view of the occipital lobe with widening of the parietoccipital sulcus to show extension DVT and POS2. B, Posterior view of occipital lobe. Corresponding labels are shown in the lower right corner of each figure.

Combined structural connectivity of superior surface parcellations. A, Medial and B, lateral views of sagittal plane, C, axial plane, and D, coronal plane are shown. Tracks include V6 (orange), V6A (light green), V7 (red), V3A (pink), and V3B (dark blue).

Functional connectivity of V6 demonstrated on an inflated left hemisphere. A, Lateral and medial views. B, Rostral and caudal views. C, Dorsal and ventral views. Parcellations with the strongest functional connectivity are shown in yellow. Pink arrows designate the parcellation of interest.

Structural connectivity of V6 in the left hemisphere, shown on T1-weighted MR images. Sagittal views of A, medial and B, lateral planes, and C, oblique view. Orange: white matter tracts of V6 demonstrating connections with the IFOF, MdLF, and FM.

Functional connectivity of V6A demonstrated on an inflated left hemisphere. A, Lateral and medial views. B, Rostral and caudal views. C, Dorsal and ventral views. Parcellations with the strongest functional connectivity are shown in yellow. Pink arrows designate the parcellation of interest.

Structural connectivity of V6A in the left hemisphere, shown on T1-weighted MR images. Sagittal views of A, medial and B, lateral planes, and C, coronal view. Light green: white matter tracts of V6A demonstrating connections with the IFOF and MdLF.

Functional connectivity of V7 demonstrated on an inflated left hemisphere. A, Lateral and medial views. B, Rostral and caudal views. C, Dorsal and ventral views. Parcellations with the strongest functional connectivity are shown in yellow. Pink arrows designate the parcellation of interest.

Structural connectivity of V7 in the left hemisphere, shown on T1-weighted MR images. Sagittal views of A, medial and B, lateral planes, and C, axial view. Red: white matter tracts of V7 demonstrating connections with the IFOF, MdLF, and ILF.

Functional connectivity of V3A demonstrated on an inflated left hemisphere. A, Lateral and medial views. B, Rostral and caudal views. C, Dorsal and ventral views. Parcellations with the strongest functional connectivity are shown in yellow. Pink arrows designate the parcellation of interest.

Structural connectivity of V3A in the left hemisphere, shown on T1-weighted MR images. Sagittal views of A, medial and B, lateral planes, and C, coronal view. Pink: white matter tracts of V3A demonstrating connections with the IFOF, MdLF, and FM.

Functional connectivity of V3B demonstrated on an inflated left hemisphere. A, Lateral and medial views. B, Rostral and caudal views. C, Dorsal and ventral views. Parcellations with the strongest functional connectivity are shown in yellow. Pink arrows designate the parcellation of interest.

Structural connectivity of V3B in the left hemisphere, shown on T1-weighted MR images. Sagittal views of A, medial and B, lateral planes, and C, coronal view showing. Dark blue: white matter tracts of V3B demonstrating connections with local parcellations.

Anatomic location of lateral occipital lobe parcellations shown on the right hemisphere of a cadaver brain. Oblique lateral view of the occipital lobe. Corresponding labels are shown in the lower right corner of each figure.

Combined structural connectivity of lateral surface parcellations. A, Medial and B, lateral views of sagittal plane, and C, coronal plane are shown. Tracks include V3cd (light blue), LO1 (light green), LO2 (purple), LO3 (turquoise), V4t (green), MT (yellow), MST (orange), FST (pink), and PH (gray).

Functional connectivity of V3cd demonstrated on an inflated left hemisphere. A, Lateral and medial views. B, Rostral and caudal views. C, Dorsal and ventral views. Parcellations with the strongest functional connectivity are shown in yellow. Pink arrows designate the parcellation of interest.

Structural connectivity of V3cd in the left hemisphere, shown on T1-weighted MR images. A, Sagittal, B, axial, and C, coronal planes. Light blue: white matter tracts of V3cd demonstrating connections with local parcellations.

Functional connectivity of LO1 demonstrated on an inflated left hemisphere. A, Lateral and medial views. B, Rostral and caudal views. C, Dorsal and ventral views. Parcellations with the strongest functional connectivity are shown in yellow. Pink arrows designate the parcellation of interest.

Structural connectivity of LO1 in the left hemisphere, shown on T1-weighted MR images. Sagittal views of A, medial and B, lateral planes, and C, coronal view. Light green: white matter tracts of LO1 demonstrating connections with local parcellations.

Functional connectivity of LO2 demonstrated on an inflated left hemisphere. A, Lateral and medial views. B, Rostral and caudal views. C, Dorsal and ventral views. Parcellations with the strongest functional connectivity are shown in yellow. Pink arrows designate the parcellation of interest.

Structural connectivity of LO2 in the left hemisphere, shown on T1-weighted MR images. Sagittal views of A, medial and B, lateral planes, and C, axial view. Purple: white matter tracts of LO2 demonstrating connections with local parcellations.

Functional connectivity of LO3 demonstrated on an inflated left hemisphere. A, Lateral and medial views. B, Rostral and caudal views. C, Dorsal and ventral views. Parcellations with the strongest functional connectivity are shown in yellow. Pink arrows designate the parcellation of interest.

Structural connectivity of LO3 in the left hemisphere, shown on T1-weighted MR images. A, Sagittal, B, axial, and C, coronal planes. Turquoise: white matter tracts of LO3 demonstrating connections with ILF and local parcellations.

Functional connectivity of V4t demonstrated on an inflated left hemisphere. A, Lateral and medial views. B, Rostral and caudal views. C, Dorsal and ventral views. Parcellations with the strongest functional connectivity are shown in yellow. Pink arrows designate the parcellation of interest.

Structural connectivity of V4t in the left hemisphere, shown on T1-weighted MR images. Sagittal views of A, medial and B, lateral planes, and C, coronal view. Green: white matter tracts of V4t demonstrating connections with local parcellations.

Functional connectivity of MT demonstrated on an inflated left hemisphere. A, Lateral and medial views. B, Rostral and caudal views. C, Dorsal and ventral views. Parcellations with the strongest functional connectivity are shown in yellow. Pink arrows designate the parcellation of interest.

Structural connectivity of MT in the left hemisphere, shown on T1-weighted MR images. Sagittal views of A, medial and B, lateral planes, and C, coronal view. Yellow: white matter tracts of MT demonstrating connections with ILF.

Functional connectivity of MST demonstrated on an inflated left hemisphere. A, Lateral and medial views. B, Rostral and caudal views. C, Dorsal and ventral views. Parcellations with the strongest functional connectivity are shown in yellow. Pink arrows designate the parcellation of interest.

Structural connectivity of MST in the left hemisphere, shown on T1-weighted MR images. Sagittal views of A, medial and B, lateral planes, and C, coronal view. Orange: white matter tracts of MST demonstrating connections with ILF.

Functional connectivity of FST demonstrated on an inflated left hemisphere. A, Lateral and medial views. B, Rostral and caudal views. C, Dorsal and ventral views. Parcellations with the strongest functional connectivity are shown in yellow. Pink arrows designate the parcellation of interest.

Structural connectivity of FST in the left hemisphere, shown on T1-weighted MR images. Sagittal views of A, medial and B, lateral planes, and C, axial view. Pink: white matter tracts of FST demonstrating connections with SLF and ILF.

Functional connectivity of PH demonstrated on an inflated left hemisphere. A, Lateral and medial views. B, Rostral and caudal views. C, Dorsal and ventral views. Parcellations with the strongest functional connectivity are shown in yellow. Pink arrows designate the parcellation of interest.
Structural connectivity of PH in the left hemisphere, shown on T1-weighted MR images. Sagittal views of A, medial and B, lateral planes, and C, axial view. Gray: white matter tracts of PH demonstrating connections with SLF and ILF.
Similar articles
-
A Connectomic Atlas of the Human Cerebrum-Chapter 8: The Posterior Cingulate Cortex, Medial Parietal Lobe, and Parieto-Occipital Sulcus.Oper Neurosurg. 2018 Dec 1;15(suppl_1):S350-S371. doi: 10.1093/ons/opy262. Oper Neurosurg. 2018. PMID: 30260425 Free PMC article.
-
A Connectomic Atlas of the Human Cerebrum-Chapter 16: Tractographic Description of the Vertical Occipital Fasciculus.Oper Neurosurg. 2018 Dec 1;15(suppl_1):S456-S461. doi: 10.1093/ons/opy270. Oper Neurosurg. 2018. PMID: 30260427 Free PMC article.
-
A Connectomic Atlas of the Human Cerebrum-Chapter 6: The Temporal Lobe.Oper Neurosurg. 2018 Dec 1;15(suppl_1):S245-S294. doi: 10.1093/ons/opy260. Oper Neurosurg. 2018. PMID: 30260447 Free PMC article.
-
Imaging connectivity: MRI and the structural networks of the brain.Funct Neurol. 2013 Jul-Sep;28(3):197-203. Funct Neurol. 2013. PMID: 24139656 Free PMC article. Review.
-
The anatomy of the human frontal lobe.Handb Clin Neurol. 2019;163:95-122. doi: 10.1016/B978-0-12-804281-6.00006-9. Handb Clin Neurol. 2019. PMID: 31590750 Review.
Cited by
-
The Changes of Brain Function After Spinal Manipulation Therapy in Patients with Chronic Low Back Pain: A Rest BOLD fMRI Study.Neuropsychiatr Dis Treat. 2022 Feb 5;18:187-199. doi: 10.2147/NDT.S339762. eCollection 2022. Neuropsychiatr Dis Treat. 2022. PMID: 35153482 Free PMC article.
-
Reducing the Cognitive Footprint of Brain Tumor Surgery.Front Neurol. 2021 Aug 16;12:711646. doi: 10.3389/fneur.2021.711646. eCollection 2021. Front Neurol. 2021. PMID: 34484105 Free PMC article. Review.
-
Efferent compared to afferent neural substrates of the vergence eye movement system evoked via fMRI.Front Neurosci. 2025 Jan 8;18:1497326. doi: 10.3389/fnins.2024.1497326. eCollection 2024. Front Neurosci. 2025. PMID: 39844855 Free PMC article.
-
Changes in local brain function in mild cognitive impairment due to semantic dementia.CNS Neurosci Ther. 2021 May;27(5):587-602. doi: 10.1111/cns.13621. Epub 2021 Mar 2. CNS Neurosci Ther. 2021. PMID: 33650764 Free PMC article.
-
Correlation Between Neurocognitive Outcomes and Neuroaxonal Connectome Alterations After Whole Brain Radiotherapy: A Proof-of-Concept Study.Cancers (Basel). 2025 May 23;17(11):1752. doi: 10.3390/cancers17111752. Cancers (Basel). 2025. PMID: 40507233 Free PMC article.
References
-
- Wandell BA, Dumoulin SO, Brewer AA. Visual field maps in human cortex. Neuron. 2007;56(2):366-383. - PubMed
Publication types
MeSH terms
Grants and funding
LinkOut - more resources
Full Text Sources
Other Literature Sources
