

doi: 10.1093/ons/opy259.
A Connectomic Atlas of the Human Cerebrum-Chapter 5: The Insula and Opercular Cortex
Affiliations
- PMID: 30260456
- PMCID: PMC6924540
- DOI: 10.1093/ons/opy259
Item in Clipboard
A Connectomic Atlas of the Human Cerebrum-Chapter 5: The Insula and Opercular Cortex
Oper Neurosurg.
.
Abstract
In this supplement, we build on work previously published under the Human Connectome Project. Specifically, we show a comprehensive anatomic atlas of the human cerebrum demonstrating all 180 distinct regions comprising the cerebral cortex. The location, functional connectivity, and structural connectivity of these regions are outlined, and where possible a discussion is included of the functional significance of these areas. In part 5, we specifically address regions relevant to the insula and opercular cortex.
Figures
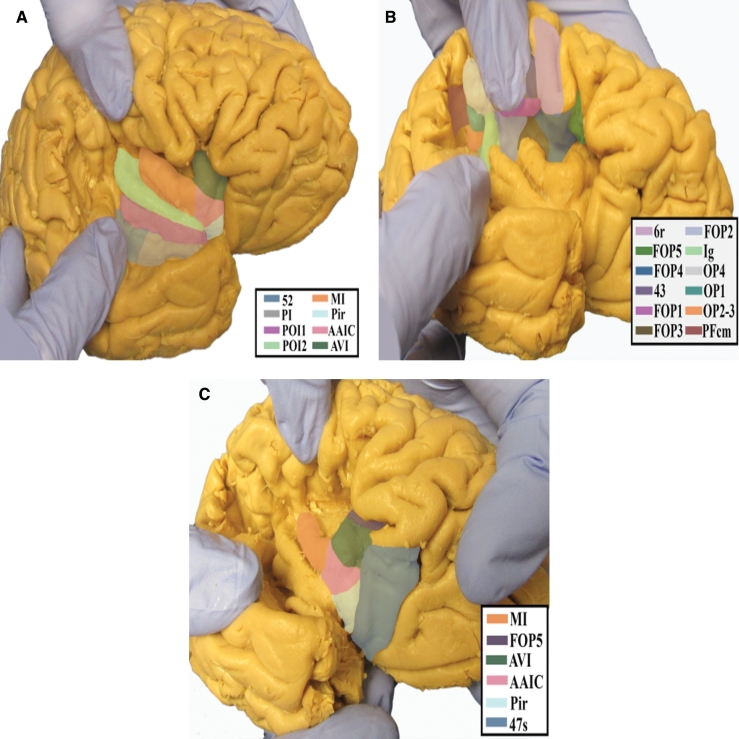
Anatomical location of the anterior apex parcellations of the frontal operculum and insula shown on the right hemisphere of a cadaver brain. A, Lateral view of the posterior insula visualized by widening the lateral sulcus. B, Inferior view of the right hemisphere demonstrating the parietal opercular regions visualized by widening the lateral sulcus. C, Oblique lateral view of the insular apex and frontal operculum visualized by widening the lateral sulcus.
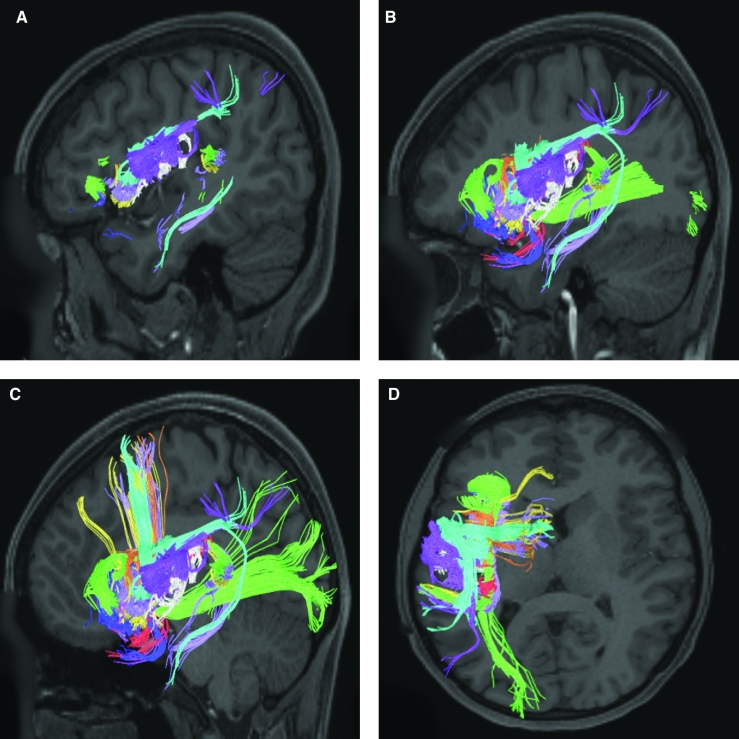
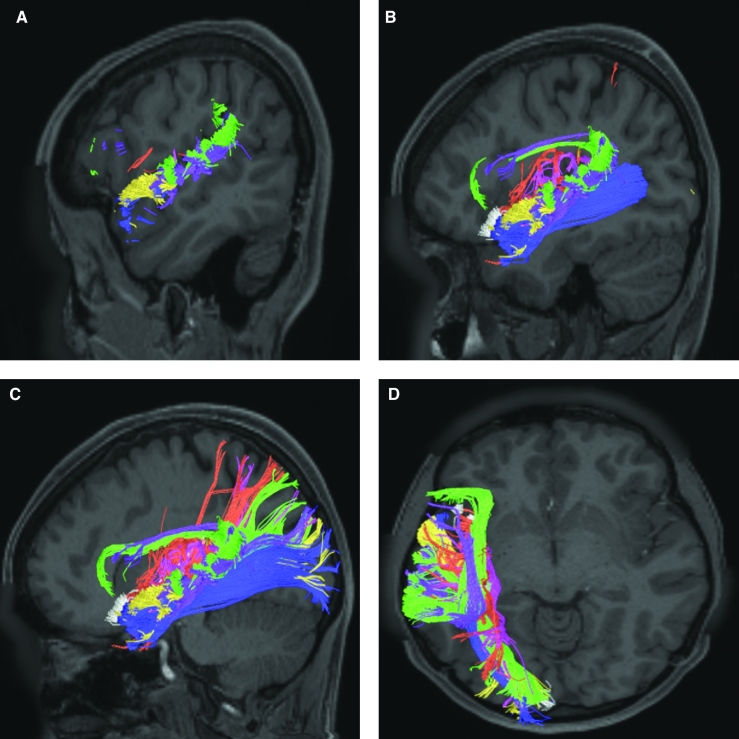
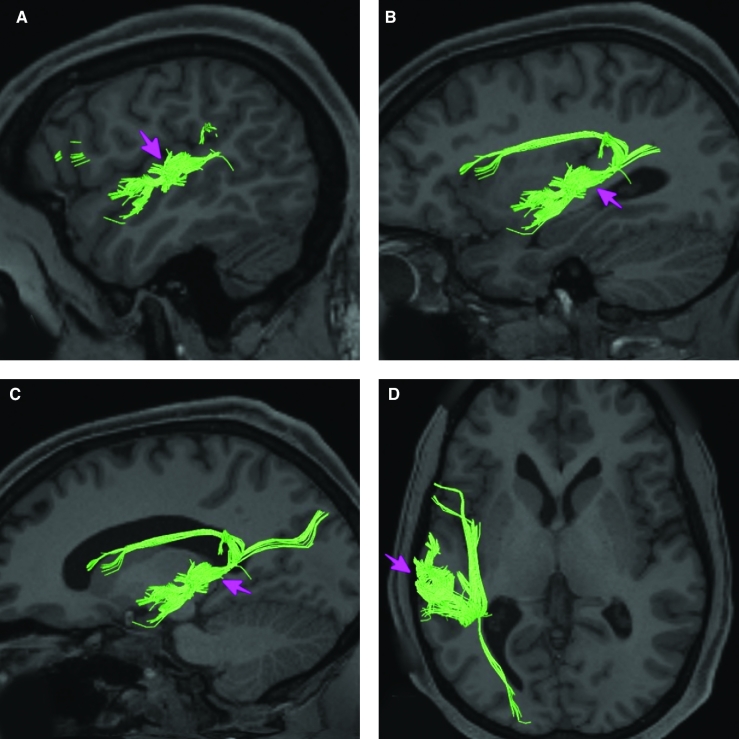
Combined structural connectivity of the anterior apex parcellations in the left hemisphere, shown on T1-weighted MR images. Sagittal views of A, lateral, B, medial, and C, far medial planes. D, Axial view.
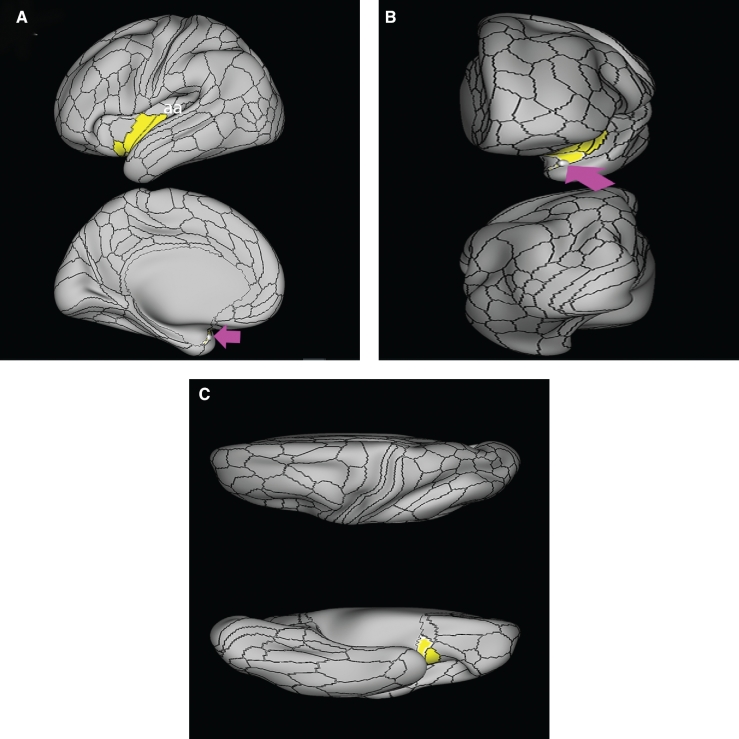
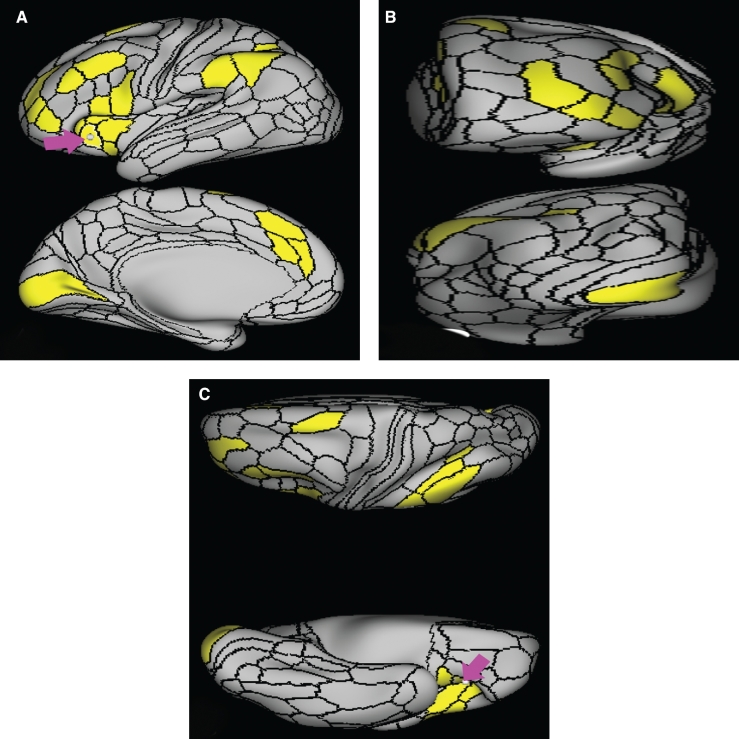
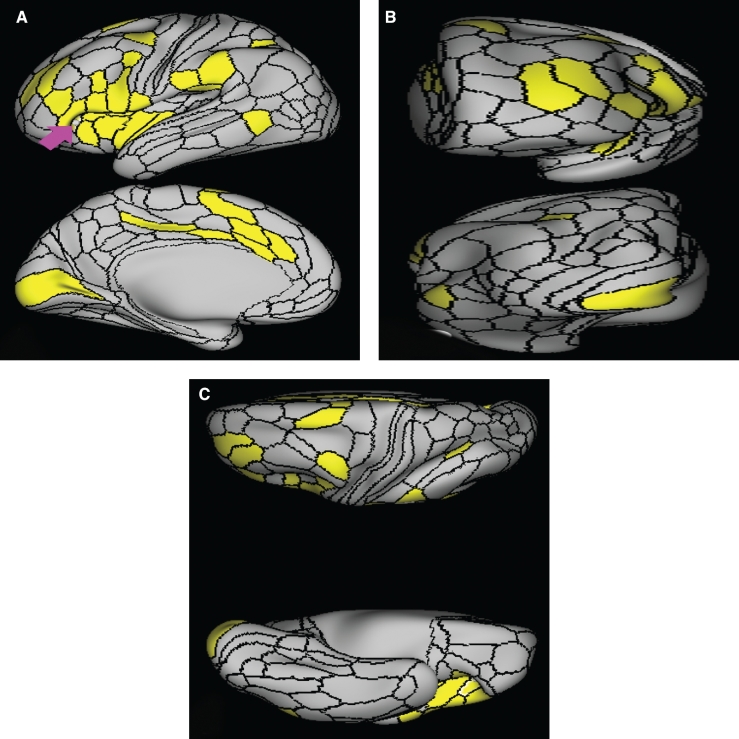
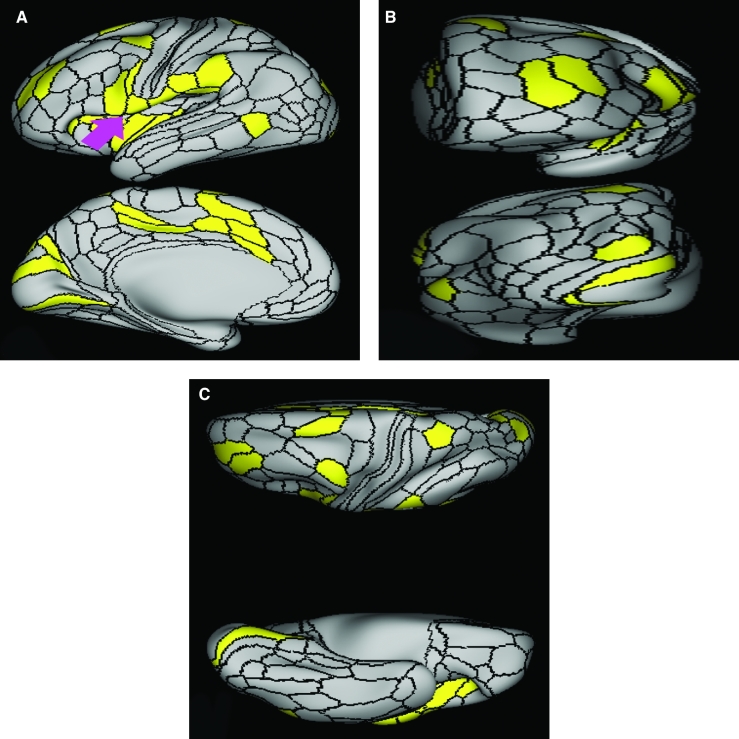
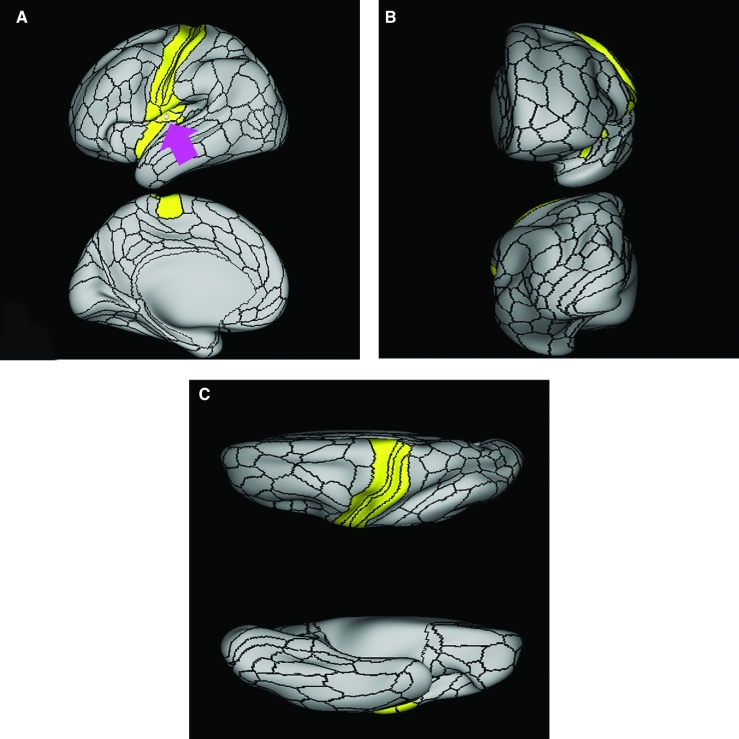
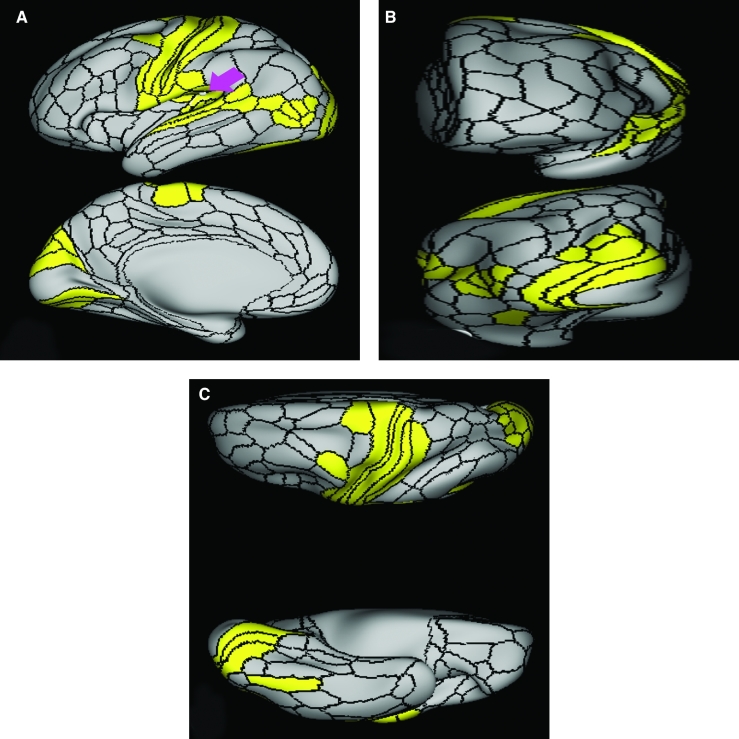
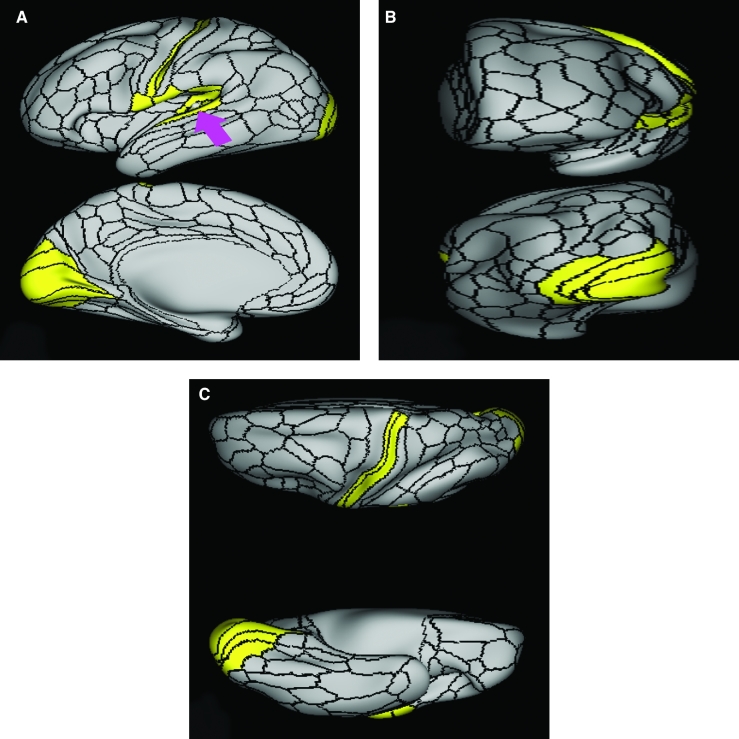
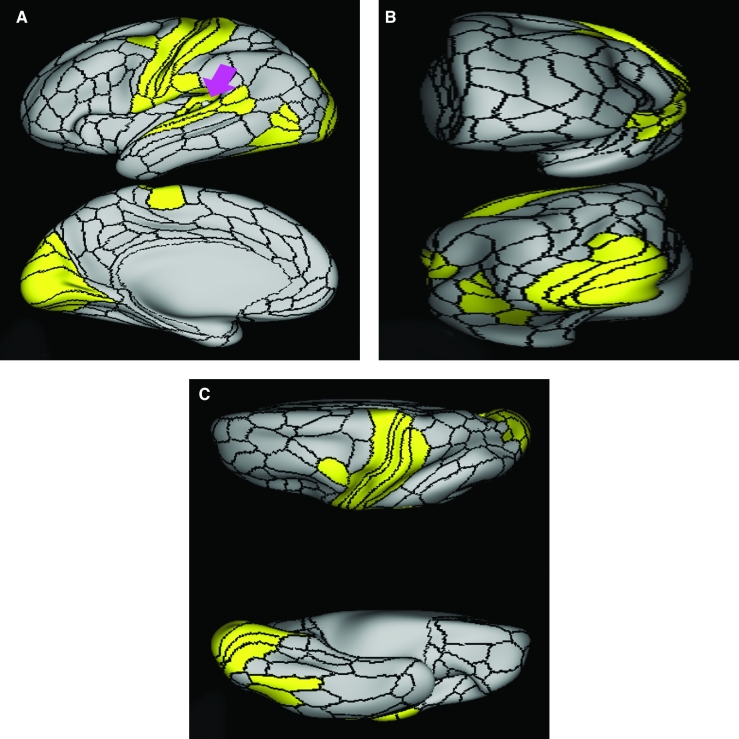
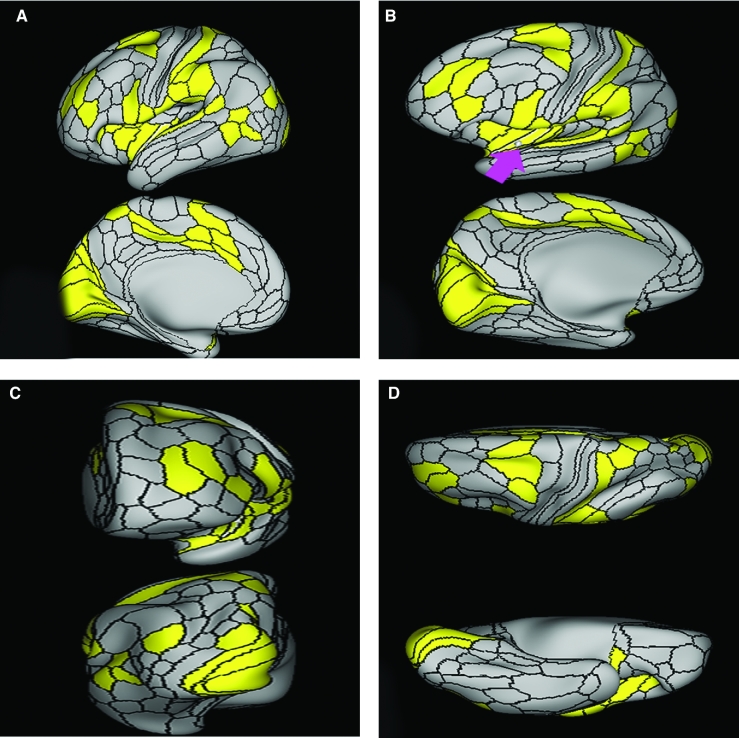
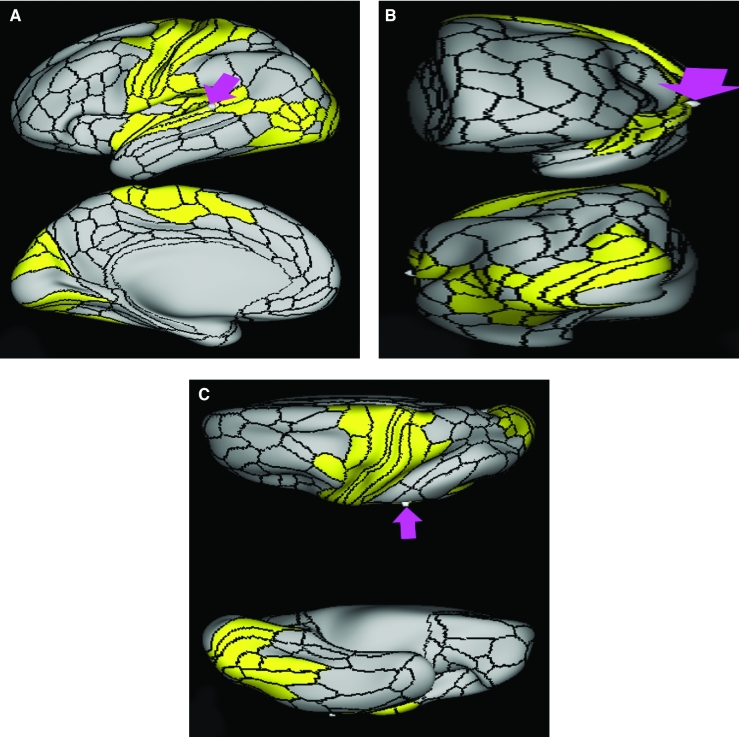
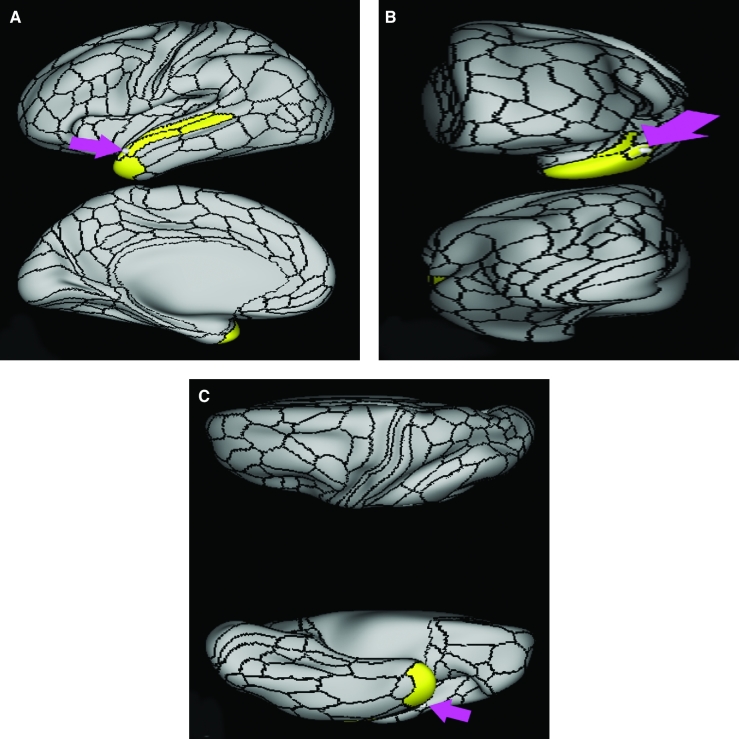
Functional connectivity of Pir demonstrated on an inflated left hemisphere. A, Lateral and medial views. B, Rostral and caudal views. C, Dorsal and ventral views. Parcellations with the strongest functional connectivity are shown in yellow. Pink arrows designate the parcellation of interest.
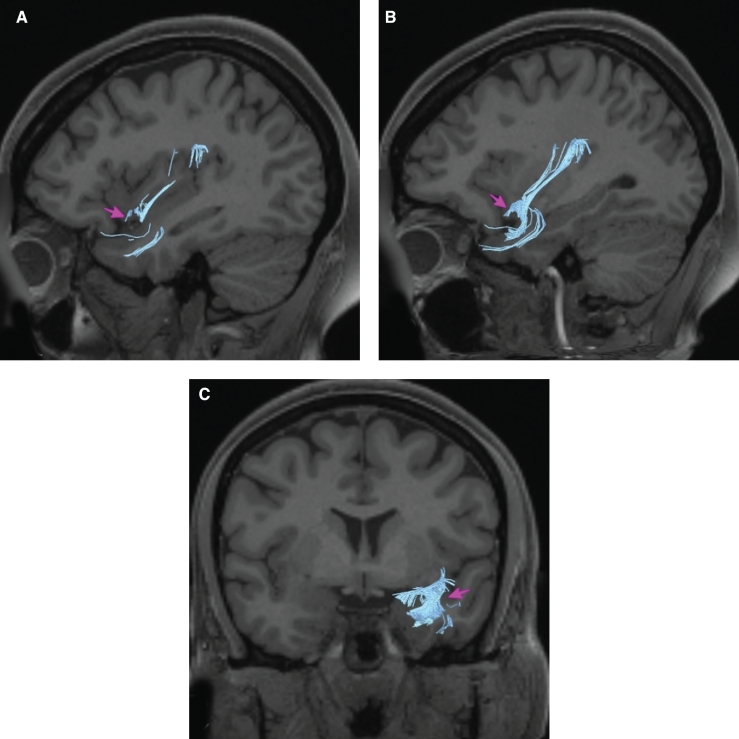
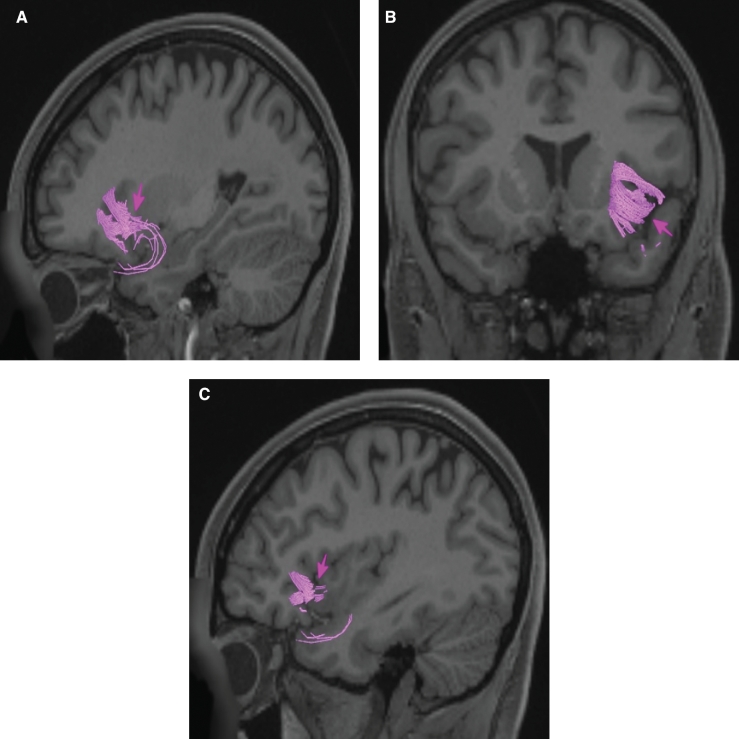
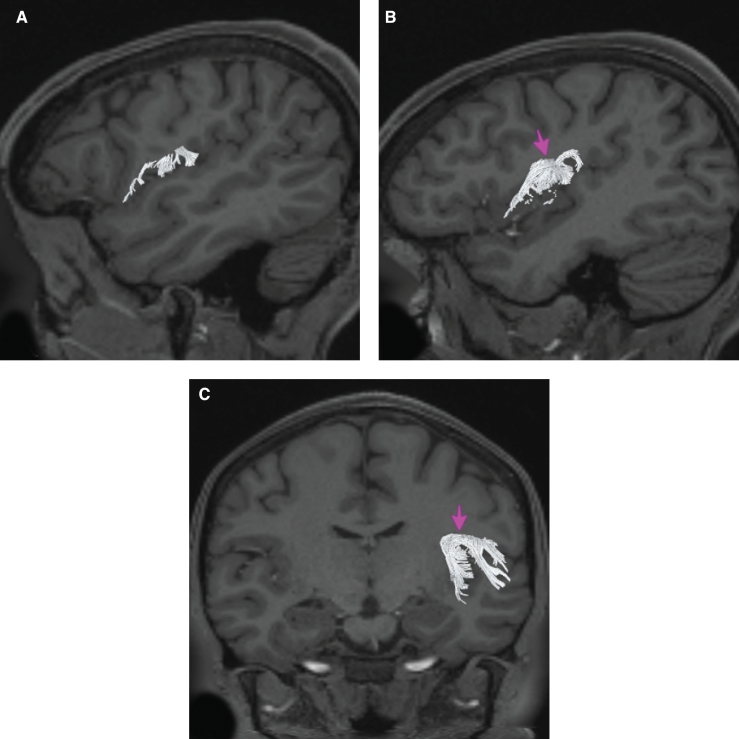
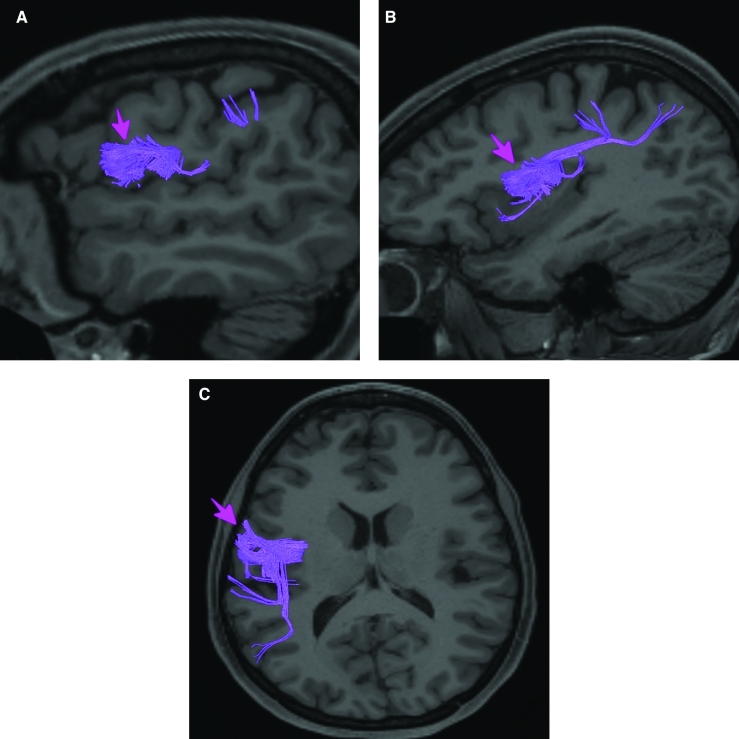
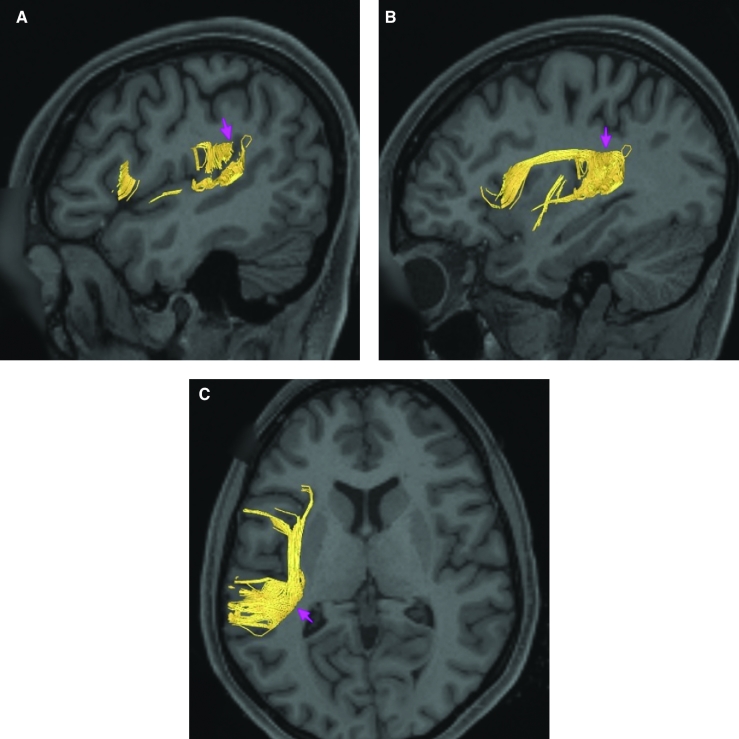
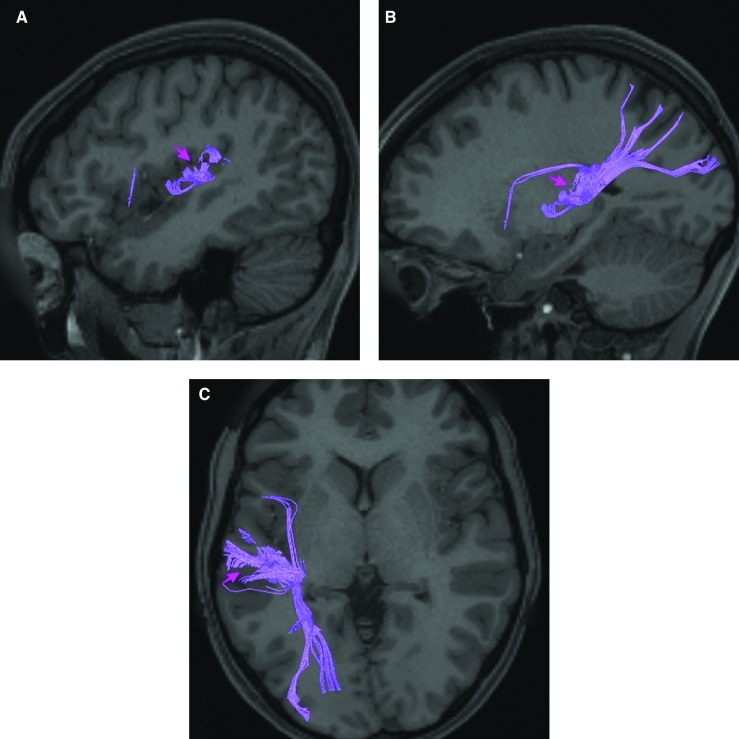
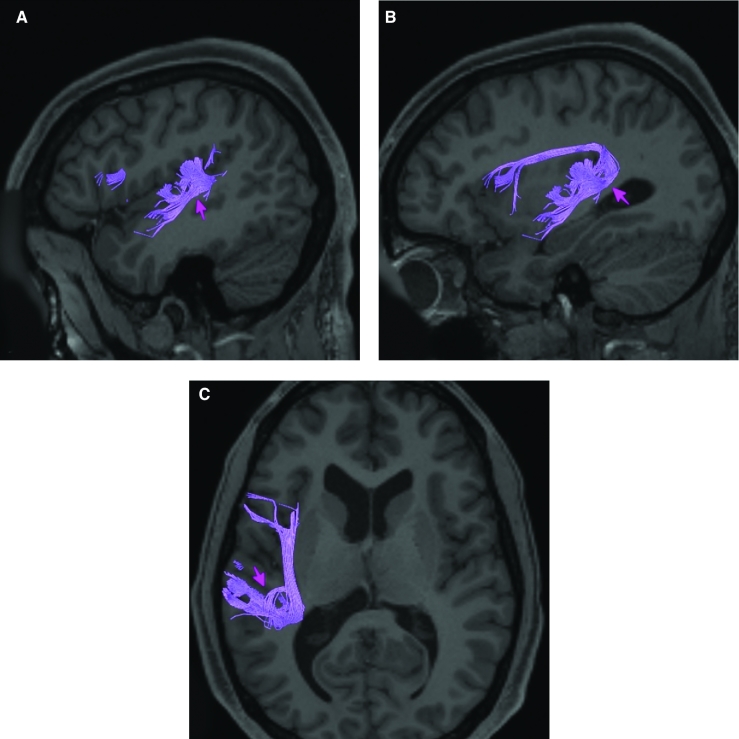
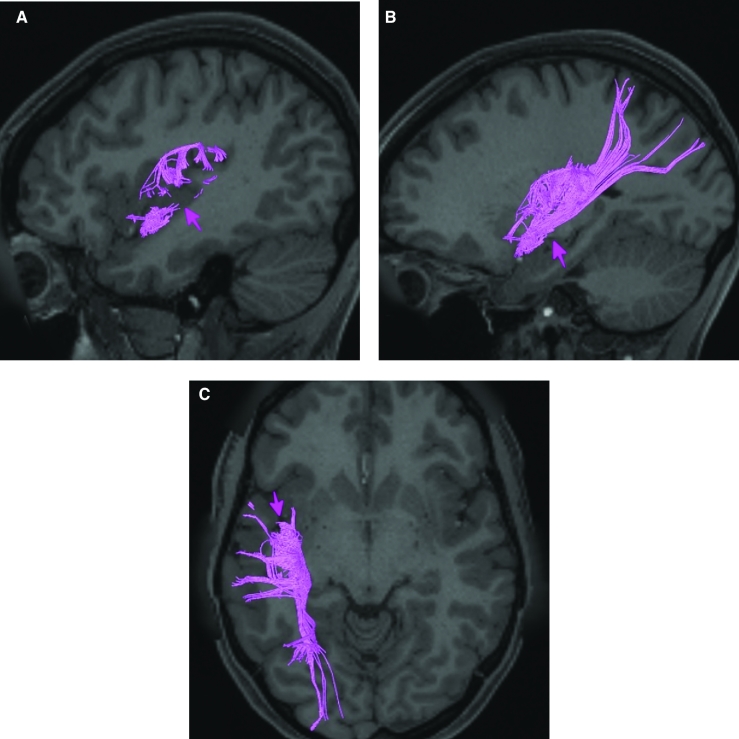
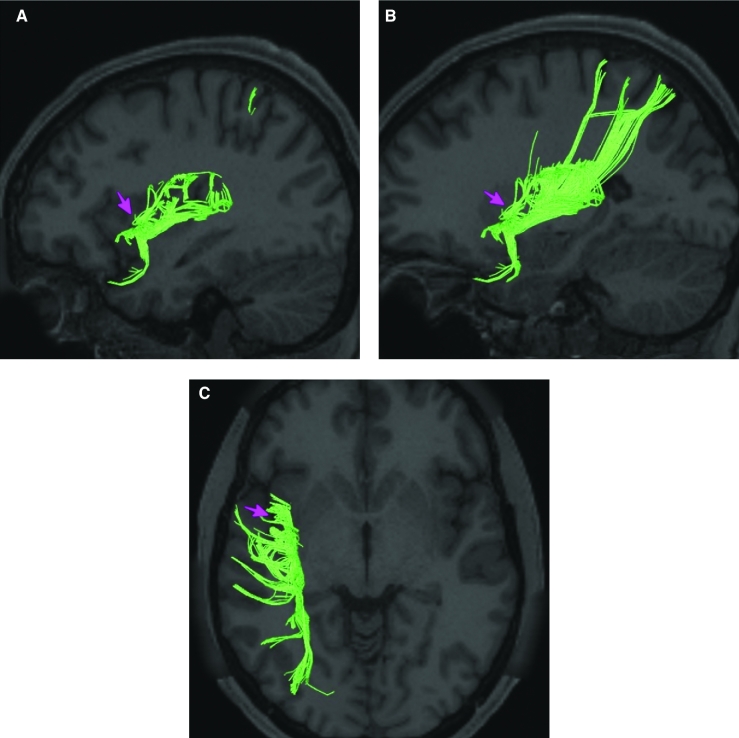
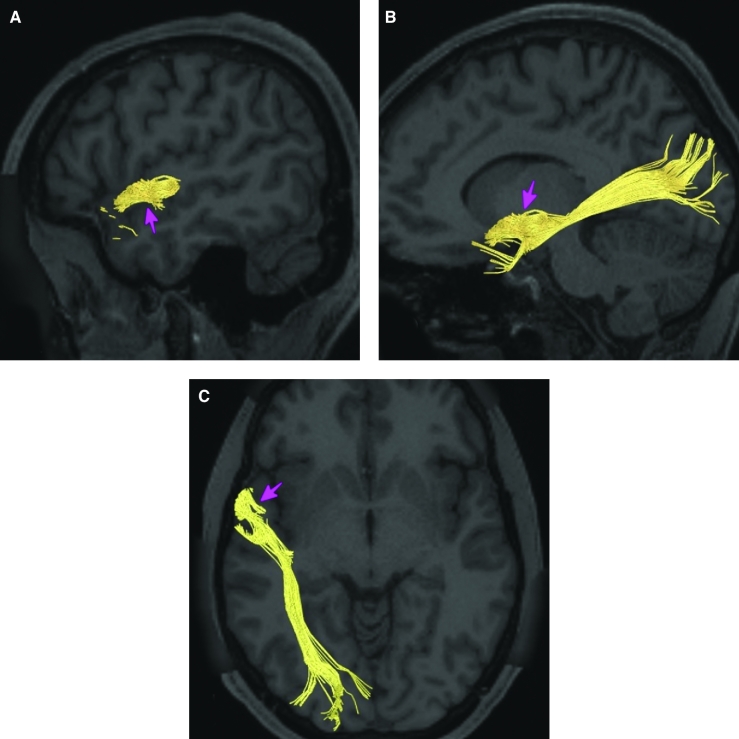
Structural connectivity of Pir in the left hemisphere, shown on T1-weighted MR images. Sagittal views of A, lateral and B, medial planes. C, Coronal view. Light blue: white matter tracts of Pir demonstrating connections with the temporal pole and local parcellations. Pink arrows designate the parcellation of interest.

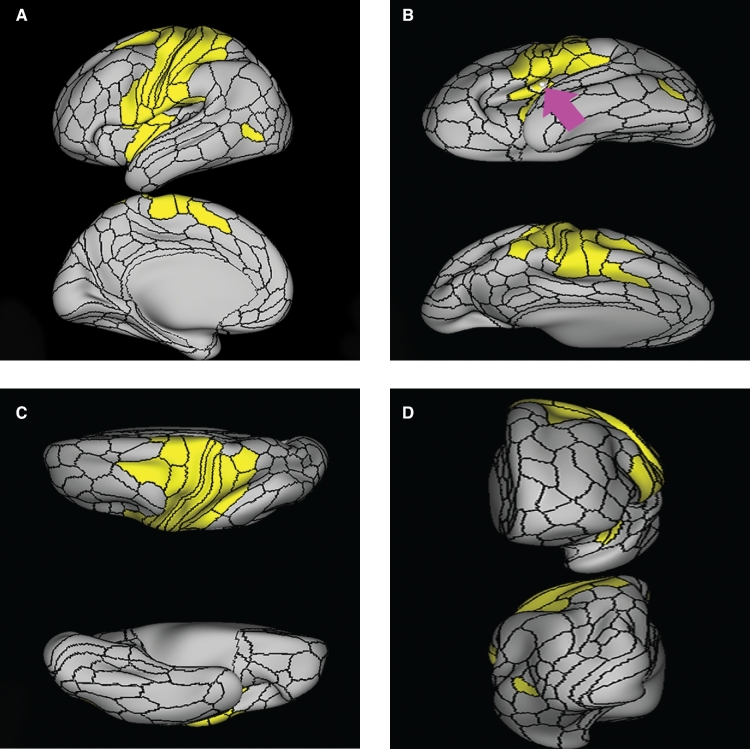
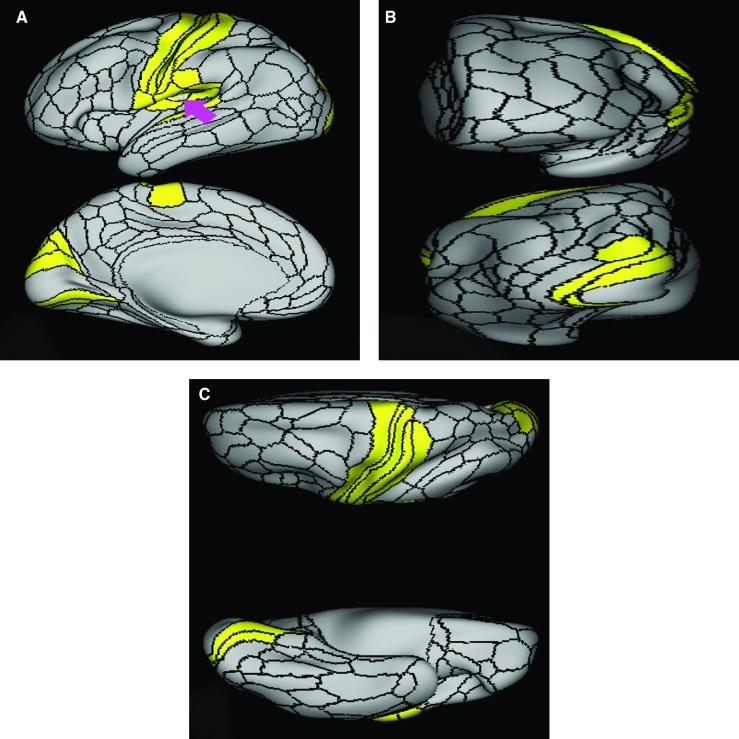
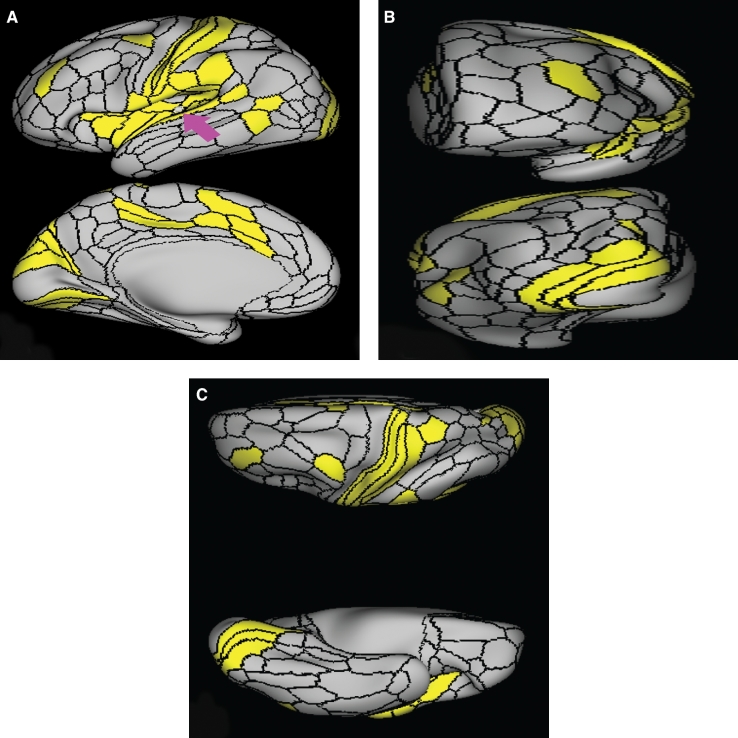
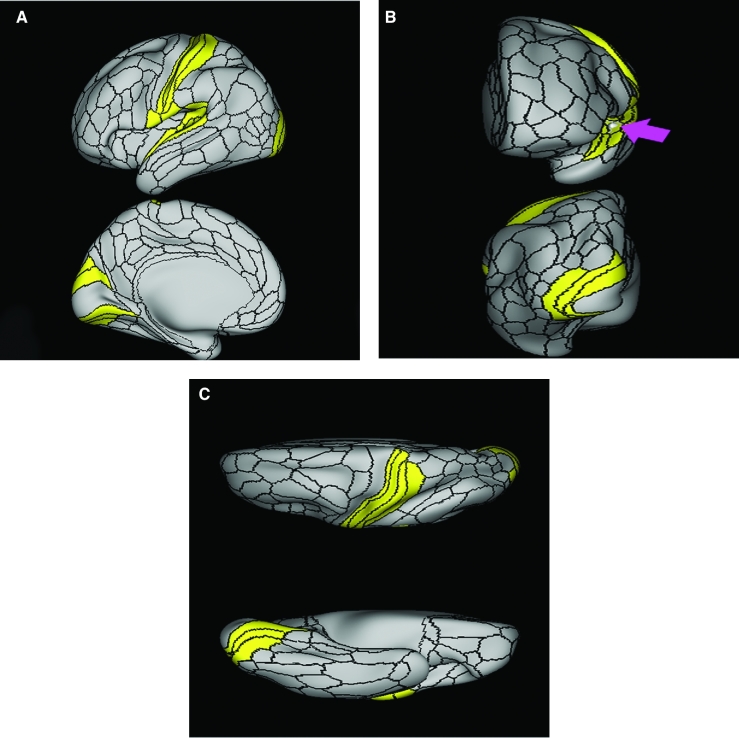
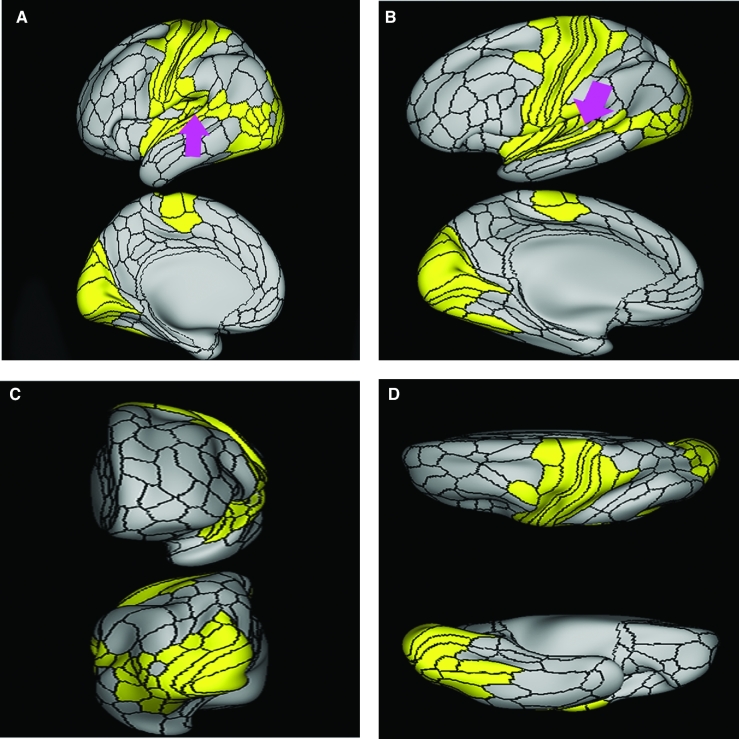
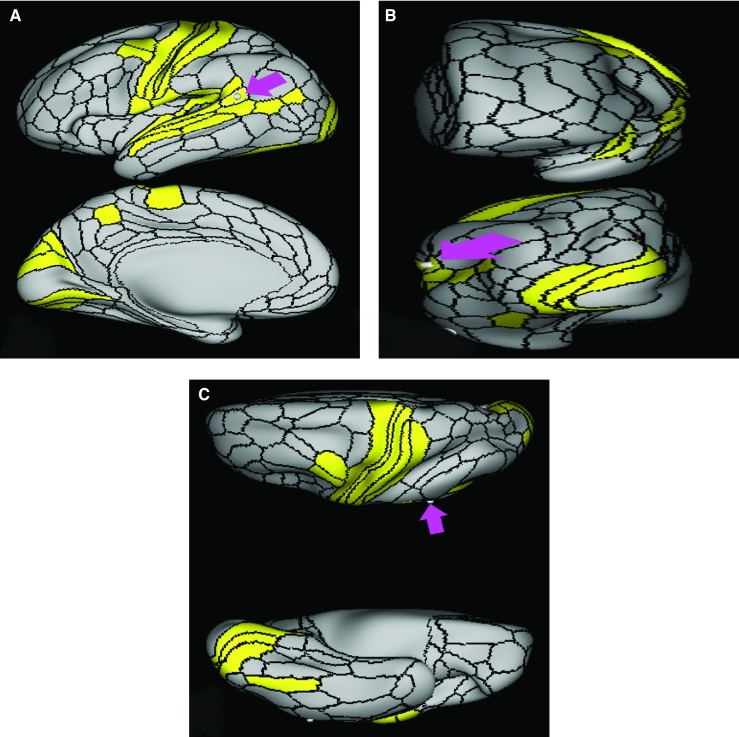
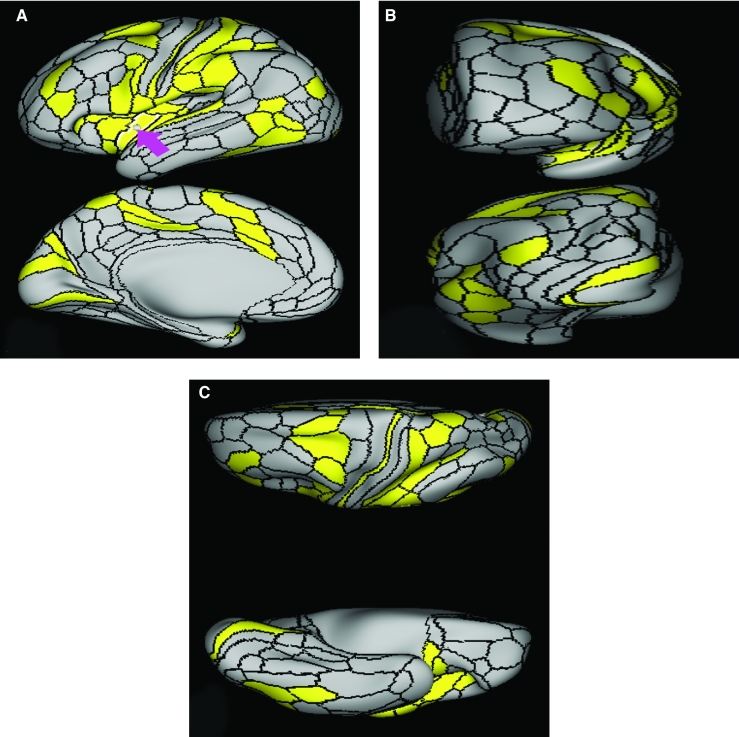
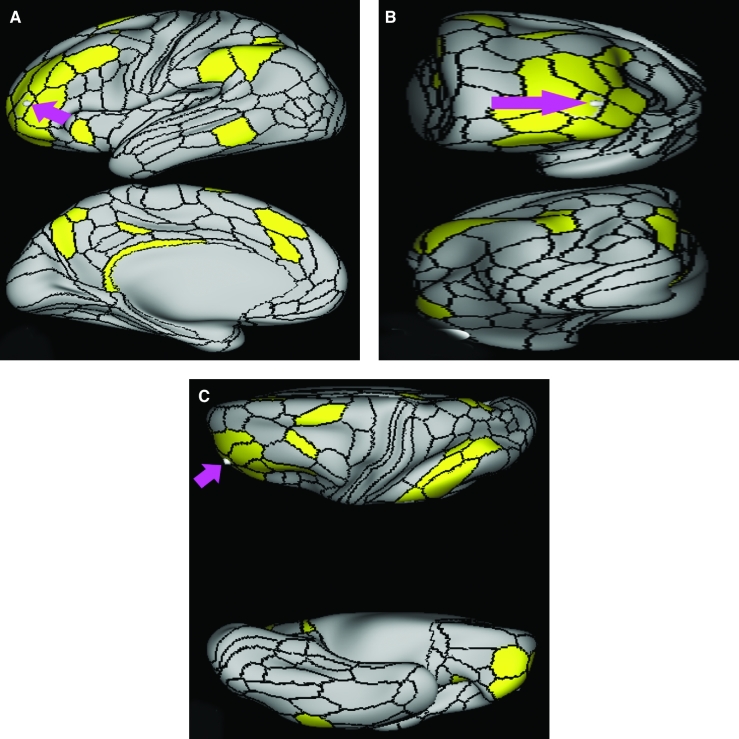
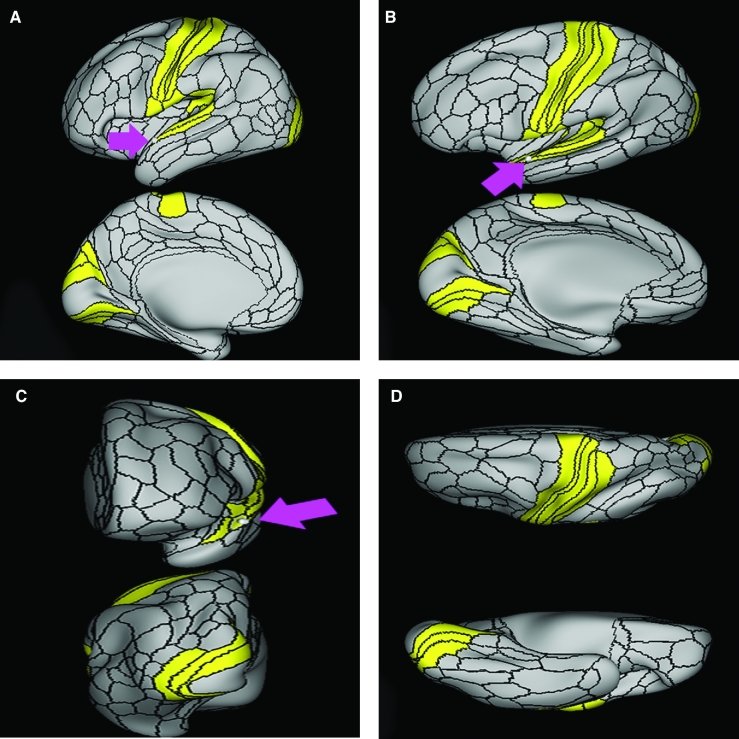
Functional connectivity of AAIC demonstrated on an inflated left hemisphere. A, Lateral and medial views. B, Rostral and caudal views. C, Dorsal and ventral views. Parcellations with the strongest functional connectivity are shown in yellow. Pink arrows designate the parcellation of interest.
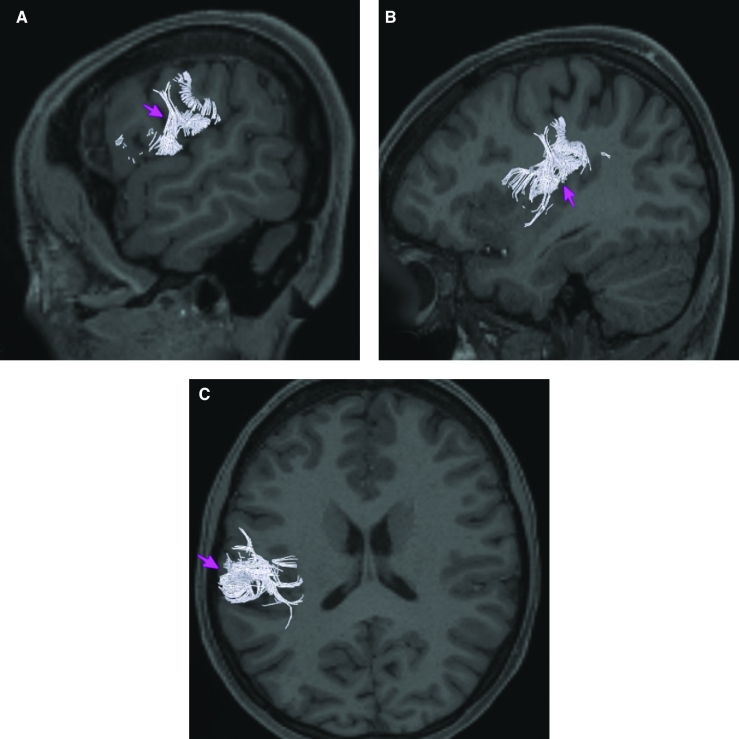
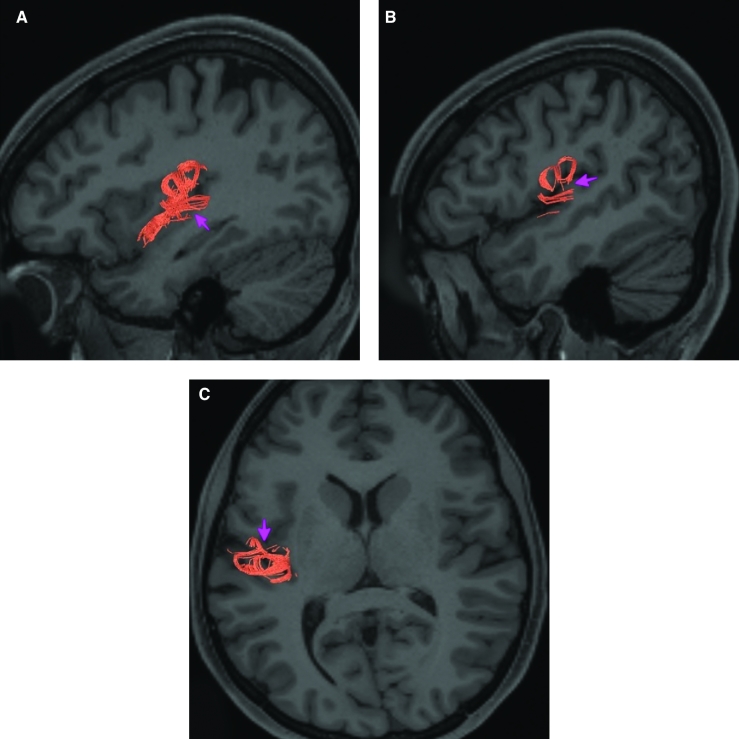
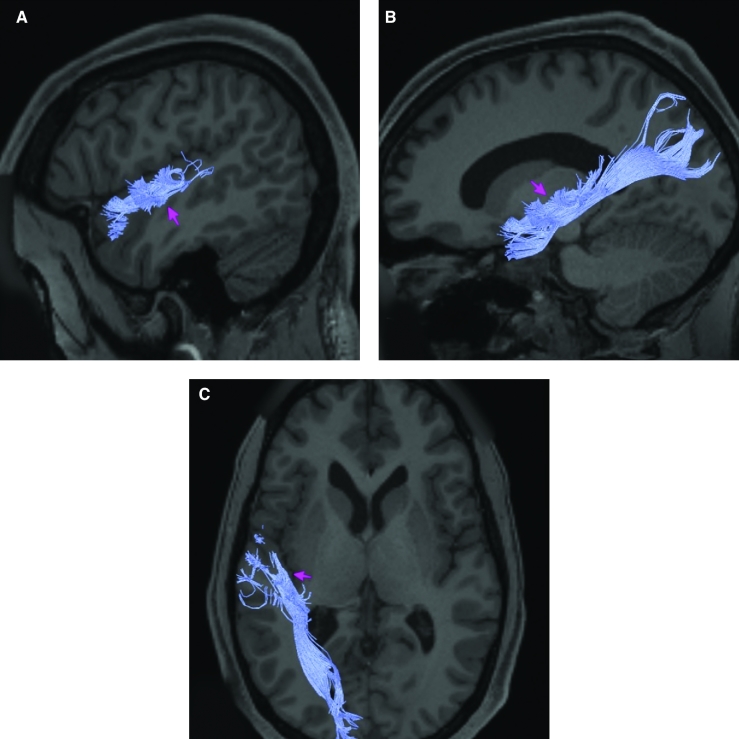
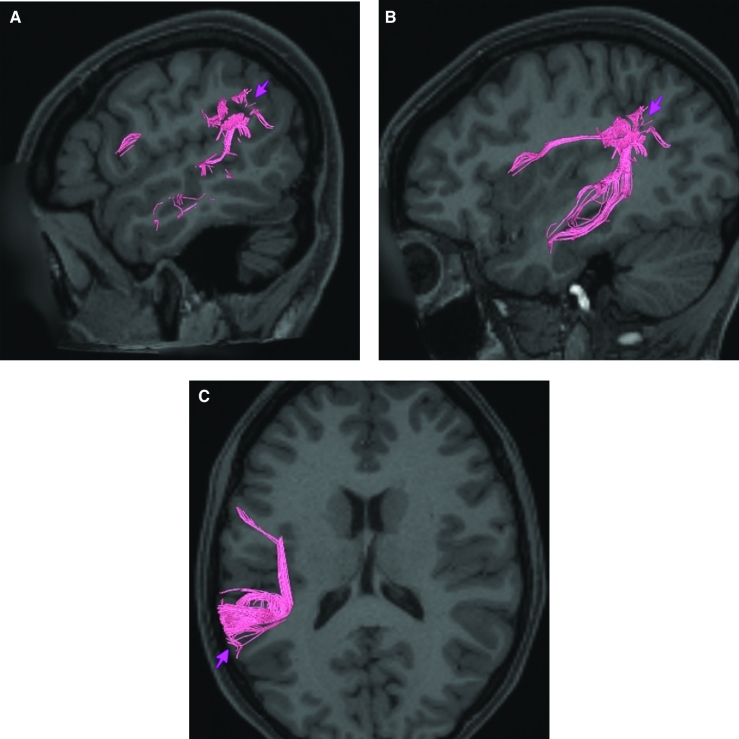
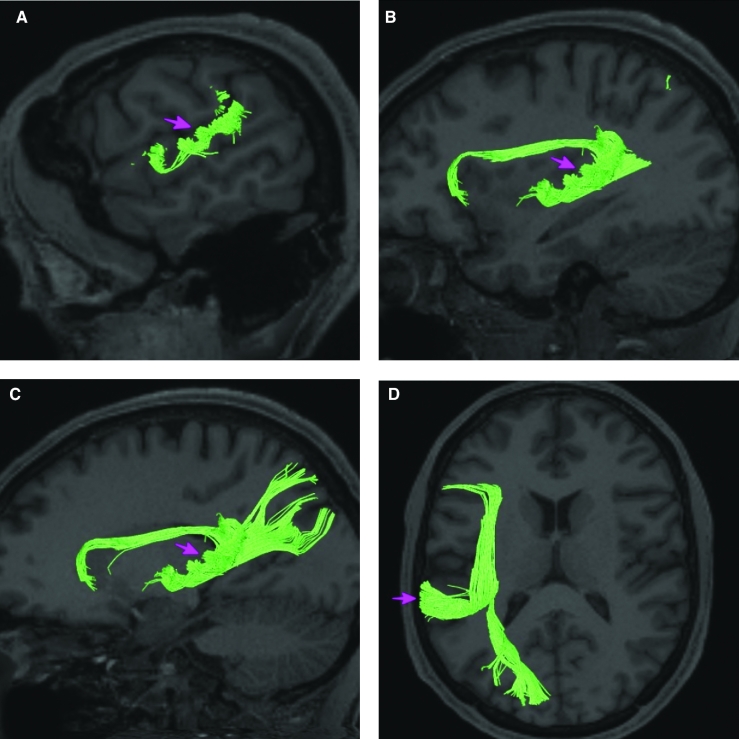
Structural connectivity of AAIC in the left hemisphere, shown on T1-weighted MR images. Sagittal views of A, medial and C, lateral planes. B, Coronal view. Pink: white matter tracts of AAIC demonstrating connections with local parcellations. Pink arrows designate the parcellation of interest.
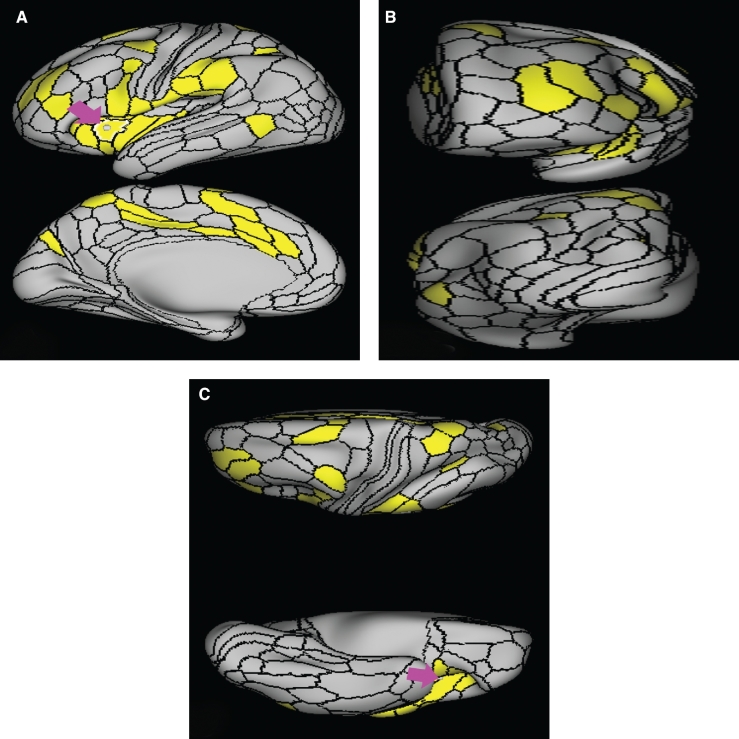
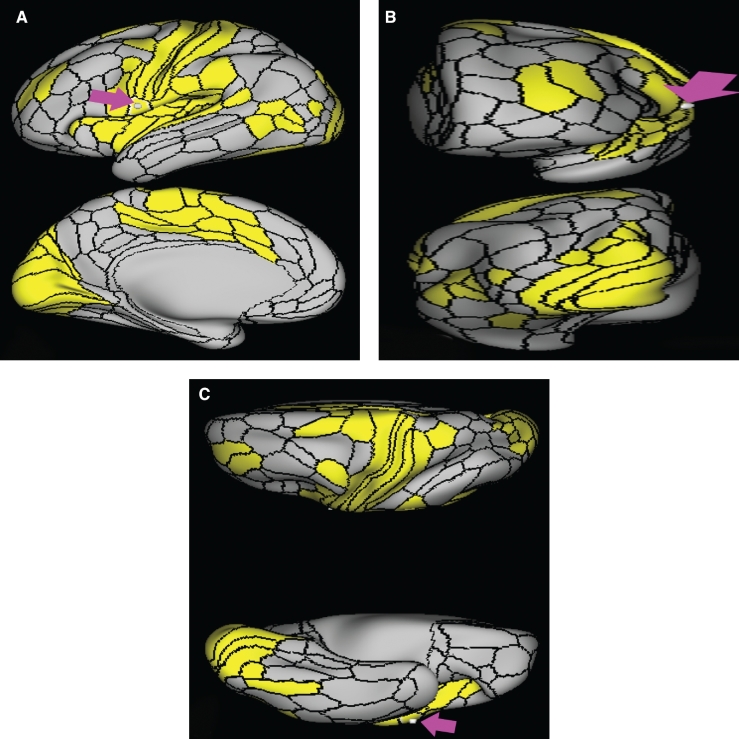
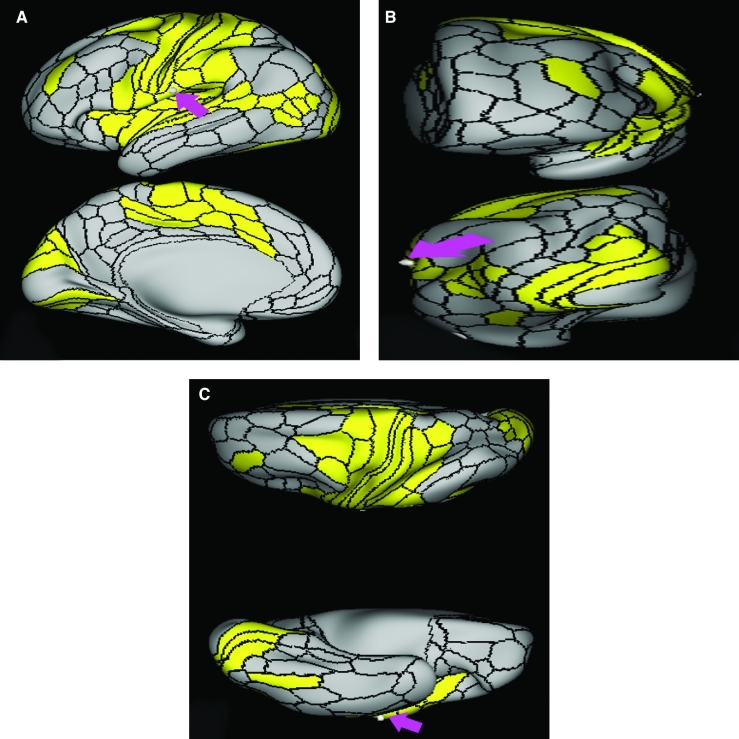
Functional connectivity of AVI demonstrated on an inflated left hemisphere. A, Lateral and medial views. B, Rostral and caudal views. C, Dorsal and ventral views. Parcellations with the strongest functional connectivity are shown in yellow. Pink arrows designate the parcellation of interest.
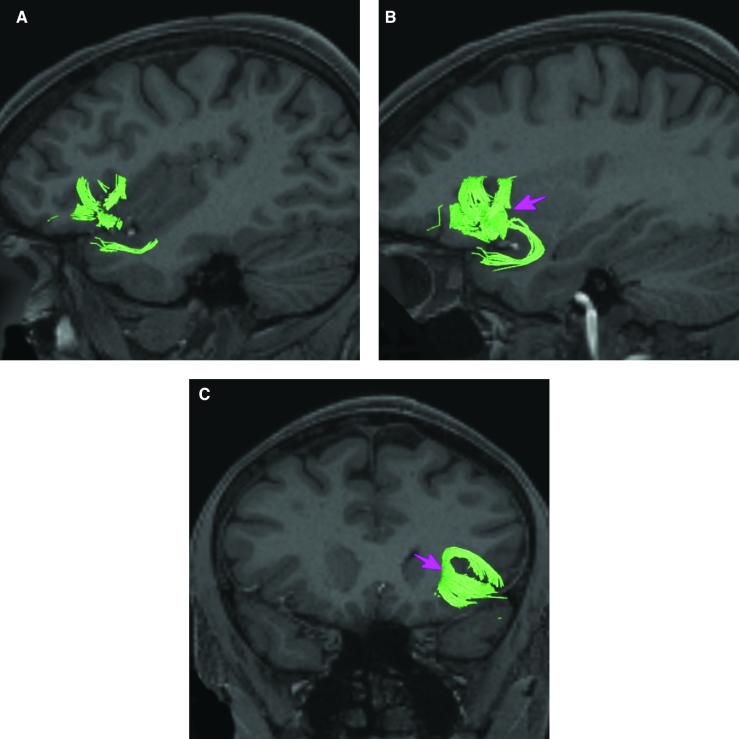
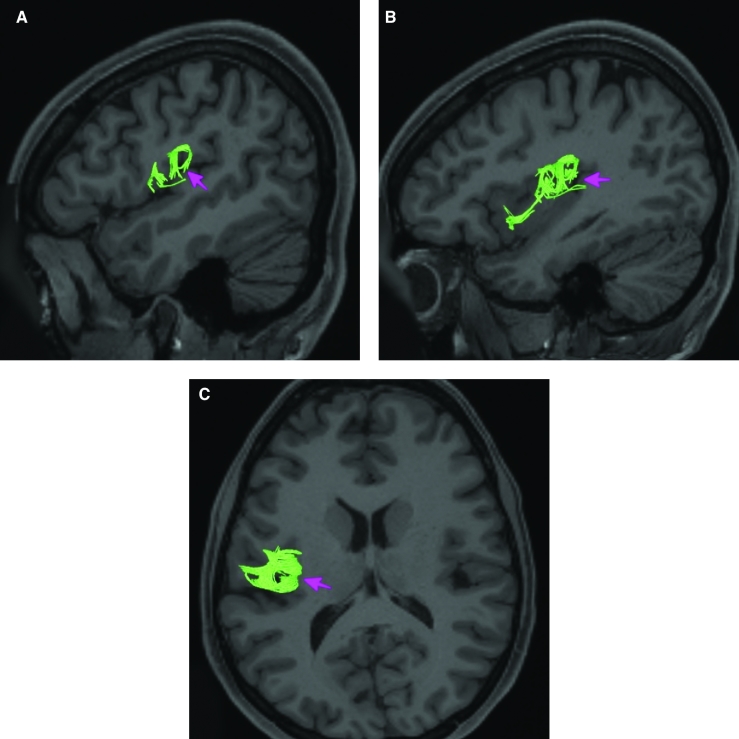
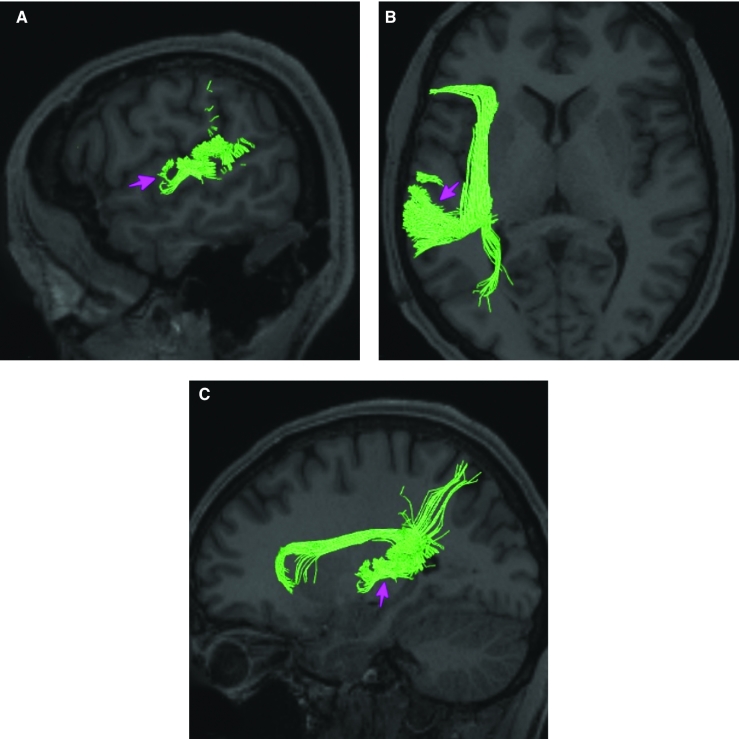
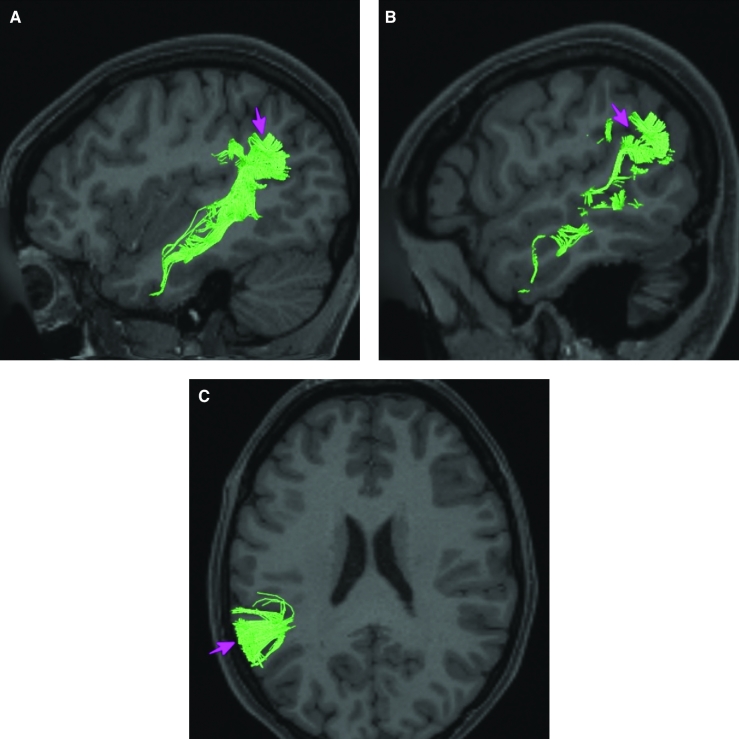
Structural connectivity of AVI in the left hemisphere, shown on T1-weighted MR images. Sagittal views of A, lateral and B, medial planes. C, Coronal view. Green: white matter tracts of AVI demonstrating connections with local parcellations. Pink arrows designate the parcellation of interest.
Functional connectivity of MI demonstrated on an inflated left hemisphere. A, Lateral and medial views. B, Rostral and caudal views. C, Dorsal and ventral views. Parcellations with the strongest functional connectivity are shown in yellow. Pink arrows designate the parcellation of interest.
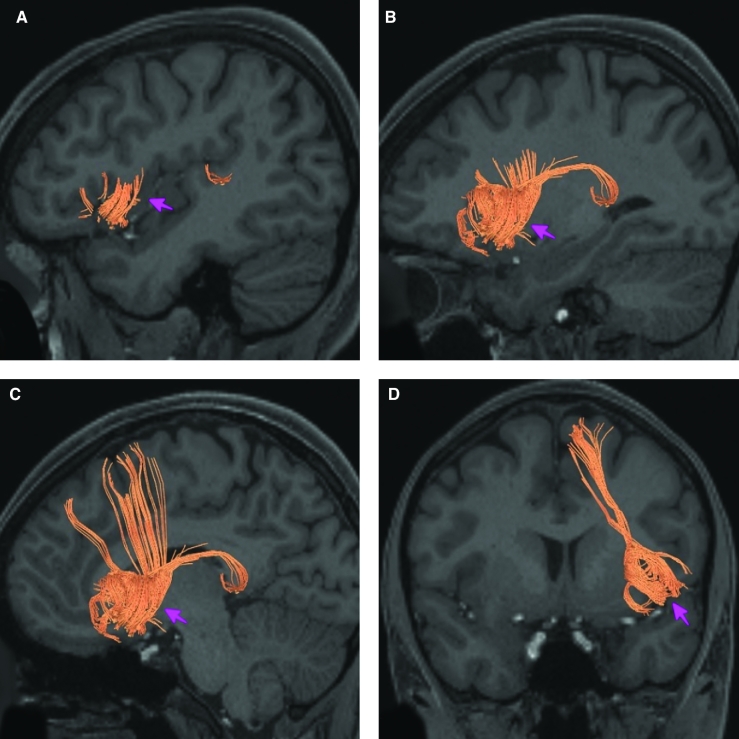
Structural connectivity of MI in the left hemisphere, shown on T1-weighted MR images. Sagittal views of A, lateral, B, medial, and C, far medial planes. D, Coronal view. Orange: white matter tracts of MI demonstrating connections with the arcuate/SFL, frontal aslant tract, and local parcellations. Pink arrows designate the parcellation of interest.
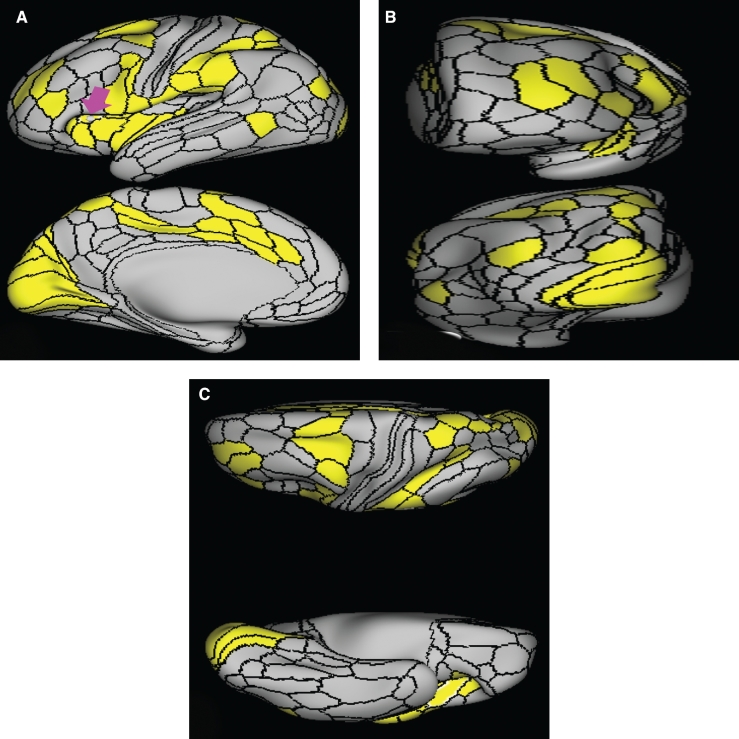
Functional connectivity of FOP5 demonstrated on an inflated left hemisphere. A, Lateral and medial views. B, Rostral and caudal views. C, Dorsal and ventral views. Parcellations with the strongest functional connectivity are shown in yellow. Pink arrows designate the parcellation of interest.
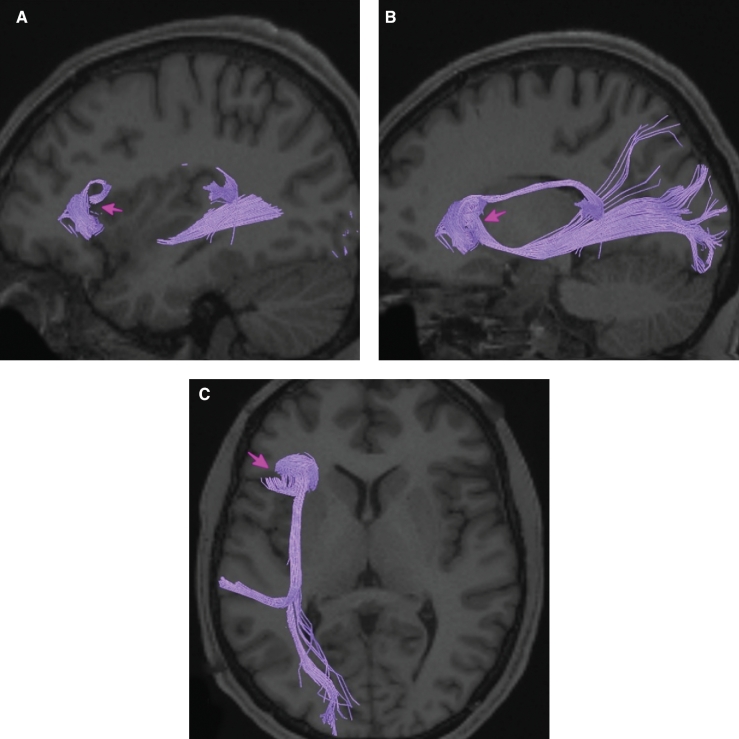
Structural connectivity of FOP5 in the left hemisphere, shown on T1-weighted MR images. Sagittal views of A, lateral and B, medial planes. C, Axial view. Purple: white matter tracts of FOP5 demonstrating connections with the IFOF and the arcuate/SFL. Pink arrows designate the parcellation of interest.
Functional connectivity of FOP4 demonstrated on an inflated left hemisphere. A, Lateral and medial views. B, Rostral and caudal views. C, Dorsal and ventral views. Parcellations with the strongest functional connectivity are shown in yellow. Pink arrows designate the parcellation of interest.

Structural connectivity of FOP4 in the left hemisphere, shown on T1-weighted MR images. Sagittal views of A, lateral, B, medial, and C, far medial planes. D, Coronal view. Light blue: white matter tracts of FOP4 demonstrating connections with the frontal aslant tract and the arcuate/SFL. Pink arrows designate the parcellation of interest.
Functional connectivity of FOP3 demonstrated on an inflated left hemisphere. A, Lateral and medial views. B, Rostral and caudal views. C, Dorsal and ventral views. Parcellations with the strongest functional connectivity are shown in yellow. Pink arrows designate the parcellation of interest.

Structural connectivity of FOP3 in the left hemisphere, shown on T1-weighted MR images. Sagittal views of A, lateral and B, medial planes. C, Coronal view. Orange: white matter tracts of FOP3 demonstrating connections with the frontal aslant track and local parcellations. Pink arrows designate the parcellation of interest.
Functional connectivity of FOP2 demonstrated on an inflated left hemisphere. A, Lateral and medial views. B, Oblique views demonstrating the operculum. C, Dorsal and ventral views. D, Rostral and caudal views. Parcellations with the strongest functional connectivity are shown in yellow. Pink arrows designate the parcellation of interest.
Structural connectivity of FOP2 in the left hemisphere, shown on T1-weighted MR images. Sagittal views of A, lateral and B, medial planes. C, Coronal view. White: white matter tracts of FOP2 demonstrating connections with local parcellations. Pink arrows designate the parcellation of interest.

Functional connectivity of FOP1 demonstrated on an inflated left hemisphere. A, Lateral and medial views. B, Oblique views demonstrating the operculum. C, Dorsal and ventral views. D, Rostral and caudal views. Parcellations with the strongest functional connectivity are shown in yellow. Pink arrows designate the parcellation of interest.

Structural connectivity of FOP1 in the left hemisphere, shown on T1-weighted MR images. Sagittal views of A, lateral, B, medial, and C, far medial planes. D, Coronal view. Purple: white matter tracts of FOP1 demonstrating connections with portions of the frontal aslant tract, and the arcuate/SFL. Pink arrows designate the parcellation of interest.
Functional connectivity of 43 demonstrated on an inflated left hemisphere. A, Lateral and medial views. B, Rostral and caudal views. C, Dorsal and ventral views. Parcellations with the strongest functional connectivity are shown in yellow. Pink arrows designate the parcellation of interest.
Structural connectivity of 43 in the left hemisphere, shown on T1-weighted MR images. Sagittal views of A, lateral and B, medial planes. C, Axial view. Purple: white matter tracts of 43 demonstrating connections with the superior parietal lobe and local parcellations. Pink arrows designate the parcellation of interest.
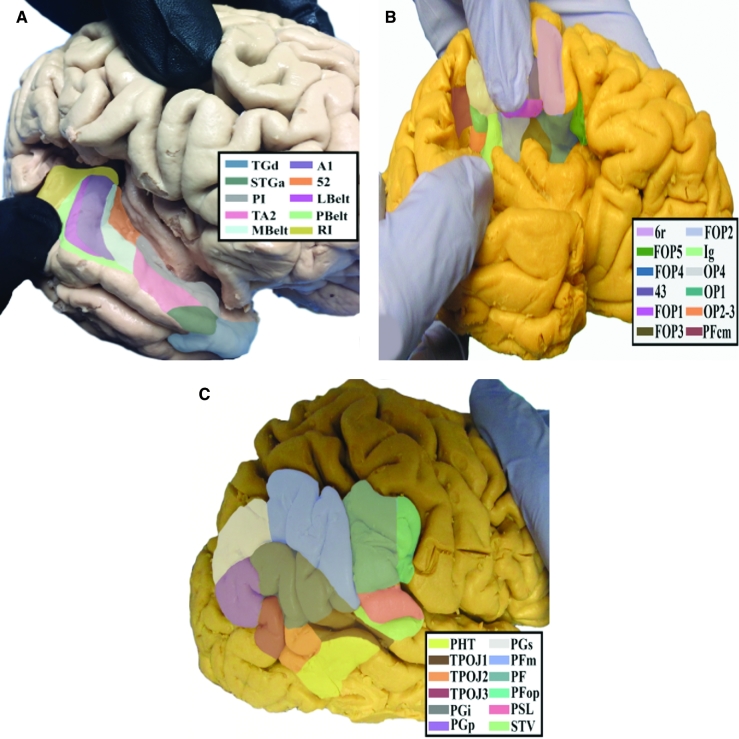
Anatomical location of parietal apex parcellations shown on the left hemisphere of a cadaver brain. A, Oblique view with a widening of Heschel's gyrus to show extensions of parcellations. B, Inferolateral view of parietal opercular regions. C, Lateral view of the parcellation comprising the inferior parietal lobule.
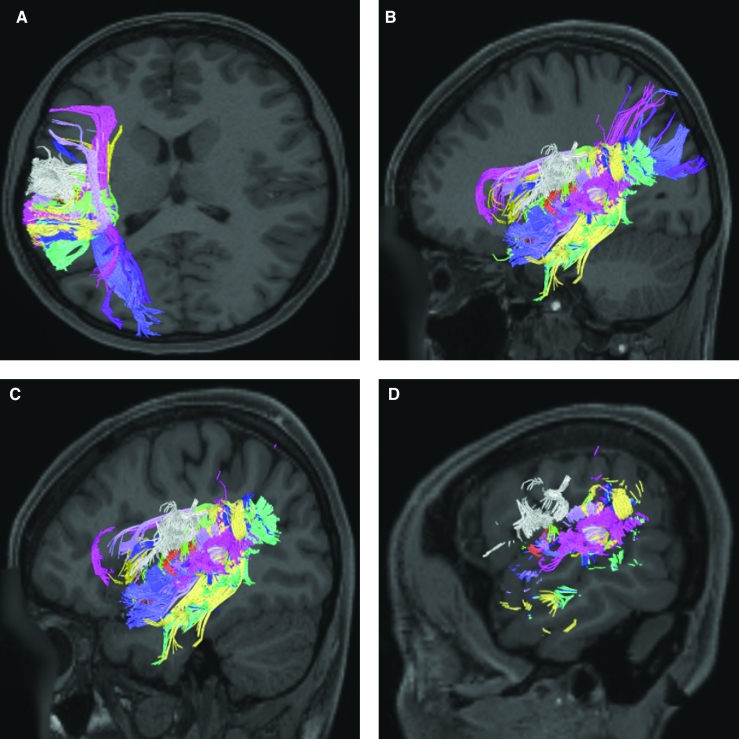
Combined structural connectivity of the parietal apex parcellations in the left hemisphere, shown on T1-weighted MR images. A, Axial view. Sagittal views of B, medial, C, lateral, and D, far lateral planes.
Functional connectivity of Ig demonstrated on an inflated left hemisphere. A, Lateral and medial views. B, Rostral and caudal views. C, Dorsal and ventral views. Parcellations with the strongest functional connectivity are shown in yellow. Pink arrows designate the parcellation of interest.
Structural connectivity of Ig in the left hemisphere, shown on T1-weighted MR images. Sagittal views of A, lateral and B, medial planes. C, Axial view. Green: white matter tracts of Ig demonstrating connections with local parcellations and MI. Pink arrows designate the parcellation of interest.
Functional connectivity of OP4 demonstrated on an inflated left hemisphere. A, Lateral and medial views. B, Rostral and caudal views. C, Dorsal and ventral views. Parcellations with the strongest functional connectivity are shown in yellow. Pink arrows designate the parcellation of interest.
Structural connectivity of OP4 in the left hemisphere, shown on T1-weighted MR images. Sagittal views of A, lateral and B, medial planes. C, Axial view. White: white matter tracts of OP4 demonstrating connections with local parcellations. Pink arrows designate the parcellation of interest.
Functional connectivity of OP2-3 demonstrated on an inflated left hemisphere. A, Lateral and medial views. B, Rostral and caudal views. C, Dorsal and ventral views. Parcellations with the strongest functional connectivity are shown in yellow. Pink arrows designate the parcellation of interest.
Structural connectivity of OP2-3 in the left hemisphere, shown on T1-weighted MR images. Sagittal views of A, lateral and B, medial planes. C, Axial view. Orange: white matter tracts of OP2 demonstrating connections with the anterior insula areas and local parcellations. Pink arrows designate the parcellation of interest.

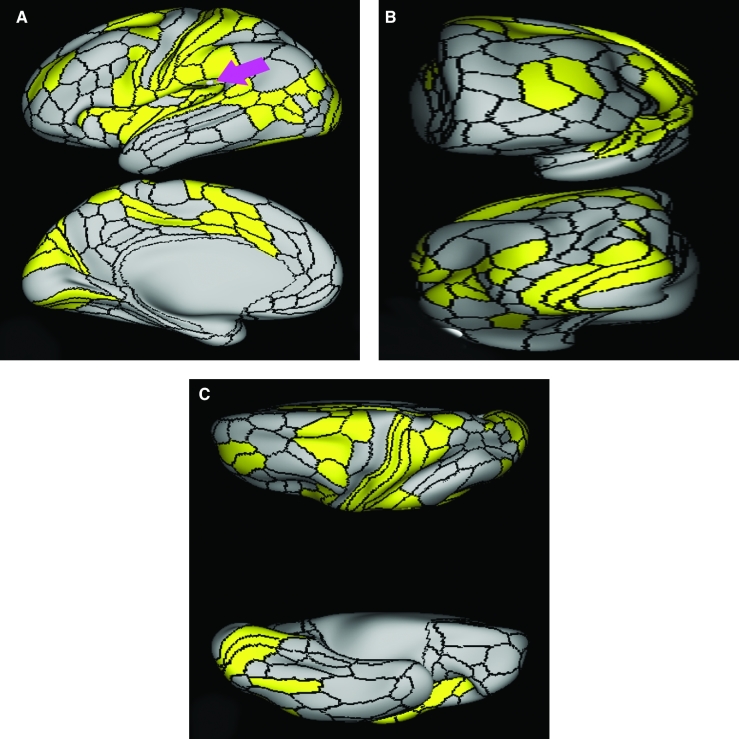
Functional connectivity of OP1 demonstrated on an inflated left hemisphere. A, Lateral and medial views. B, Rostral and caudal views. C, Dorsal and ventral views. Parcellations with the strongest functional connectivity are shown in yellow. Pink arrows designate the parcellation of interest.
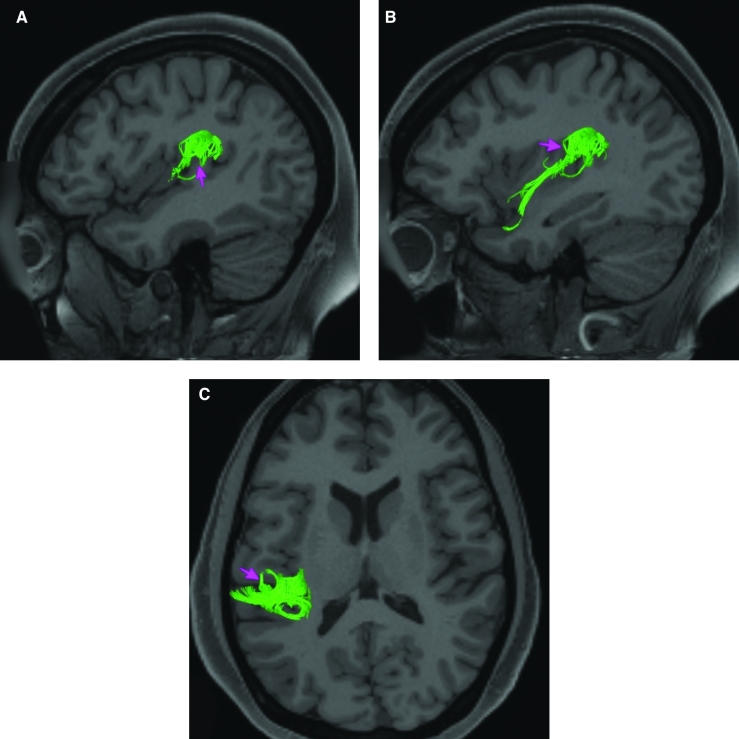
Structural connectivity of OP1 in the left hemisphere, shown on T1-weighted MR images. Sagittal views of A, lateral and B, medial planes. C, Axial view. Green: white matter tracts of OP1 demonstrating connections with local parcellations, the anterior insula, and the temporal pole. Pink arrows designate the parcellation of interest.
Functional connectivity of PFcm demonstrated on an inflated left hemisphere. A, Lateral and medial views. B, Rostral and caudal views. C, Dorsal and ventral views. Parcellations with the strongest functional connectivity are shown in yellow. Pink arrows designate the parcellation of interest.
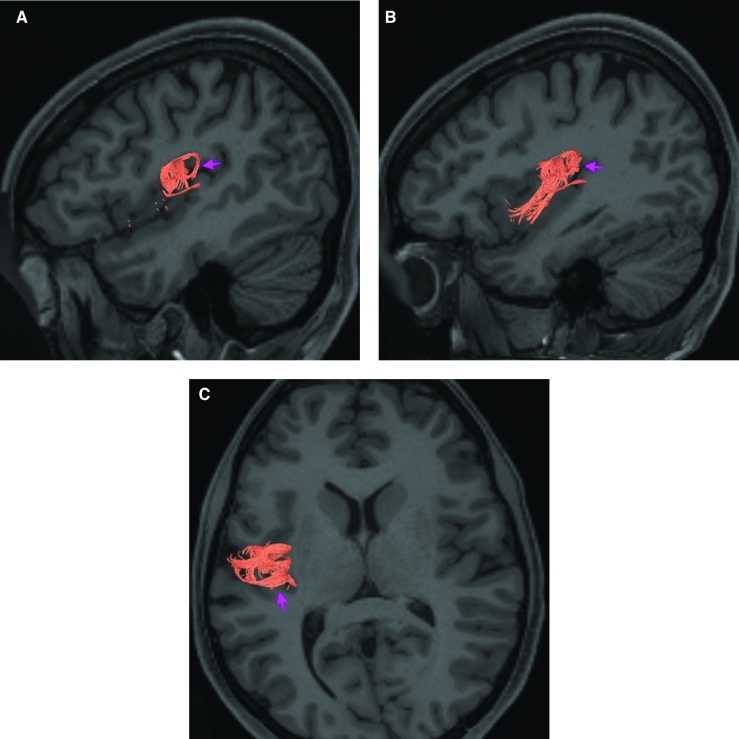
Structural connectivity of PFcm in the left hemisphere, shown on T1-weighted MR images. Sagittal views of A, lateral and B, medial planes. C, Axial view. Red: white matter tracts of PFcm demonstrating connections with portions of the arcuate/SFL. Pink arrows designate the parcellation of interest.
Functional connectivity of RI demonstrated on an inflated left hemisphere. A, Lateral and medial views. B, Rostral and caudal views. C, Dorsal and ventral views. Parcellations with the strongest functional connectivity are shown in yellow. Pink arrows designate the parcellation of interest.
Structural connectivity of RI in the left hemisphere, shown on T1-weighted MR images. Sagittal views of A, lateral and B, medial planes. C, Axial view. Yellow: white matter tracts of RI demonstrating connections with portions of the arcuate/SFL, anterior insula, and local parcellations. Pink arrows designate the parcellation of interest.
Functional connectivity of 52 demonstrated on an inflated left hemisphere. A, Lateral and medial views. B, Rostral and caudal views. C, Dorsal and ventral views. Parcellations with the strongest functional connectivity are shown in yellow. Pink arrows designate the parcellation of interest.
Structural connectivity of 52 in the left hemisphere, shown on T1-weighted MR images. Sagittal views of A, medial and B, lateral planes. C, Axial view. Orange: white matter tracts of 52 demonstrating connections with local parcellations. Pink arrows designate the parcellation of interest.
Functional connectivity of A1 demonstrated on an inflated left hemisphere. A, Lateral and medial views. B, Rostral and caudal views. C, Dorsal and ventral views. Parcellations with the strongest functional connectivity are shown in yellow. Pink arrows designate the parcellation of interest.
Structural connectivity of A1 in the left hemisphere, shown on T1-weighted MR images. Sagittal views of A, lateral and B, medial planes. C, Axial view. Purple: white matter tracts of A1 demonstrating connections with the parietal lobe, occipital lobe, inferior frontal gyrus, and local parcellations. Pink arrows designate the parcellation of interest.
Functional connectivity of Mbelt demonstrated on an inflated left hemisphere. A, Lateral and medial views. B, Rostral and caudal views. C, Dorsal and ventral views. Parcellations with the strongest functional connectivity are shown in yellow. Pink arrows designate the parcellation of interest.
Structural connectivity of MBelt in the left hemisphere, shown on T1-weighted MR images. Sagittal views of A, lateral and B, medial planes. C, Axial view. Light Blue: white matter tracts of MBelt demonstrating connections with the middle longitudinal fasciculus. Pink arrows designate the parcellation of interest.
Functional connectivity of Lbelt demonstrated on an inflated left hemisphere. A, Lateral and medial views. B, Rostral and caudal views. C, Dorsal and ventral views. Parcellations with the strongest functional connectivity are shown in yellow. Pink arrows designate the parcellation of interest.
Structural connectivity of LBelt in the left hemisphere, shown on T1-weighted MR images. Sagittal views of A, lateral and B, medial planes. C, Axial view. Purple: white matter tracts of LBelt demonstrating connections with the arcuate/SFL. Pink arrows designate the parcellation of interest.
Functional connectivity of PBelt demonstrated on an inflated left hemisphere. A, Lateral and medial views. B, Oblique views demonstrating the operculum. C, Rostral and caudal views. D, Dorsal and ventral views. Parcellations with the strongest functional connectivity are shown in yellow. Pink arrows designate the parcellation of interest.
Structural connectivity of PBelt in the left hemisphere, shown on T1-weighted MR images. Sagittal views of A, lateral and C, medial planes. B, Axial view. Yellow: white matter tracts of PBelt demonstrating connections with the middle longitudinal fasciculus and the arcuate/SFL. Pink arrows designate the parcellation of interest.

Functional connectivity of PSL demonstrated on an inflated left hemisphere. A, Lateral and medial views. B, Rostral and caudal views. C, Dorsal and ventral views. Parcellations with the strongest functional connectivity are shown in yellow. Pink arrows designate the parcellation of interest.
Structural connectivity of PSL in the left hemisphere, shown on T1-weighted MR images. Sagittal views of A, lateral and B, medial planes. C, Axial view. Light Pink: white matter tracts of PSL demonstrating connections with the arcuate/SFL. Darker pink arrows designate the parcellation of interest.
Functional connectivity of STV demonstrated on an inflated left hemisphere. A, Lateral and medial views. B, Rostral and caudal views. C, Dorsal and ventral views. Parcellations with the strongest functional connectivity are shown in yellow. Pink arrows designate the parcellation of interest.
Structural connectivity of STV in the left hemisphere, shown on T1-weighted MR images. Sagittal views of A, medial and B, lateral planes. C, Axial view. Yellow: white matter tracts of STV demonstrating connections with the temporal lobe and local parcellations. Pink arrows designate the parcellation of interest.
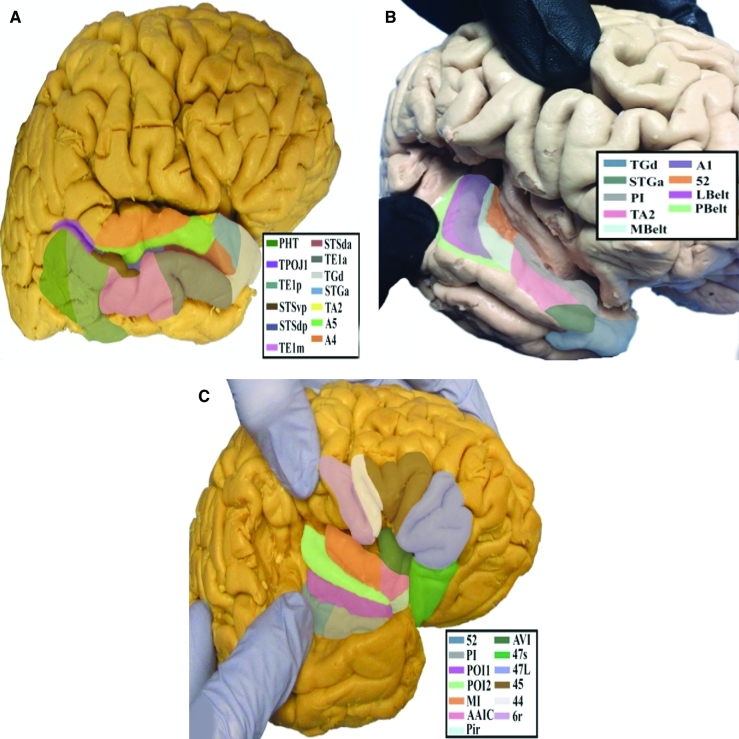
Anatomical location of temporal “hypotenuse” parcellations shown on the left hemisphere of a cadaver brain. A, Lateral view of the superior temporal sulcus. B, Oblique view with a widening of the lateral sulcus to visualize superior temporal lobe parcellations. C, Lateral view with widening of the lateral sulcus to visualize frontal opercular and insular regions adjacent to the temporal lobe.
Combined structural connectivity of the temporal “hypotenuse” parcellations in the left hemisphere, shown on T1-weighted MR images. Sagittal views of A, lateral, B, medial, and C, far medial planes. D, Axial view.
Functional connectivity of Pol1 demonstrated on an inflated left hemisphere. A, Lateral and medial views. B, Oblique view. C, Rostral and caudal views. D, Dorsal and ventral views. Parcellations with the strongest functional connectivity are shown in yellow. Pink arrows designate the parcellation of interest.
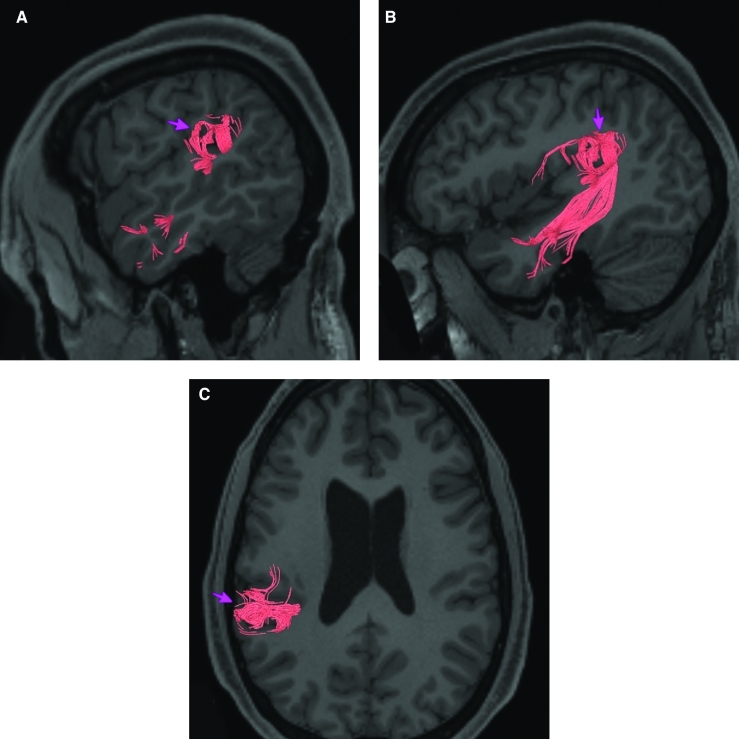
Structural connectivity of PoI1 in the left hemisphere, shown on T1-weighted MR images. Sagittal views of A, lateral and B, medial planes. C, Axial view. Pink: white matter tracts of PoI1 demonstrating connections with the occipital lobe, parietal lobe, and local parcellations. Pink arrows designate the parcellation of interest.
Functional connectivity of Pol2 demonstrated on an inflated left hemisphere. A, Lateral and medial views. B, Rostral and caudal views. C, Dorsal and ventral views. Parcellations with the strongest functional connectivity are shown in yellow. Pink arrows designate the parcellation of interest.
Structural connectivity of PoI2 in the left hemisphere, shown on T1-weighted MR images. Sagittal views of A, lateral and B, medial planes. C, Axial view. Green: white matter tracts of PoI2 demonstrating connections with the parietal lobe, entorhinal cortex and local parcellations. Pink arrows designate the parcellation of interest.

Functional connectivity of Pl demonstrated on an inflated left hemisphere. A, Lateral and medial views. B, Oblique views demonstrating the operculum. C, Rostral and caudal views. D, Dorsal and ventral views. Parcellations with the strongest functional connectivity are shown in yellow. Pink arrows designate the parcellation of interest.

Structural connectivity of PI in the left hemisphere, shown on T1-weighted MR images. Sagittal views of A, lateral and B, medial planes. C, Axial view. White: white matter tracts of PI demonstrating connections with the temporal pole, occipital lobe, and local parcellations. Pink arrows designate the parcellation of interest.
Functional connectivity of A4 demonstrated on an inflated left hemisphere. A, Lateral and medial views. B, Rostral and caudal views. C, Dorsal and ventral views. Parcellations with the strongest functional connectivity are shown in yellow. Pink arrows designate the parcellation of interest.
Structural connectivity of A4 in the left hemisphere, shown on T1-weighted MR images. Sagittal views of A, lateral, B, medial, and C, far medial planes. D, Axial view showing projections to the contralateral hemisphere. Green: white matter tracts of A4 demonstrating connections with the arcuate/SFL and the middle longitudinal fasciculus. Pink arrows designate the parcellation of interest.
Functional connectivity of A5 demonstrated on an inflated left hemisphere. A, Lateral and medial views. B, Rostral and caudal views. C, Dorsal and ventral views. Parcellations with the strongest functional connectivity are shown in yellow. Pink arrows designate the parcellation of interest.
Structural connectivity of A5 in the left hemisphere, shown on T1-weighted MR images. Sagittal views of A, lateral, B, medial, and C, far medial planes. D, Axial view. Green: white matter tracts of A5 demonstrating connections with the arcuate/SFL and the middle longitudinal fasciculus. Pink arrows designate the parcellation of interest.
Functional connectivity of STGa demonstrated on an inflated left hemisphere. A, Lateral and medial views. B, Rostral and caudal views. C, Dorsal and ventral views. Parcellations with the strongest functional connectivity are shown in yellow. Pink arrows designate the parcellation of interest.

Structural connectivity of STGa in the left hemisphere, shown on T1-weighted MR images. Sagittal views of A, lateral and B, medial planes. C, Axial view. Light Blue: white matter tracts of STGa demonstrating connections with the inferior longitudinal fasciculus and local parcellations. Pink arrows designate the parcellation of interest.
Functional connectivity of TA-2 demonstrated on an inflated left hemisphere. A, Lateral and medial views. B, Oblique views demonstrating the operculum. C, Rostral and caudal views. D, Dorsal and ventral views. Parcellations with the strongest functional connectivity are shown in yellow. Pink arrows designate the parcellation of interest.
Structural connectivity of TA2 in the left hemisphere, shown on T1-weighted MR images. Sagittal views of A, lateral and B, medial planes. C, Axial view. Yellow: white matter tracts of TA2 demonstrating connections with the inferior longitudinal fasciculus and local parcellations. Pink arrows designate the parcellation of interest.
References
Publication types
MeSH terms
Grants and funding
LinkOut - more resources
Full Text Sources
Other Literature Sources
