. 2018 Sep 27;16(9):e2005513.
doi: 10.1371/journal.pbio.2005513. eCollection 2018 Sep.

Multiple origins and modularity in the spatiotemporal emergence of cerebellar astrocyte heterogeneity

Affiliations

Multiple origins and modularity in the spatiotemporal emergence of cerebellar astrocyte heterogeneity

Valentina Cerrato et al. PLoS Biol. .

Abstract

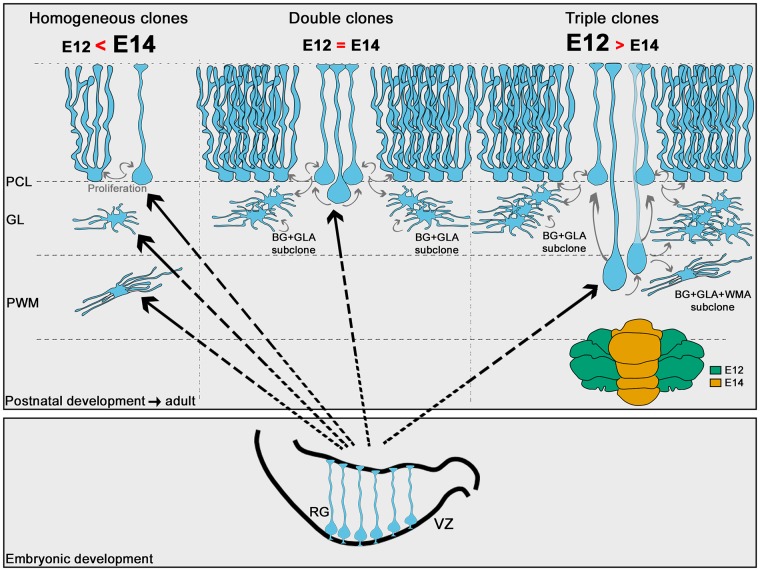
The morphological, molecular, and functional heterogeneity of astrocytes is under intense scrutiny, but how this diversity is ontogenetically achieved remains largely unknown. Here, by quantitative in vivo clonal analyses and proliferation studies, we demonstrate that the major cerebellar astrocyte types emerge according to an unprecedented and remarkably orderly developmental program comprising (i) a time-dependent decline in both clone size and progenitor multipotency, associated with clone allocation first to the hemispheres and then to the vermis(ii) distinctive clonal relationships among astrocyte types, revealing diverse lineage potentials of embryonic and postnatal progenitors; and (iii) stereotyped clone architectures and recurrent modularities that correlate to layer-specific dynamics of postnatal proliferation/differentiation. In silico simulations indicate that the sole presence of a unique multipotent progenitor at the source of the whole astrogliogenic program is unlikely and rather suggest the involvement of additional committed components.


Conflict of interest statement

The authors have declared that no competing interests exist.

Figures

Fig 1
Fig 1. In utero StarTrack electroporations and clone allocation in the cerebellum.
(A) Schematic representation of the experimental design. The hGFAP-StarTrack mixture was electroporated at E12 or E14, and clonal analysis was performed at P30. (B,C) StarTrack-labeled astrocytes are found in all cerebellar layers in P30 mice and comprise WMAs (white arrows), GLAs (white arrowheads), and BG (yellow arrowheads). In B’, 2 sister GLAs share the same combination of fluorescent proteins (asterisks), whereas the third GLA displays a different color combination, thus deriving from a different progenitor, even though it is very close to the other 2 GLAs. (D) Schematic representation of the relative M-L extension of each clone. E12-P30 clones (green) preferentially settle in the cerebellar hemispheres, whereas E14-P30 families (orange) are exclusively located in the vermis. Based on the cerebellar symmetry around the midline, all clones are projected on one-half cerebellum. The paravermis is defined as that region where lobule IX fades and lobule X is still present. (E) Diagrams are representative of clone distribution along the A-P axis. E12-P30 clones (green) are homogeneously distributed in all lobules of the hemispheres, whereas E14-P30 ones (orange) preferentially occupy the ventral vermis, including both anterior and posterior folia. Each dot corresponds to 1–2 clones. When clones are found in >1 lobule, they are repeatedly represented in each corresponding folium. Scale bars: 30 μm. A-P, antero-posterior; BG, Bergmann glia; CI and CII, CrusI and CrusII; Cp, copula pyramidis; D-V, dorso-ventral; E, embryonic day; GFP, green fluorescent protein; GLA, granular layer astrocyte; hGFAP, human glial fibrillary acidic protein; mCerulean, monomeric Cerulean; mCherry, monomeric Cherry; mKO, mKusabira Orange; M-L, medio-lateral; mT-Sapphire, monomeric T-Sapphire; P, postnatal day; PCL, Purkinje cell layer; Pm, paramedian; S, Simplex; WM, white matter; WMA, white matter astrocyte; YFP, yellow fluorescent protein.
Fig 2
Fig 2. Composition of clones derived from E12 or E14 progenitors.
(A-C) HomCs composed of WMAs (A; arrowheads indicate sister cells), GLAs (B), or BG (C) are generated by both early- and late-tagged progenitors. (D,E) The 2 major types of HetCs include triple clones made of BG+GLA+WMA (D) and double clones made of BG+GLA (E). (F,G) HomCs (dark shade) and HetCs (light shade) are produced in different frequencies by E12 (F) and E14 progenitors (G, P = 0.009). Among HetCs, BG+GLA+WMA clones are more numerous in E12-P30 compared to E14-P30 clones (P = 0.023), whereas BG+GLA clones do not vary (P = 0.748). Whereas WMA HomCs double in frequency in E14-P30 clones compared to E12-P30 clones (P < 0.001), BG HomCs decrease significantly (P = 0.021). Pies illustrate pooled data from 3–4 animals. (F) Minor fractions: CNA = 3.52%, WMA+CNA = 2.47%, GLA+CNA = 0.35%, BG+WMA = 1.06%, WMA+GLA = 3.17%, BG+GLA+ WMA+CNA = 2.47%. (G) Minor fractions: CNA = 3.92%, WMA+CNA = 0.98%, BG+WMA = 1.96%, WMA+GLA = 2.94%. P values are calculated with Fisher’s exact test. n = number of clones. Green = E12-P30 clones; orange = E14-P30 clones. Scale bars: 30 μm. BG, Bergmann glia; CNA, cerebellar nuclei astrocyte; E, embryonic day; GL, granular layer; GLA, granular layer astrocyte; HetC, heterogeneous clone; HomC, homogeneous clone; P, postnatal day; PCL, Purkinje cell layer; WM, white matter; WMA, white matter astrocyte.
Fig 3
Fig 3. Quantitative analyses of clone size and stoichiometry of clone composition.
(A,B) Scatterplots of clone size. (A) E12-P30 clones (green) are overall bigger than E14-P30 clones (orange). This same trend is maintained when comparing HomCs and HetCs within each time point (P < 0.001). E12-P30 HomCs contain more cells compared to E14-P30 clones, whereas HetCs’ size changes do not reach statistical significance (P = 0.081). (B) Triple BG+GLA+WMA clones are the biggest clone type and tend to be smaller when generated later (P = 0.317). Double BG+GLA clones are smaller than triple clones and display the same average size in the 2 data sets (P = 0.750). (C,D) Scatterplots show the number of distinct astroglial types in triple and double clones after E12 (C) or E14 (D) IUE. The insets report the clone-wise stoichiometry, rounded to the first decimal, which shows a joint expansion of GLAs and BG compared to WMAs in triple clones, whereas in double clones, BG prevail over GLAs. **, P < 0.01; ***, P < 0.001; P values are calculated with GEE analysis. n = number of clones. The numerical data used in the figure are included in S1 Data. BG, Bergmann glia; E, embryonic day; GEE, generalized estimating equations; GLA, granular layer astrocyte; HetC, heterogeneous clone; HomC, homogeneous clone; IUE, in utero electroporation; WMA, white matter astrocyte.
Fig 4
Fig 4. Quantitative analysis of clone dispersion along the M-L and A-P axes.
(A,B) The M-L dispersion of clones tagged at E12 (green) or E14 (orange) is estimated as the longest intraclone cell distance along the M-L axis. (A) Scatterplots show that dispersion greatly decreases in E14-P30 clones compared to E12-P30 clones. HomCs are mostly found in a single cerebellar section, whereas HetCs are much more dispersed. (B) Among HetCs, triple clones are more expanded than double clones in both populations. Namely, E12-P30 triple clones are the most dispersed. (C,D) Correlation analysis shows a positive correlation between clonal size and M-L dispersion in both E12-P30 (C, n = 254 clones) and E14-P30 (D, n = 92 clones) populations (P < 0.001). (E) Distribution along the A-P axis of E12-P30 (green) and E14-P30 (orange) clones found in lobules. HomCs and double clones tagged at E12 mostly settle in a single lobule, whereas triple clones are often found in more than one lobule. E14-P30 clones are overall found in one lobule. Within lobules, cortical cells of HetCs were mostly found on the same side (i.e., lobular wall) divided by the WM (67% and 86% of E12-P30 and E14-P30 clones, respectively). *, P < 0.05; ***, P < 0.001; P values are calculated with GEE analysis. n = number of clones. The numerical data used in the figure are included in S1 Data. A-P, antero-posterior; BG, Bergmann glia; E, embryonic day; GEE, generalized estimating equations; GLA, granular layer astrocyte; HetC, heterogeneous clone; HomC, homogeneous clone; M-L, medio-lateral; WM, white matter; WMA, white matter astrocyte.
Fig 5
Fig 5. Modularity of HetCs.
(A) Cumulative proportions of intracluster, cell-to-cell NND. Both double (red) and triple (blue and black) clones show a high degree of clustering when their distributions (large symbols) are compared to random distributions (small symbols; P < 0.001). Symbols represent empirical proportions. Continuous lines are the fitted curves. (B,C) Cluster analysis confirms the presence of subclones in both double and triple clones. The 3D reconstructions of a representative triple (B) and double (C) E12-P30 clone highlight the presence of spaced-out subclones composed of BG and GLAs; (B) also contains WMAs. (B’, C’) Higher magnifications of representative subclones (dashed circles) of the clones in (B) and (C). Gray spheres indicate cells of other clones. Plots in (B”) and (C”) show the number (k) and composition (cell type and number of cells/subclone) of subclones identified in the representative triple (B) and double (C) clones, respectively. Each subclone is arbitrarily associated to a number (subclone n.). (D), Analysis of subclone composition reveals that most (>80%) subclones in both double (red) and triple (blue) clones comprise both BG and GLAs. (E-H), BG:GL ratio distributions in subclones comprising both BG and GLAs. In double clones (E, number of subclones = 55), BG prevails over GLAs (mean ratio = 1.772, equivalent to 0.572 log units, P < 0.001). Subclones in triple clones containing WMAs (F, number of subclones = 49) show no predominance of either BG or GLAs (mean ratio = 0.930, −0.073 log units, P = 0.580), even when WMAs are excluded (G, number of subclones = 53; mean ratio = 0.963, −0.038 log units, P = 0.843), whereas subclones containing only BG and GLAs (H, number of subclones = 64) again display a prevalence of BG over GLAs (mean ratio = 1.310, 0.270 log units, P = 0.017). Number of bins = 10. In each plot, the vertical solid line indicates 1:1 ratio, the vertical dotted line indicates the mean ratio, and the light-colored area indicates the 95% bootstrap confidence interval of the mean. P values are computed with Wilcoxon signed rank test against zero. The numerical data used in panels (A,E,F,G,H) are included in S1 Data. A-P, antero-posterior; BG, Bergmann glia; D-V, dorso-ventral; GLA, granular layer astrocyte; HetC, heterogeneous clone; M-L, medio-lateral; NND, Nearest Neighbor Distance; PCL, Purkinje cell layer; WM, white matter; WMA, white matter astrocyte.
Fig 6
Fig 6. Analyses of clones at birth.
(A) Schematic representation of the experimental design. IUE of the hGFAP-StarTrack mixture was performed at E12 or E14 and clonal analysis at P0. Representative examples of tagged cells at P0 comprising fibrous cells and RG-like cells in the PWM (A’), stellate GLA (GLAp), and PCLps of BG in the developing cortex (A”). (B) Schematic representation of clone distribution along the A-P and M-L axes. Early clones tagged at E12 (green) are settled in the hemispheres and are homogeneously distributed in all the developing lobules. Clones tagged at E14 (orange) are found in the vermis and allocate preferentially to anterior and, less frequently, to posterior lobules. (C) After both E12 and E14 IUE, HomCs are mostly found in the PWM at P0. A relevant proportion is also found in cortical layers (“exploded” sections), mostly as clones composed of PCLps. HetCs are still rare and include clones with cells in the two developing cortical layers (PCLp+GLAp) or in both PWM and cortex (PWM+cortical, comprising BGp+PWM, GLAp+PWM, and BGp+GLAp+PWM clones). Pies illustrate pooled data from 3 animals per time point. (D) Scatterplots show the size of E12 (green) and E14 (orange) clones at P0. Early- and late-tagged clones show statistically different sizes, despite the difference being negligible. At both time points, HomCs are smaller than HetCs. (E) Scatterplots show the M-L dispersion of E12- and E14-derived clones at P0. E12 and E14 clones do not differ in their M-L dispersion (P = 0.502). HetCs at both time points tend to be more dispersed than HomCs. (**, P < 0.01; ***, P < 0.001; P values are calculated with GEE analysis). Table in (F) summarizes the numbers of clones in each layer at P0 and P30 and the P values resulting from their comparisons by Fisher’s exact test. n = number of clones. Scale bars: 10 μm. The numerical data used in panels (D,E) are included in S1 Data. A-P, antero-posterior; D-V, dorso-ventral; E, embryonic day; GEE, generalized estimating equations; GL, granular layer; GLAp, granular layer astrocyte precursor; HetC, heterogeneous clone; hGFAP, human glial fibrillary acidic protein; HomC, homogeneous clone; IUE, in utero electroporation; M-L, medio-lateral; P, postnatal day; PCL, Purkinje cell layer; PCLp, Purkinje cell layer precursor; PWM, prospective white matter; RG, radial glia; VC, ventricular cell.
Fig 7
Fig 7. Analysis of PCLp progenies at P30.
(A) Experimental design of superficial administration of Tx to induce R26RConfetti recombination in radial GLAST+ precursors in the PCL (PCLps). (B-D) Analysis after serial sections’ reconstruction at P30 reveals the existence of sister astrocytes (i.e., expressing the same color) arranged in different clone types: BG clones (B), double clones composed of BG+GLA (C), and rare GLA clones (D). (E) Quantification of the relative proportion of each clone type derived from P6-tagged PCLps in lobule IV–V. Pies illustrate pooled data from 3 animals. (F,F’) Examples of clones distributed in 1 or 2 adjacent sections. (B = BG, G = GLA; superscripts indicate distinct clones; subscripts indicate sister cells). (G) Scatterplots of clone size. BG+GLA clones are bigger compared to clones composed of only BG or GLAs. (H) Scatterplots show the number of distinct astrocyte types in double clones. The insets report the clonewise stoichiometry, rounded to the first decimal, which highlights the prevalence of BG over GLA. ***, P < 0.001; P values are calculated with GEE analysis n = number of clones. Scale bars: 30 μm (B-D), 100 μm (F-F’). The numerical data used in panels (G,H) are included in S1 Data. BG, Bergmann glia; CFP, cyan fluorescent protein; DAPI, 4′,6-diamidino-2-phenylindole; GEE, generalized estimating equations; GL, granular layer; GLA, granular layer astrocyte; GLAST, glutamate aspartate transporter; ML, molecular layer; PCL, Purkinje cell layer; PCLp, Purkinje cell layer precursor; RFP, red fluorescent protein; Tx, tamoxifen; WM, white matter; YFP, yellow fluorescent protein.
Fig 8
Fig 8. Proliferation and cell cycle exit of cerebellar astrocytes.
(A-D) Analysis of active proliferation of astrocytes in different layers during early postnatal development. (A) Percentage of EdU-incorporating astrocyte precursors among total hGFAP+ cells subdivided per layers. EdU was administered 6 h before killing at P1, P4, or P7 to detect actively proliferating cells. At all analyzed time points, proliferation varies among layers and declines over time in both vermis and hemispheres. In B-D”, arrowheads point to double-labeled proliferating precursors, highlighting the overall reduction over time in the proliferation activity and the higher number of proliferating cells in the PCL compared to the other layers. (E-G”) Birthdating of astrocytes retaining a strong BrdU signal (BrdUhigh) after the completion of the maturation process (P30). The histogram in (E) shows that the highest percentages of BrdUhigh+ cells are observed in the first postnatal week, with minimal labeling before and afterwards. In detail, numerous WMAs exit the cell cycle already at P1, while GLAs and BG differentiate later. On the whole, this layer-specific pattern applies to both the vermis and the hemispheres (P = 0.139), where, however, differentiation delayed (PCL, P < 0.001). (F-F”,G-G”) Full and empty arrowheads point to astrocytes retaining a strong (BrdUhigh) or a diluted (BrdUlow) BrdU signal, respectively. *, P < 0.05; **, P < 0.01; ***, P < 0.001; P values are calculated with GEE analysis. Plots represent data averaged from distinct animals. Scale bars: 30 μm. The numerical data used in panels (A,E) are included in S1 Data. BG, Bergmann glia; BrdU, bromodeoxyuridine; EdU, 5-ethynyl-2′-deoxyuridine; GEE, generalized estimated equations; GL, granular layer; GLA, granular layer astrocyte; hGFAP, human glial fibrillary acidic protein; P, postnatal day; PCL, Purkinje cell layer; PWM, prospective white matter; WM, white matter; WMA, white matter astrocyte.
Fig 9
Fig 9. Rules and outcome of the simulation model applied to E12 lineages.
(A,B) The schematic representation in (A) shows the distinct fate transitions allowed in the model (indicated by the arrows). The probability of MP proliferation is kept constant at 0.465 in the simulations of E12-P30 lineages. Each daughter cell of each division either remains an MP or differentiates into a postmitotic astrocyte. In this latter case, the probabilities of generating the distinct astrocyte subtypes (BG versus GLA versus WMA) are generation-dependently set according to the birthdating experiments performed in the hemispheres, as shown in (B). Histograms in (C-E) show the outcomes of the simulated lineages compared to the experimental data. Simulated clone sizes (C) appear quite similar to those of the observed clones. On the other hand, the proportions of astrocyte subtypes are not well represented, with too many WMAs and BG produced (D). Same color code as in (A). Similarly, the model fails to recapitulate the proportions of clone subtypes (E; E12-P30). (F,G) Simulated and observed lineages were compared at P0 (corresponding to generation 6). Too many HetCs (F) are found in simulated lineages compared to empirical clones, because of the generation of too many PWM+cortical clones at the expense of both cortical and PWM families (G). ***, P < 0.001; P values are calculated with chi-squared test. Cortical clones comprise PCLp HomCs, GLAp HomCs, and PCLp+GLAp HetCs; Cortical+PWM clones comprise PCLp+PWM, GLAp+PWM, and PCLp+GLAp+PWM HetCs. The numerical data used in panels (B-G) are included in S1 Data. BG, Bergmann glia; E, embryonic day; GLA, granular layer astrocyte; GLAp, granular layer astrocyte precursor; HetC, heterogeneous clone; HomC, homogeneous clone; MP, multiple progenitor; P, postnatal day; PCLp, Purkinje cell layer precursor; PWM, prospective white matter; WMA, white matter astrocyte.
Fig 10
Fig 10. Schematic model for emergence of cerebellar astroglial lineages.
Cerebellar astrogliogenesis occurs from RG that either generate HomCs for each major astrocyte type—more frequent among vermian E14-P30 clones—or HetCs. HetCs, including double and triple clones, are proposed to originate from intermediate basal progenitors derived from RG. Double clones are similarly produced by either E12 or E14 RG and appear composed on average of 2 subclones with the same modularity. In these subclones, BG dominates over GLAs, likely as the result of the amplification of ventricular progenitors translocated into the PCL. Triple clones, more frequent among E12-P30 lineages, include the 3 major astrocyte types and appear composed by 3 subclones belonging to distinct typologies, depending on the presence of WMAs. Subclones can be formed by BG+GLA types, in which case they show modularity, and by BG+GLA+WMA types, in which case there is no apparent modularity but a very diverse cell type composition. BG, Bergmann glia; E, embryonic day; GL, granular layer; GLA, granular layer astrocyte; HetC, heterogeneous clone; HomC, homogeneous clone; RG, radial glia; PCL, Purkinje cell layer; PWM, prospective white matter; VZ, ventricular zone; WMA, white matter astrocyte.

References

    1. Bayraktar OA, Fuentealba LC, Alvarez-Buylla A, Rowitch DH. Astrocyte development and heterogeneity. Cold Spring Harb Perspect Biol. 2015;7(1) a020362 10.1101/cshperspect.a020362 - DOI - PMC - PubMed
    1. Ben Haim L, Rowitch D. Functional diversity of astrocytes in neural circuit regulation. Nat Rev Neurosci. 2016;18(1):31–41. 10.1038/nrn.2016.159 - DOI - PubMed
    1. John Lin C-C, Yu K, Hatcher A, Huang T-W, Lee HK, Carlson J, et al. Identification of diverse astrocyte populations and their malignant analogs. Nat Neurosci. 2017;20(3): 396–405. 10.1038/nn.4493 - DOI - PMC - PubMed
    1. García-Marqués J, López-Mascaraque L. Clonal identity determines astrocyte cortical heterogeneity. Cereb Cortex. 2012;23(6):1463–72. 10.1093/cercor/bhs134 - DOI - PubMed
    1. Bribián A, Figueres-Oñate M, Martín-López E, López-Mascaraque L. Decoding astrocyte heterogeneity: New tools for clonal analysis. Neuroscience. 2016;323(Supplement C):10–9. 10.1016/j.neuroscience.2015.04.036 - DOI - PubMed

Publication types