. 2018 Sep 27;13(9):e0202743.
doi: 10.1371/journal.pone.0202743. eCollection 2018.

Women's visibility in academic seminars: Women ask fewer questions than men

Affiliations

Women's visibility in academic seminars: Women ask fewer questions than men

Alecia J Carter et al. PLoS One. .

Erratum in

Abstract

The attrition of women in academic careers is a major concern, particularly in Science, Technology, Engineering, and Mathematics subjects. One factor that can contribute to the attrition is the lack of visible role models for women in academia. At early career stages, the behaviour of the local community may play a formative role in identifying ingroup role models, shaping women's impressions of whether or not they can be successful in academia. One common and formative setting to observe role models is the local departmental academic seminar, talk, or presentation. We thus quantified women's visibility through the question-asking behaviour of academics at seminars using observations and an online survey. From the survey responses of over 600 academics in 20 countries, we found that women reported asking fewer questions after seminars compared to men. This impression was supported by observational data from almost 250 seminars in 10 countries: women audience members asked absolutely and proportionally fewer questions than male audience members. When asked why they did not ask questions when they wanted to, women, more than men, endorsed internal factors (e.g., not working up the nerve). However, our observations suggest that structural factors might also play a role; when a man was the first to ask a question, or there were fewer questions, women asked proportionally fewer questions. Attempts to counteract the latter effect by manipulating the time for questions (in an effort to provoke more questions) in two departments were unsuccessful. We propose alternative recommendations for creating an environment that makes everyone feel more comfortable to ask questions, thus promoting equal visibility for women and members of other less visible groups.


Conflict of interest statement

The authors have declared that no competing interests exist.

Figures
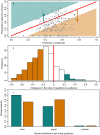
Fig 1
Fig 1. The gender “disparity” in question-asking.
A (a) scatter plot of the proportion of women in the audience plotted against the proportion of questions asked by women after a seminar, (b) a histogram of the size of the disparity at each seminar, and (c) a barchart of the beliefs of each gender about whether there is a disparity. Panel (a) shows a visual representation of the disparity in the proportion of questions asked by women (i.e., the difference in the proportion of women in the audience and the proportion of questions asked by women). Points falling in the lower orange half of the plot indicate a disparity towards men, whilst points falling in the upper green half indicate a disparity towards women audience members. Indicated are two seminars that fall in different categories. The green arrow indicates a seminar with a bias towards questions from women, in which the proportion of women in the audience was 0.38, but the proportion of questions asked by women was 0.67. Conversely, the orange arrow indicates a seminar with a bias towards questions from men, in which the proportion of women in the audience was 0.78 but the proportion of questions asked by women was 0.40. Panel (b) shows the frequency at which the disparities were observed, with orange bins indicating seminars with questions disproportionately asked by male audience members and green bins indicating seminars with questions disproportionately asked by female audience members. In both panels, the red line indicates no disparity (i.e., the proportion of the women in the audience matched the proportion of questions asked by women). Panel (c) shows the proportions of female (green) and male (orange) respondents who indicated that they believed that men or women asked more questions in seminars, or that questions were asked equally by men and women.
Fig 2
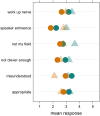
Fig 2. Mean importance assigned by women and men to (1) each reason why they themselves have not asked a question in a seminar when they wanted to, and to (2) each reason men and women believe women do not ask questions when they want to.
Shown are the mean values for women (green) and men (orange) rating how important each factor is in restricting why they themselves did not ask questions when they wanted to (circles). For the respondents who reported a belief that women ask fewer questions than men, shown are the mean values for women (green) and men (orange) rating how important each factor is in restricting women from asking questions when they wanted to (triangles).
Fig 3
Fig 3. The effects predicting the probability of question asked by a female audience member after departmental seminars.
Plotted are the effects of (a) the proportion of attendees who were women; (b) the proportion of faculty in the department who are women; (c) the total number of questions that were asked; (d) the gender of the speaker; (e) whether the speaker was internal to the department (true) or not (false); and (f) the gender of the first person to ask a question on the proportion of questions asked by women after a departmental seminar. In each panel, the coloured boxes reflect the areas of disparity in the proportion of questions asked by women after a seminar, with the white area representing moderate to no disparity (proportion of questions from women = 0.50 ± 0.10), the orange area representing a disparity towards male audience members asking questions (proportion of questions from women <0.4) and the green area representing a disparity towards female audience members asking questions (proportion of questions from women >0.6). The predicted values are plotted in all cases to control for other effects. In panels (a)-(c), the predicted logistic relationship is plotted in grey with a transparent grey polygon indicating the standard error around the relationship. Likewise, in panels (d)-(f), the predicted values of the effects are plotted as black points with standard error bars.

References

    1. Ceci SJ, Ginther DK, Kahn S, Williams WM. Women in Academic Science: A Changing Landscape. Psychol Sci Public Interest. 2014;15: 75–141. 10.1177/1529100614541236 - DOI - PubMed
    1. Alper J. The Pipeline Is Leaking Women All the Way Along. Science. 1993;260: 409 10.1126/science.260.5106.409 - DOI - PubMed
    1. Damschen EI, Rosenfeld KM, Wyer M, Murphy-Medley D, Wentworth TR, Haddad NM. Visibility matters: increasing knowledge of women’s contributions to ecology. Front Ecol Environ. 2005;3: 212–219.
    1. Eagly AH, Steffen VJ. Gender stereotypes stem from the distribution of women and men into social roles. J Pers Soc Psychol. 1984;46: 735.
    1. Peters K, Ryan M, Haslam SA, Fernandes H. To Belong or Not to Belong. J Pers Psychol. 2012;

Publication types

LinkOut - more resources