. 2018 Sep 27;16(9):e2006624.
doi: 10.1371/journal.pbio.2006624. eCollection 2018 Sep.

EpCAM ectodomain EpEX is a ligand of EGFR that counteracts EGF-mediated epithelial-mesenchymal transition through modulation of phospho-ERK1/2 in head and neck cancers

Affiliations

EpCAM ectodomain EpEX is a ligand of EGFR that counteracts EGF-mediated epithelial-mesenchymal transition through modulation of phospho-ERK1/2 in head and neck cancers

Min Pan et al. PLoS Biol. .

Abstract

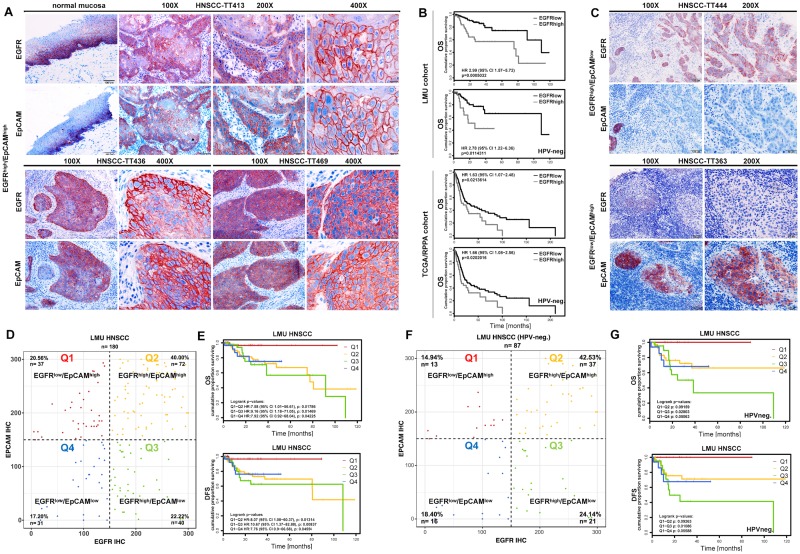
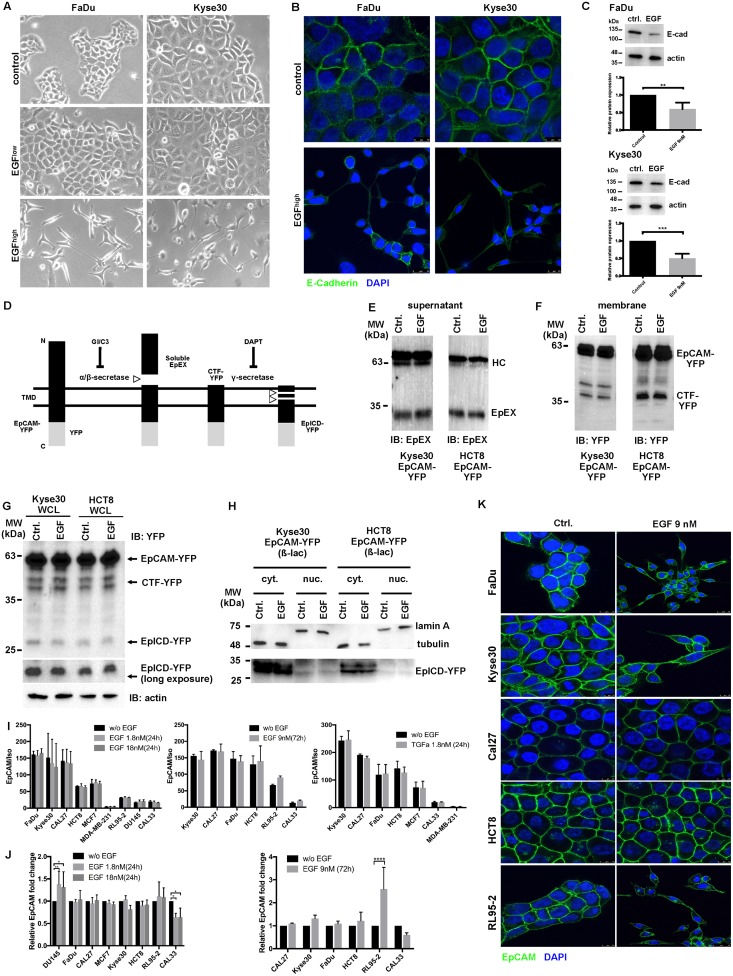
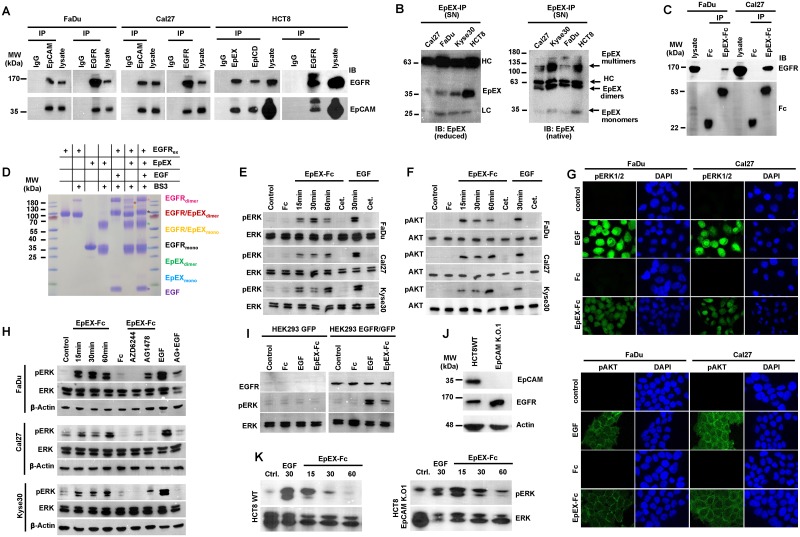
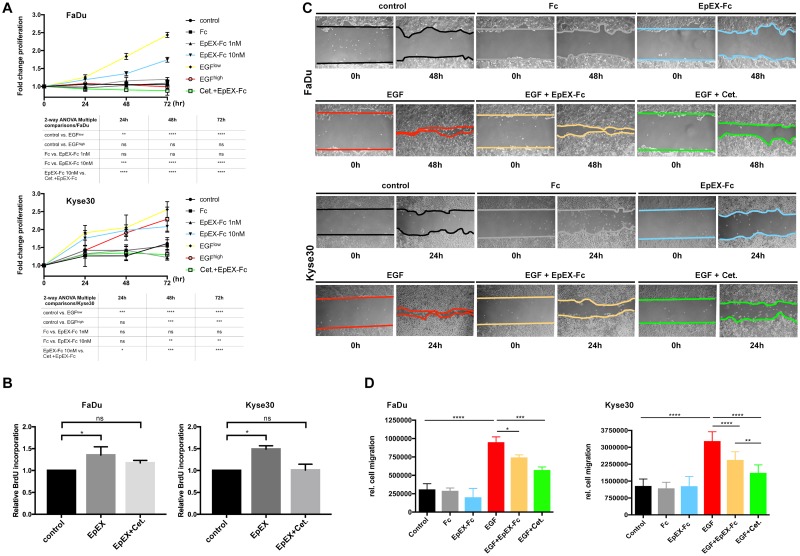
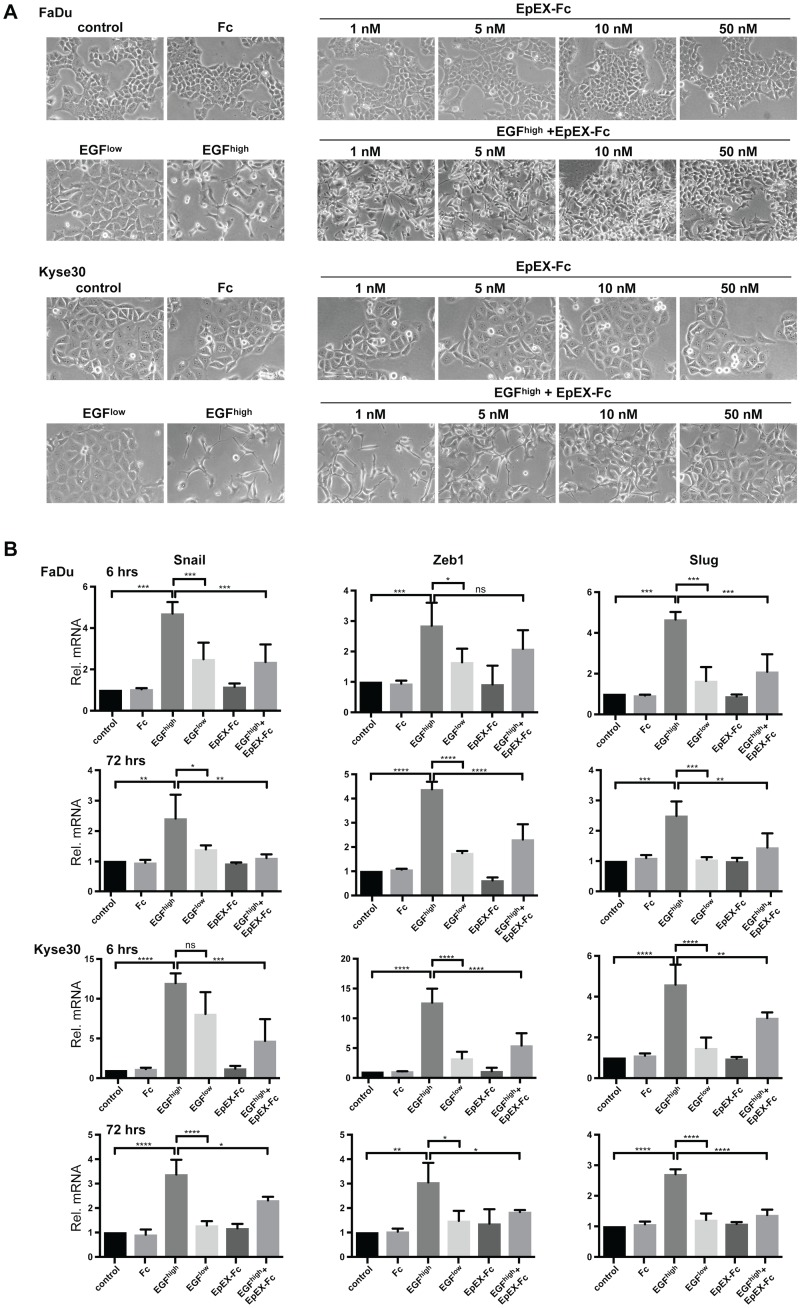
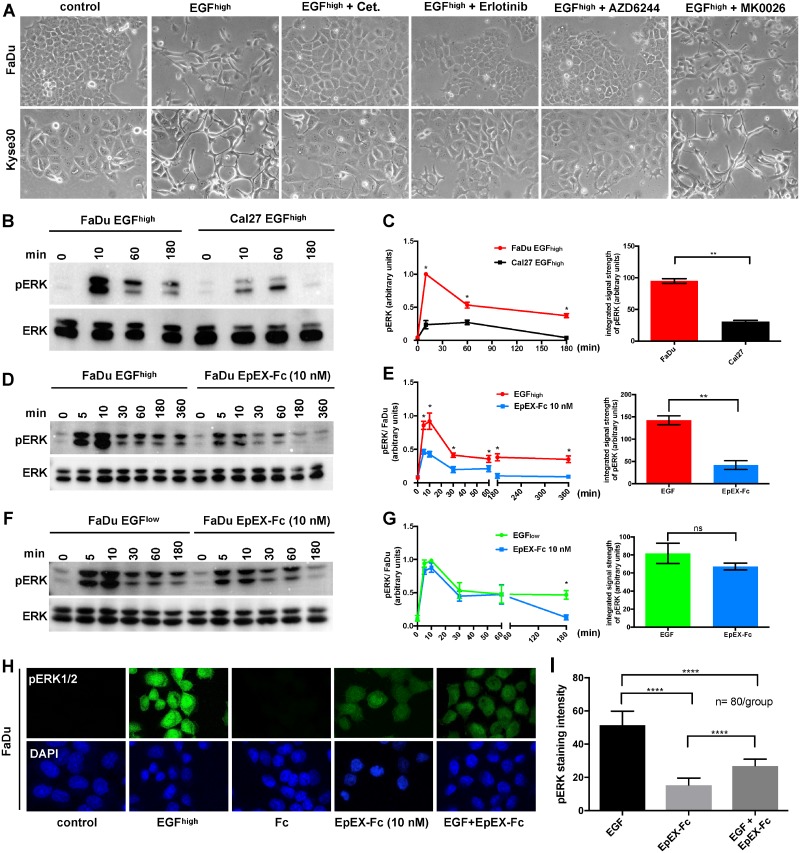
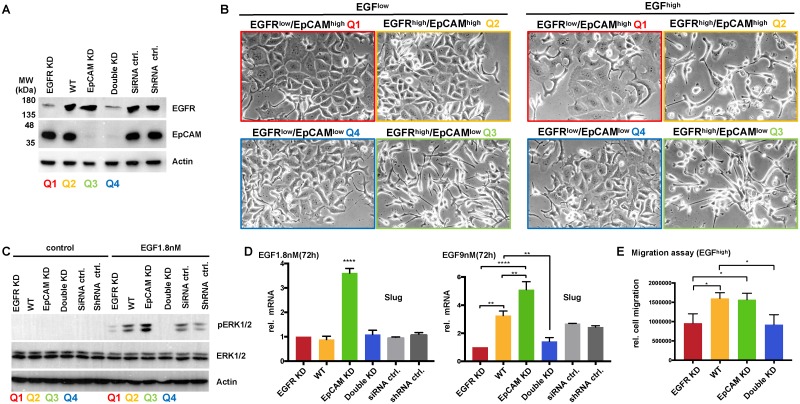
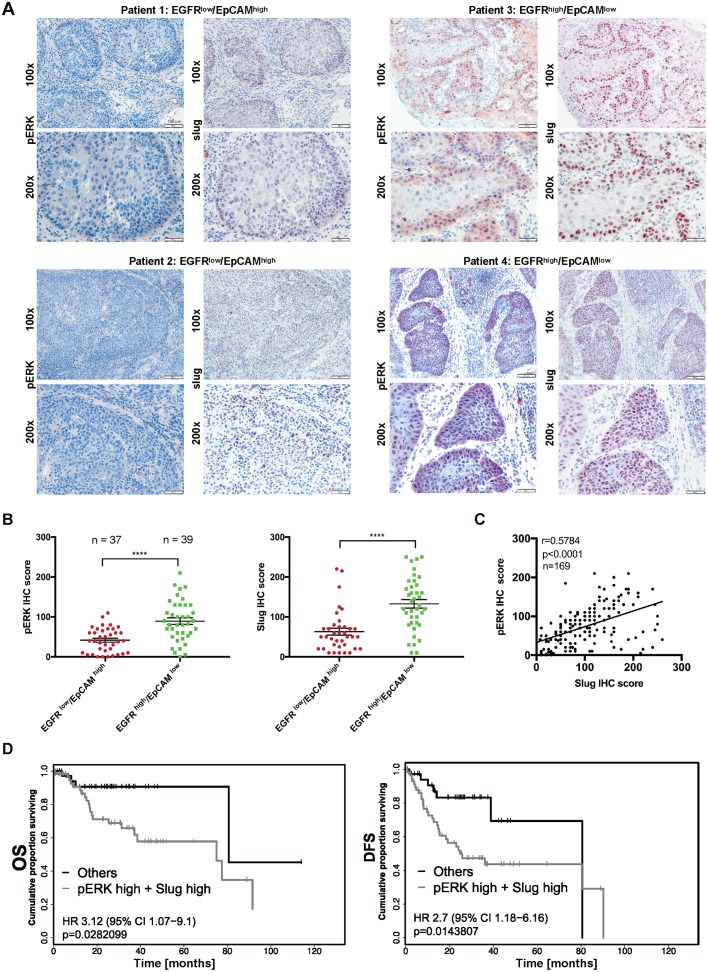
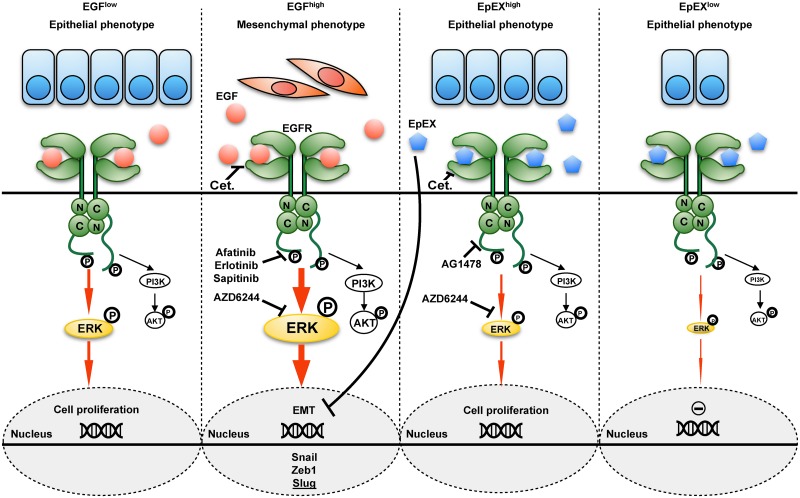
Head and neck squamous cell carcinomas (HNSCCs) are characterized by outstanding molecular heterogeneity that results in severe therapy resistance and poor clinical outcome. Inter- and intratumoral heterogeneity in epithelial-mesenchymal transition (EMT) was recently revealed as a major parameter of poor clinical outcome. Here, we addressed the expression and function of the therapeutic target epidermal growth factor receptor (EGFR) and of the major determinant of epithelial differentiation epithelial cell adhesion molecule (EpCAM) in clinical samples and in vitro models of HNSCCs. We describe improved survival of EGFRlow/EpCAMhigh HNSCC patients (n = 180) and provide a molecular basis for the observed disparities in clinical outcome. EGF/EGFR have concentration-dependent dual capacities as inducers of proliferation and EMT through differential activation of the central molecular switch phosphorylated extracellular signal-regulated kinase 1/2 (pERK1/2) and EMT transcription factors (EMT-TFs) Snail, zinc finger E-box-binding homeobox 1 (Zeb1), and Slug. Furthermore, soluble ectodomain of EpCAM (EpEX) was identified as a ligand of EGFR that activates pERK1/2 and phosphorylated AKT (pAKT) and induces EGFR-dependent proliferation but represses EGF-mediated EMT, Snail, Zeb1, and Slug activation and cell migration. EMT repression by EpEX is realized through competitive modulation of pERK1/2 activation strength and inhibition of EMT-TFs, which is reflected in levels of pERK1/2 and its target Slug in clinical samples. Accordingly, high expression of pERK1/2 and/or Slug predicted poor outcome of HNSCCs. Hence, EpEX is a ligand of EGFR that induces proliferation but counteracts EMT mediated by the EGF/EGFR/pERK1/2 axis. Therefore, the emerging EGFR/EpCAM molecular cross talk represents a promising target to improve patient-tailored adjuvant treatment of HNSCCs.


Conflict of interest statement

The authors have declared that no competing interests exist.

Figures

Fig 1
Fig 1. EGFR and EpCAM expression predicts differential clinical outcome of HNSCCs.
(A, C) Expression of EGFR and EpCAM was assessed in serial cryosections of normal mucosa and primary HNSCCs by IHC staining. Shown are representative examples of EGFRhigh/EpCAMhigh (A), EGFRhigh/EpCAMlow, and EGFRlow/EpCAMhigh (C) tumors at 100×, 200×, and 400× magnifications. (B) OS probability of HNSCC patients from the LMU cohort (n = 180) and from a subcohort of the HNSCC TCGA cohort (n = 279) [9] was stratified according to EGFR expression (cutoff threshold at the third quartile). IHC scores were generated for the LMU cohort as described [28]. Protein expression data for EGFR from the RPPA data were used for the TCGA cohort. OS is represented as Kaplan-Meier survival curves with p-value, HR, and CI for the entire cohorts and the HPV-negative subcohorts. Supporting data are compiled in S1 Data. (D, F) IHC scores of EGFR and EpCAM expression were assessed in n = 180 primary HNSCCs of the LMU cohort (D) and in n = 87 HPV-negative primary HNSCCs of the LMU cohort (F). Expression correlation of EGFR and EpCAM is plotted and subdivided according to a cutoff threshold of 150 (score range 0–300). Numbers and percentages of patients within subgroups are indicated in each quadrant. (E, G) OS and DFS were stratified according to all four quadrants defined in D and F and are represented as Kaplan-Meier survival curves with p-values, HRs, and CIs. Supporting data are compiled in S1 Data. CI, confidence interval; DFS, disease-free survival; EGFR, epidermal growth factor receptor; EpCAM, epithelial cell adhesion molecule; HNSCC, head and neck squamous cell carcinoma; HPV, human papillomavirus; HR, hazard ratio; IHC, immunohistochemistry; LMU, Ludwig-Maximilians-University; OS, overall survival; RPPA, reversed-phase protein atlas; TCGA, the Cancer Genome Atlas.
Fig 2
Fig 2. EGF promotes EMT but does not induce RIP of EpCAM.
(A) FaDu and Kyse30 cells were treated with control media and a low (1.8 nM) and high (9 nM) dose of EGF. Cell morphology was assessed after 72 hr. Shown are representative micrographs at 100× magnification from 3 independent experiments. (B) FaDu and Kyse30 cells were treated with control media and a high (9 nM) dose of EGF. Expression of E-cadherin was assessed by immunofluorescence staining and confocal laser scanning microscopy after 72 hr. Shown are representative staining from 3 independent experiments. (C) FaDu and Kyse30 cells were treated with control media (“ctrl.”) and high (9 nM) dose of EGF. Expression of E-cadherin was assessed by IB after 72 hr. Shown are representative immunoblots (upper panels) and mean values with SDs from n = 3 independent experiments. ** p-value < 0.01, *** p-value < 0.001; paired Student t test. Supporting data are compiled in S1 Data. (D) Schematic representation of EpCAM RIP including proteases involved and inhibitors. (E) Immunoprecipitation of the EpEX from supernatants of Kyse30 and HCT8 cells expressing EpCAM-YFP with or without EGF 9 nM. Shown are representative results from n = 3 independent experiments. (F) Visualization of CTF-EpCAM-YFP in membrane isolates of Kyse30 and HCT8 cells expressing EpCAM-YFP with or without EGF 9 nM. Shown are representative results from n = 3 independent experiments. (G) Visualization of EpCAM-YFP, CTF-YFP, and EpICD-YFP in Kyse30 and HCT8 and Kyse30 cells expressing EpCAM-YFP with or without EGF 9 nM in the presence of proteasome inhibitor ß-lactone (“ß-lac,” 50 μM). Shown are representative results from n = 3 independent experiments. (H) Visualization of EpICD-YFP in cytoplasmic (“cyt.”) and nuclear fractions (“nuc.”) of Kyse30 and HCT8 cells expressing EpCAM-YFP with or without EGF 9 nM in the presence of proteasome inhibitor (“ß-lac,” 50 μM). Tubulin and lamin A staining served to control fractionated samples. Shown are representative results from n = 3 independent experiments. (I, J) Indicated cell lines were treated with EGF 1.8 nM and 18 nM for 24 hr, 9 nM for 72 hr, or 1.8 nM TGFα for 24 hr. Expression of EpCAM in control (“w/o EGF”) and treated cells was assessed by flow cytometry (I) and IB (J). Shown are ratios of EpCAM mean fluorescence intensities divided by control intensities (I; “EpCAM/iso”) and relative fold changes of EpCAM expression in whole-cell lysates (J; relative EpCAM fold change), where expression levels in control cells were set to 1 for comparison. Shown are means with SDs from n = 3 independent experiments. ** p-value < 0.01; paired Student t test. Supporting data are compiled in S1 Data. (K) Indicated cell lines were treated with EGF 9 nM for 72 hr, and cell surface expression of EpCAM was assessed by fluorescence immunostaining and laser scanning confocal microscopy. EpCAM: green, nuclei: blue (DAPI). Shown are representative results from n = 3 independent experiments with multiple areas analyzed. CTF, C-terminal fragment; DAPT, N-[N-(3,5-Difluorophenacetyl)-L-alanyl]-S-phenylglycine t-butyl ester; EGF, epidermal growth factor; EMT, epithelial-mesenchymal transition; EpCAM, epithelial cell adhesion molecule; EpEX, extracellular domain of EpCAM; IB, immunoblotting; MW, molecular mass; RIP, regulated intramembrane proteolysis; SD, standard deviation; TGFα, transforming growth factor alpha; YFP, yellow fluorescent protein.
Fig 3
Fig 3. Soluble EpEX-Fc binds to EGFR and induces ERK1/2 and AKT.
(A) Bidirectional co-immunoprecipitation (“IP”) of EGFR and EpCAM in whole-cell lysates of FaDu, Cal27, and HCT8 cells using EGFR- and EpCAM-specific antibodies. Isotype control antibody (“IgG”) served as control. Coimmunoprecipitated EGFR and EpCAM were visualized in immunoblotting with specific antibodies (“IB”), with whole-cell lysates as control (“lysate”). Shown are representative results from n = 3 independent experiments. (B) SNs of Cal27, Kyse30, FaDu, and HCT8 cells were immunoprecipitated with EpEX-specific antibodies and separated under reducing (left) and nonreducing native conditions (right), and EpEX was detected with specific antibodies. Antibody HCs and EpEX mono-, di-, and oligomers are indicated. Shown are representative results from n = 3 independent experiments. (C) EpEX-Fc or Fc were incubated with whole-cell lysates of FaDu and Cal27 and immobilized on protein A agarose beads, and protein complexes were separated on SDS-PAGE. Immunoprecipitated proteins were detected by immunoblotting (“IB”) with Fc- and EGFR-specific antibodies. Shown are representative results from n = 3 independent experiments. (D) EGFRex and EpEX were incubated in the presence or absence of cross-linker (BS3). Where indicated, EGF was added. Monomers, dimers, and EGFRex/EpEX complexes are marked. Shown are representative results from n = 3 independent experiments. (E, F) FaDu, Cal27, and Kyse30 cells were kept untreated (control) or were treated with EpEX-Fc, Fc (10 nM), or EGF (1.8 nM) for the indicated time points. Where indicated, cells were additionally treated with Cetuximab (“Cet.”). Phosphorylation of ERK1/2 (E) and AKT (F) was assessed by immunoblotting with specific antibodies. Levels of ERK1/2 and AKT were assessed in parallel. Shown are representative results from n = 3 independent experiments. (G) FaDu and Cal27 cells were kept untreated or were treated with EGF (9 nM), Fc, or EpEX-Fc (10 nM) for 30 min, and phosphorylation of ERK1/2 and AKT was detected by immunofluorescence laser scanning confocal microscopy (ERK1/2 or AKT: green, nuclei: blue [DAPI]). Shown are representative results from n = 3 independent experiments. (H) FaDu, Cal27, and Kyse30 cells were kept untreated (control) or were treated with EpEX-Fc, Fc (10 nM), or EGF (1.8 nM) for the indicated time points (“EGF 30 min”). Where indicated, MEK1 inhibitor AZD6244 or EGFR inhibitor AG1478 were added. Levels of ERK1/2 and AKT were assessed in parallel. Shown are representative results from n = 3 independent experiments. (I) HEK293 cells were transiently transfected with GFP or EGFR expression plasmids and were either kept untreated (control) or were treated with EpEX-Fc, Fc (10 nM), or EGF (1.8 nM) for 30 min. Expression of EGFR and activation of ERK1/2 were assessed by immunoblotting. Levels of ERK1/2 were assessed in parallel. Shown are representative results from n = 3 independent experiments. (J) Expression of EpCAM and EGFR was assessed in HCT8WT and CRISPR-Cas9 EpCAM K.O.1 [48] by immunoblotting. Levels of actin were assessed in parallel. Shown are representative results from n = 3 independent experiments. (K) HCT8WT and CRISPR-Cas9 EpCAM K.O.1 cells were either kept untreated (control) or were treated with EpEX-Fc, Fc (10 nM), or EGF (1.8 nM) for 30 min. Activation of ERK1/2 was assessed by immunoblotting. Levels of ERK1/2 were assessed in parallel. Shown are representative results from n = 3 independent experiments. BS3, bisulfosuccinimidyl suberate; CRISPR-Cas9, clustered regularly interspaced short palindromic repeat/CRISPR-associated 9; EGF, epidermal growth factor; EGFR, EGF receptor; EGFRex, extracellular domain of EGFR; EpCAM, epithelial cell adhesion molecule; EpCAM K.O.1, EPCAM-knockout clone 1; EpEX, extracellular domain of EpCAM; EpICD, intracellular domain of EpCAM; ERK1/2, extracellular signal–regulated kinase 1/2; Fc, fragment crystallizable region; GFP, green fluorescent protein; HC, heavy chain; HCT8WT, HCT8 wild type; HEK293, human embryonic kidney 293; IgG, immunoglobulin G; MW, molecular mass; pAKT, phosphorylated AKT; pERK, phosphorylated ERK; SN, supernatant.
Fig 4
Fig 4. EpEX-Fc induces EGFR-dependent proliferation but inhibits high-dose EGF-induced EMT.
(A) FaDu and Kyse30 cells were plated at equal numbers and treated with control media, low (1.8 nM) and high (9 nM) doses of EGF, low (1 nM) and high doses (10 nM) of EpEX-Fc, Fc (10 nM), or a combination of EpEXhigh with Cetuximab (“Cet.”). Cell numbers were assessed after 24, 48, and 72 hr. Shown are means with SDs from n = 3 independent experiments. Two-way ANOVA with post hoc multiple testing and Bonferroni correction. * 0.05, ** 0.01; *** 0.001; **** 0.0001. Supporting data are compiled in S1 Data. (B) FaDu and Kyse30 cells were plated at equal numbers and treated with control media, EpEX (10 nM), or a combination of EpEX (10 nM) and Cetuximab (“Cet.”). BrdU incorporation was analyzed after 72 hr. Shown are means with SDs from n = 3 independent experiments. Two-way ANOVA with post hoc multiple testing and Bonferroni correction. * 0.05. Supporting data are compiled in S1 Data. (C) Relative migration of FaDu and Kyse30 cells was assessed in wound healing assays. FaDu, Kyse30, and Cal27 cells were either kept untreated (control) or were treated with Fc (10 nM), EpEX-Fc, EGF, EGF in combination with EpEX (10 nM), or EGF with Cetuximab (“Cet.”). Shown are representative micrograph pictures of cells after 24 hr (Kyse30) and 48 hr (FaDu) from n = 3 independent experiments. (D) Relative migration was quantified from representative micrographs and was normalized for proliferation indexes of each cell line. Shown are means with SDs from n = 3 independent experiments. One-way ANOVA with post hoc multiple testing and Bonferroni correction * p-value < 0.05, ** 0.01; *** 0.001. Supporting data are compiled in S1 Data. BrdU, bromodeoxyuridine; EGF, epidermal growth factor; EGFR, EGF receptor; EMT, epithelial-mesenchymal transition; EpEX, extracellular domain of EpCAM; Fc, fragment crystallizable region; ns, not significant; SD, standard deviation.
Fig 5
Fig 5. EpEX-Fc inhibits EGF-mediated EMT through repression of EMT-TF activation.
(A) FaDu and Kyse30 cells were either kept untreated (control) or were treated with Fc (10 nM), EGFlow (1.8 nM), EGFhigh (9 nM), EpEX-Fc (1–50 nM), or EGFhigh in combination with increasing concentrations of EpEX-Fc (1–50 nM). Shown are representative micrograph pictures of cells after 48 hr (Kyse30) and 72 hr (FaDu) from n = 3 independent experiments. (B) FaDu and Kyse30 cells were either kept untreated (control) or were treated with Fc (10 nM), EGFlow (1.8 nM), EGFhigh (9 nM), EpEX-Fc (10 nM), or EGFhigh in combination with EpEX-Fc (10 nM). After 6 hr and 72 hr, mRNA transcript levels of Snail, Zeb1, and Slug were assessed by qRT-PCR with specific primers. Shown are means with SDs from n = 3 independent experiments performed in triplicates. One-way ANOVA with post hoc multiple testing and Bonferroni correction * p-value < 0.05, ** 0.01; *** 0.001. Supporting data are compiled in S1 Data. EGF, epidermal growth factor; EMT, epithelial-mesenchymal transition; EMT-TF, EMT transcription factor; Fc, fragment crystallizable region; ns, not significant; qRT-PCR, quantitative real-time PCR; SD, standard deviation; Zeb1, zinc finger E-box-binding homeobox 1.
Fig 6
Fig 6. EpEX-Fc inhibits EGF-mediated EMT through modulation of ERK1/2 activity.
(A) FaDu and Kyse30 cells were either kept untreated (control) or were treated with EGF (9 nM) and in combination with Cetuximab (“Cet.”), Erlotinib, AZD6244 (MEK1 inhibitor), and MK2206 (AKT inhibitor). Shown are representative micrograph pictures of cells after 48 hr (Kyse30) and 72 hr (FaDu) from n = 3 independent experiments. (B, C) FaDu and Cal27 cells were treated with EGF (9 nM) for the indicated time points, and ERK1/2 phosphorylation was assessed by immunoblotting. Levels of ERK1/2 were assessed in parallel. Shown are (B) representative results and (C) relative quantifications from n = 3 independent experiments. One-way ANOVA, multiple testing with Bonferroni correction. * p-value < 0.05, ** < 0.01. Supporting data are compiled in S1 Data. (D, E) FaDu cells were treated with EGF (9 nM) or EpEX-Fc (10 nM) for the indicated time points, and ERK1/2 phosphorylation was assessed by immunoblotting. Levels of ERK1/2 were assessed in parallel. Shown are (D) representative results and (E) relative quantifications from n = 3 independent experiments. One-way ANOVA, multiple testing with Bonferroni correction. * p-value < 0.05, ** < 0.01. Supporting data are compiled in S1 Data. (F, G) FaDu cells were treated with EGF (1.8 nM) or EpEX-Fc (10 nM) for the indicated time points, and ERK1/2 phosphorylation was assessed by immunoblotting. Levels of ERK1/2 were assessed in parallel. Shown are (F) representative results and (G) relative quantifications from n = 3 independent experiments. One-way ANOVA, multiple testing with Bonferroni correction. * p-value < 0.05. Supporting data are compiled in S1 Data. (H, I) FaDu and Cal27 cells were either kept untreated (control) or were treated with EGF (9 nM), Fc, EpEX-Fc (each 10 nM), or a combination of EGF and EpEX-Fc for 30 min. Phosphorylation of ERK1/2 was assessed by immunofluorescence laser scanning microscopy. Shown are (H) representative results and (I) relative quantifications from n = 3 independent experiments. One-way ANOVA, multiple testing with Bonferroni correction. **** p-value < 0.0001. Supporting data are compiled in S1 Data. pERK1/2: green, nuclei: blue (DAPI). EGF, epidermal growth factor; EMT, epithelial-mesenchymal transition; EpEX, extracellular domain of epithelial cell adhesion molecule; ERK1/2, extracellular signal–regulated kinase 1/2; Fc, fragment crystallizable region; ns, not significant; pERK1/2, phosphorylated ERK1/2.
Fig 7
Fig 7. EGFR and EpCAM levels are molecular determinants of EMT induction, ERK activation, and migration.
(A) Kyse30 cells were transfected with EGFR-specific siRNAs (pool of n = 4 siRNAs) (EGFR KD), siRNA controls (siRNA ctrl), EpCAM-specific shRNA (EpCAM KD) [54], control shRNA (shRNA ctrl), and a combination of EGFR siRNA and EpCAM shRNA (double KD). Expression of EGFR and EpCAM was assessed by immunoblotting with specific antibodies. Equal loading was confirmed by detecting actin levels. Clinical quadrants’ equivalents are indicated. Shown are representative results from n = 3 independent experiments. (B) Quadrant 1 to 4 equivalents of Kyse30 cell variants were treated with EGFlow (1.8 nM) and EGFhigh (9 nM). Cell morphology was assessed after 72 hr. Shown are representative images from n = 3 independent experiments. (C) Quadrant 1 to 4 equivalents of Kyse30 cell variants were treated with EGFlow (1.8 nM) for the indicated time points, and ERK1/2 phosphorylation was assessed by immunoblotting. Levels of ERK1/2 and actin were assessed in parallel. Shown are representative results from n = 3 independent experiments. (D) Quadrant 1 to 4 equivalents of Kyse30 cell variants were either kept untreated (control) or were treated with EGFlow (1.8 nM). After 72 hr, mRNA transcript levels of Slug were assessed by qRT-PCR with specific primers. Shown are means with SDs from n = 2–3 independent experiments performed in triplicates. One-way ANOVA with post hoc multiple testing and Bonferroni correction * p-values < 0.05, ** 0.01; *** 0.001, **** 0.0001. Supporting data are compiled in S1 Data. (E) Quadrant 1 to 4 equivalents of Kyse30 cell variants were treated with EGFhigh (9 nM) and subjected to a scratch assay. Relative migration was quantified from representative micrographs of each cell line. Shown are means with SDs from n = 3 independent experiments. One-way ANOVA with post hoc multiple testing and Bonferroni correction * p-value < 0.05. Supporting data are compiled in S1 Data. EGF, epidermal growth factor; EGFR, EGF receptor; EpCAM, epithelial cell adhesion molecule; EMT, epithelial-mesenchymal transition; ERK, extracellular signal–regulated kinase; KD, knockdown; pERK1/2, phosphorylated ERK1/2; qRT-PCR, quantitative real-time PCR; SD, standard deviation; shRNA, short hairpin RNA; siRNA, small interfering RNA; WT, wild type.
Fig 8
Fig 8. pERK and Slug are coexpressed and predict poor survival of HNSCC patients.
(A) HNSCC tumors were stained for the expression of pERK1/2 and Slug in consecutive cryosections. Shown are 2 examples each of EGFRlow/EpCAMhigh (patients 1 and 2), EGFRhigh/EpCAMlow (patients 3 and 4), and HNSCCs at 100× and 200× magnification. (B) IHC scores of pERK and Slug were compared in EGFRlow/EpCAMhigh (n = 37) and EGFRhigh/EpCAMlow (n = 39) HNSCCs. Shown are IHC score values with mean (lines) and Student t test. ** p-value < 0.01. Supporting data are compiled in S1 Data. (C) IHC scores of pERK and Slug were compared in a Spearman correlation with r-value and p-value for the entire HNSCC cohort (n = 169/180). Supporting data are compiled in S1 Data. (D) Patients with EGFR and EpCAM expression levels <125 or >175 were included in the survival analysis. OS (n = 98 patients) and DFS (n = 97 patients) were stratified according to pERK and Slug expression (cutoff threshold IHC score median). Patients with expression of pERK1/2 and/or Slug >175 are considered as high expressers (pERK high + Slug high) and were compared to all remaining patients. OS and DFS are represented as Kaplan-Meier survival curves with p-values, HRs, and CIs. Supporting data are compiled in S1 Data. CI, confidence interval; DFS, disease-free survival; EGFR, epidermal growth factor receptor; EpCAM, epithelial cell adhesion molecule; HNSCC, head and neck squamous cell carcinoma; HR, hazard ratio; IHC, immunohistochemistry; OS, overall survival; pERK, phosphorylated extracellular signal–regulated kinase.
Fig 9
Fig 9. Schematic representation of EGF and EpEX cross talk at the EGFR.
Low-dose EGF induces EGFR activation that results in intermediate ERK1/2 phosphorylation and enhanced cell proliferation (left panel). High-dose EGF induces EGFR activation that results in strong ERK1/2 phosphorylation and induction of EMT, including EMT-TFs Snail, Zeb1, and Slug (center-left panel). High-dose EpEX induces EGFR activation that results in intermediate ERK1/2 phosphorylation and enhanced proliferation (center-right panel); low-dose EpEX has no measurable effect on proliferation (right panel). EGF, epidermal growth factor; EGFR, EGF receptor; EMT, epithelial-mesenchymal transition; EMT-TF, EMT transcription factor; EpEX, extracellular domain of EpCAM; ERK1/2, extracellular signal–regulated kinase; PI3K, phosphoinositide 3-kinase; Zeb1, zinc finger E-box-binding homeobox 1.

References

    1. Ferlay J, Soerjomataram I, Dikshit R, Eser S, Mathers C, Rebelo M, et al. Cancer incidence and mortality worldwide: sources, methods and major patterns in GLOBOCAN 2012. Int J Cancer. 2015;136(5):E359–86. 10.1002/ijc.29210 . - DOI - PubMed
    1. Leemans CR, Braakhuis BJ, Brakenhoff RH. The molecular biology of head and neck cancer. Nat Rev Cancer. 2011;11(1):9–22. Epub 2010/12/17. 10.1038/nrc2982 - DOI - PubMed
    1. Hay ED. An overview of epithelio-mesenchymal transformation. Acta Anat (Basel). 1995;154(1):8–20. . - PubMed
    1. Brabletz T, Kalluri R, Nieto MA, Weinberg RA. EMT in cancer. Nat Rev Cancer. 2018. 10.1038/nrc.2017.118 . - DOI - PubMed
    1. Lambert AW, Pattabiraman DR, Weinberg RA. Emerging Biological Principles of Metastasis. Cell. 2017;168(4):670–91. 10.1016/j.cell.2016.11.037 . - DOI - PMC - PubMed

Publication types

MeSH terms