. 2018 Sep 26;6(4):23.
doi: 10.3390/jdb6040023.

Protein Kinase A Signaling Inhibits Iridophore Differentiation in Zebrafish

Affiliations

Protein Kinase A Signaling Inhibits Iridophore Differentiation in Zebrafish

Cynthia D Cooper et al. J Dev Biol. .

Abstract

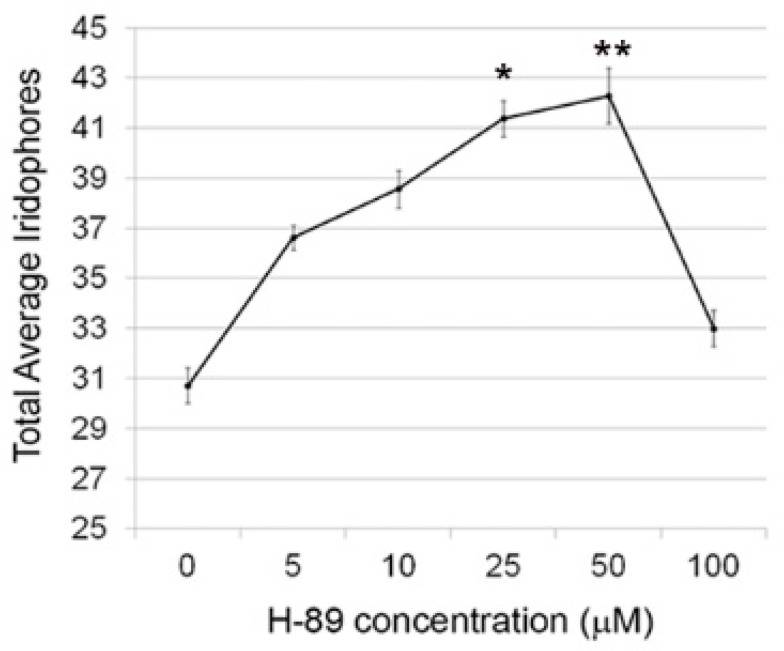
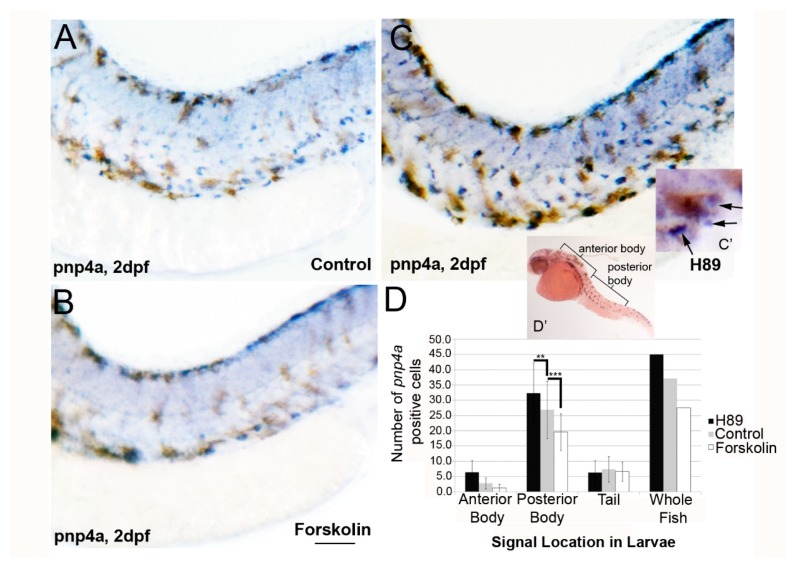
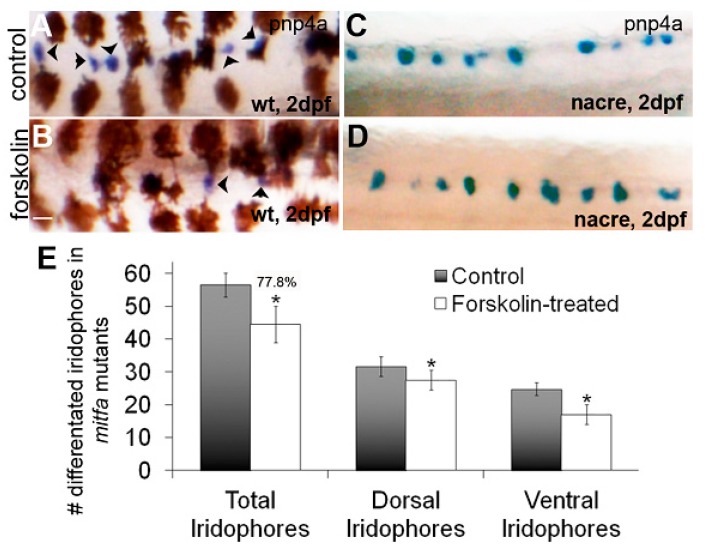
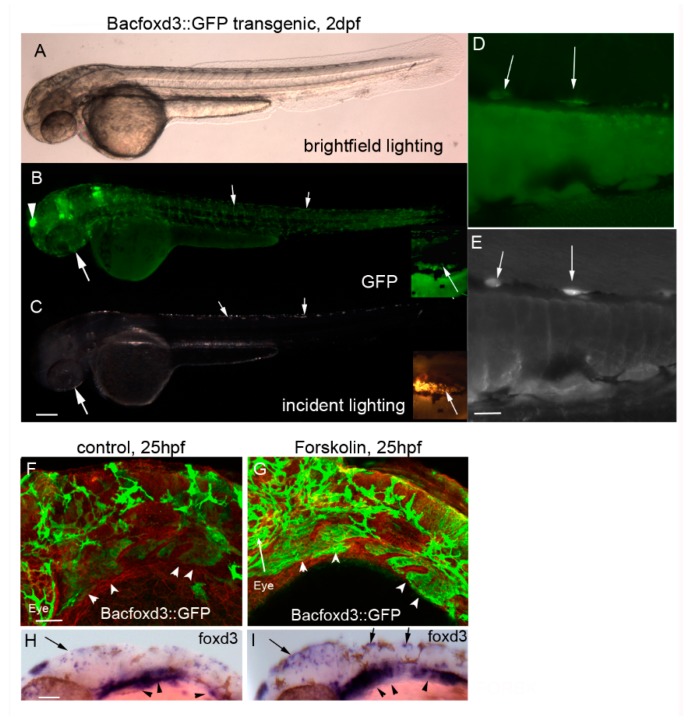
In zebrafish (Danio rerio), iridophores are specified from neural crest cells and represent a tractable system for examining mechanisms of cell fate and differentiation. Using this system, we have investigated the role of cAMP protein kinase A (PKA) signaling in pigment cell differentiation. Activation of PKA with the adenylyl cyclase activator forskolin reduces the number of differentiated iridophores in wildtype larvae, with insignificant changes to melanophore number. Inhibition of PKA with H89 significantly increases iridophore number, supporting a specific role for PKA during iridophore development. To determine the effects of altering PKA activity on iridophore and melanophore gene expression, we examined expression of iridophore marker pnp4a, melanophore marker mitfa, and the mitfa repressor foxd3. Consistent with our cell counts, forskolin significantly decreased pnp4a expression as detected by in situ hybridization and quantification of pnp4a+ cells. Forskolin had the opposite effect on mitfa and foxd3 gene activity, increasing the area of expression. As mitfa/nacre mutants have extra iridophores as compared to wildtype larvae, we examined the function of mitfa during PKA-sensitive iridophore development. Forskolin treatment of mitfa/nacre mutants did significantly reduce the number of iridophores but to a lesser extent than that observed in treated wildtype larvae. Taken together, our data suggests that PKA inhibits iridophore development in a subset of iridophore precursors, potentially via a foxd3-independent pathway.

Keywords: PKA signaling; differentiation; forskolin; iridophores; melanophores; mitfa; pnp4a.


Conflict of interest statement

The authors declare no conflict of interest.

Figures

Figure 1
Figure 1
Forskolin treatment reduces iridophore number in zebrafish larvae at 4 days post fertilization (dpf). (A,B) Lateral images (using an incident lighting source) of larvae at 4 dpf treated with 0.1% dimethyl sulfoxide (DMSO) or 5 µM forskolin in embryo media. Forskolin-treated individuals have fewer iridophores, especially in the ventral stripe (arrowheads). Scale bar = 200 um and applies to panels A and BC) Quantification of total, dorsal stripe, and ventral stripe iridophores (n = 8–10 larvae per condition). Forskolin treatment leads to a 38.4% reduction in differentiated iridophores (62.6% of control number). (D) Quantification of melanophores following 0.1% DMSO or 5 µM forskolin treatment. Total melanophores include dorsal, lateral, and ventral stripes (n = 8–10 larvae per condition), showing no significant change following forskolin treatment.
Figure 2
Figure 2
H89 treatment increases iridophore number in zebrafish larvae at 4 dpf. Quantification of iridophores following treatment of wildtype embryos with varying doses of the protein kinase A (PKA) inhibitor H89. One-way ANOVA with Bonferonni multiple comparison post-test indicates that doses of 25 µM and 50 µM are statistically significant (* p < 0.05 or ** p < 0.01).
Figure 3
Figure 3
Forskolin treatment reduces iridoblast marker pnp4a expression. (AC) Lateral brightfield images of larvae at 2 dpf processed for in situ hybridization using pnp4a probes, following treatment with 0.1% DMSO (A), 5 µM forskolin (B), or 25 µM H-89 (C) in embryo media. Activation of adenylyl cyclase (and PKA signaling) reduces the levels of pnp4a expression, whereas inhibition of PKA has the converse effect (increased pnp4a expression). Scale bar = 200 um andapplies to all images. (C’) Representative image with black arrows showing blue/purple pnp4+ cells included in panel D quantification. Brown melanophores were not included in counts. (D) Quantification of pnp4a+ cells confirms a significant reduction and increase in the number of pnp4a+ cells following forskolin and H-89 treatment, respectively (** p < 0.01 and *** p < 0.0001 via two-way ANOVA and Bonferonni multiple comparison analysis). (D’) The quantified regions are labeled.
Figure 4
Figure 4
Forskolin treatment expands mitfa expression at 28 hpf. (A,B) Brightfield images of lateral tail regions of 28-h-old wildtype control and forskolin-treated embryos processed for in situ hybridization using mitfa probe. Note increased mitfa expression in the dorsal tail. Scale bar = 100 um and applies to both images.
Figure 5
Figure 5
A subset of mitfa negative iridoblasts is resistant to PKA signaling. (AD) Brightfield images of dorsal trunks of wildtype or nacre/mitfa mutant larvae at 2 dpf treated with 0.1% DMSO or 5 µM forskolin and processed for in situ hybridization using a pnp4a probe. A reduction in pnp4a is detected in wildtype (as previously observed) but not in nacre/mitfa larvae. Scale bar = 100 um and applies to all images. (E) Quantification of differentiated iridophores in 0.1% DMSO or 5 µM forskolin-treated nacre/mitfa larvae. We note a significant, yet attenuated reduction in iridophores with mitfa loss of function (22.2% reduction in iridophores or 77.8% of control). The reductions are significant via Student’s t-test (p < 0.05).
Figure 6
Figure 6
Forskolin increases expression of the mitfa transcriptional repressor foxd3. (AC) 10× magnification of Bacfoxd3::GFP transgenic larvae at 2 dpf. Transgenic zebrafish express GFP in foxd3-dependent cells including the pineal gland (arrowhead) and presumptive iridophores (arrows). Scale bar in panel C = 200 um and applies to panels A–C. (DE) 20× magnification of BACfoxd3::GFP zebrafish. Arrows indicate cells co-expressing GFP and iridescence typically observed in iridophores. The scale bar in panel E = 100 um and applies to panels D and E. (F,G) 20× magnification of 25 hpf 0.1% DMSO or 5 µM forskolin-treated BACfoxd3::GFP transgenic fish processed for immunocytochemistry using anti-GFP and anti-beta catenin antibodies (red). Forskolin treatment leads to an increase in GFP (arrowheads indicate pharyngeal arches), indicating expanded domains of foxd3 expression. Scale bar in panel F = 100 um and applies to panels F and G. (H,I) 0.1% DMSO and 5 µM forskolin-treated wildtype embryos processed for in situ hybridization using the foxd3 probe. Forskolin expands the areas of foxd3 expression, notably in the dorsal head and trunk regions (arrows) which are locations of presumptive iridophores, and in pharyngeal arch neural crest streams (arrowheads). Scale bar in panel H = 100 um and applies to panels H and I.

References

    1. Fujii R. The regulation of motile activity in fish chromatophores. Pigment Cell Res. 2000;13:300–319. doi: 10.1034/j.1600-0749.2000.130502.x. - DOI - PubMed
    1. Beirl A.J., Linbo T.H., Cobb M.J., Cooper C.D. oca2 regulation of chromatophore differentiation and number is cell type specific in zebrafish. Pigment Cell Melanoma Res. 2014;27:178–189. doi: 10.1111/pcmr.12205. - DOI - PubMed
    1. Clancey L.F., Beirl A.J., Linbo T.H., Cooper C.D. Maintenance of Melanophore Morphology and Survival Is Cathepsin and vps11 Dependent in Zebrafish. PLoS ONE. 2013;8:e65096. doi: 10.1371/journal.pone.0065096. - DOI - PMC - PubMed
    1. Cooper C.D., Linbo T.H., Raible D.W. Kit and foxd3 genetically interact to regulate melanophore survival in zebrafish. Dev. Dyn. 2009;238:875–886. doi: 10.1002/dvdy.21910. - DOI - PMC - PubMed
    1. Hultman K.A., Bahary N., Zon L.I., Johnson S.L. Gene Duplication of the zebrafish kit ligand and partitioning of melanocyte development functions to kit ligand a. PLoS Genet. 2007;3:e17. doi: 10.1371/journal.pgen.0030017. - DOI - PMC - PubMed

LinkOut - more resources