A Novel Role for the Interleukin-1 Receptor Axis in Resistance to Anti-EGFR Therapy
- PMID: 30261609
- PMCID: PMC6210663
- DOI: 10.3390/cancers10100355
A Novel Role for the Interleukin-1 Receptor Axis in Resistance to Anti-EGFR Therapy
Abstract
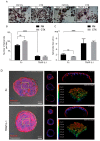
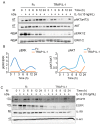
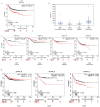
Cetuximab (CTX) is a monoclonal antibody targeting the epidermal growth factor receptor (EGFR), commonly used to treat patients with metastatic colorectal cancer (mCRC). Unfortunately, objective remissions occur only in a minority of patients and are of short duration, with a population of cells surviving the treatment and eventually enabling CTX resistance. Our previous study on CRC xenopatients associated poor response to CTX with increased abundance of a set of pro-inflammatory cytokines, including the interleukins IL-1A, IL-1B and IL-8. Stemming from these observations, our current work aimed to assess the role of IL-1 pathway activity in CTX resistance. We employed a recombinant decoy TRAP IL-1, a soluble protein combining the human immunoglobulin Fc portion linked to the extracellular region of the IL-1-receptor (IL-1R1), able to sequester IL-1 directly from the medium. We generated stable clones expressing and secreting a functional TRAP IL-1 into the culture medium. Our results show that IL-1R1 inhibition leads to a decreased cell proliferation and a dampened MAPK and AKT axes. Moreover, CRC patients not responding to CTX blockage displayed higher levels of IL-1R1 than responsive subjects, and abundant IL-1R1 is predictive of survival in patient datasets specifically for the consensus molecular subtype 1 (CMS1). We conclude that IL-1R1 abundance may represent a therapeutic marker for patients who become refractory to monoclonal antibody therapy, while inhibition of IL-1R1 by TRAP IL-1 may offer a novel therapeutic strategy.
Keywords: MAPK; cetuximab; colon cancer; colonspheres; consensus molecular subtype; inflammation; resistance.
Conflict of interest statement
The authors declare no conflict of interest.
Figures


Similar articles
-
Senescence-associated reprogramming induced by interleukin-1 impairs response to EGFR neutralization.Cell Mol Biol Lett. 2022 Mar 2;27(1):20. doi: 10.1186/s11658-022-00319-7. Cell Mol Biol Lett. 2022. PMID: 35236282 Free PMC article.
-
Glucocorticoid Receptor Modulates EGFR Feedback upon Acquisition of Resistance to Monoclonal Antibodies.J Clin Med. 2019 May 1;8(5):600. doi: 10.3390/jcm8050600. J Clin Med. 2019. PMID: 31052457 Free PMC article.
-
A module of inflammatory cytokines defines resistance of colorectal cancer to EGFR inhibitors.Oncotarget. 2016 Nov 1;7(44):72167-72183. doi: 10.18632/oncotarget.12354. Oncotarget. 2016. PMID: 27708224 Free PMC article.
-
Cetuximab: an epidermal growth factor receptor chemeric human-murine monoclonal antibody.Drugs Today (Barc). 2005 Feb;41(2):107-27. doi: 10.1358/dot.2005.41.2.882662. Drugs Today (Barc). 2005. PMID: 15821783 Review.
-
Cetuximab: an epidermal growth factor receptor monoclonal antibody for the treatment of colorectal cancer.Clin Ther. 2005 Jun;27(6):684-94. doi: 10.1016/j.clinthera.2005.06.003. Clin Ther. 2005. PMID: 16117976 Review.
Cited by
-
A preliminary analysis of interleukin-1 ligands as potential predictive biomarkers of response to cetuximab.Biomark Res. 2019 Jul 16;7:14. doi: 10.1186/s40364-019-0164-0. eCollection 2019. Biomark Res. 2019. PMID: 31346466 Free PMC article.
-
Senescence-associated reprogramming induced by interleukin-1 impairs response to EGFR neutralization.Cell Mol Biol Lett. 2022 Mar 2;27(1):20. doi: 10.1186/s11658-022-00319-7. Cell Mol Biol Lett. 2022. PMID: 35236282 Free PMC article.
-
IL-1β enhances cell viability and decreases 5-FU sensitivity in novel colon cancer cell lines derived from African American patients.Front Oncol. 2022 Dec 1;12:1010380. doi: 10.3389/fonc.2022.1010380. eCollection 2022. Front Oncol. 2022. PMID: 36531053 Free PMC article.
-
The autocrine loop of ALK receptor and ALKAL2 ligand is an actionable target in consensus molecular subtype 1 colon cancer.J Exp Clin Cancer Res. 2022 Mar 29;41(1):113. doi: 10.1186/s13046-022-02309-1. J Exp Clin Cancer Res. 2022. PMID: 35351152 Free PMC article.
-
IL-1 and senescence: Friends and foe of EGFR neutralization and immunotherapy.Front Cell Dev Biol. 2023 Jan 12;10:1083743. doi: 10.3389/fcell.2022.1083743. eCollection 2022. Front Cell Dev Biol. 2023. PMID: 36712972 Free PMC article. Review.
References
LinkOut - more resources
Full Text Sources
Other Literature Sources
Research Materials
Miscellaneous

