. 2018 Sep 26;19(10):2924.
doi: 10.3390/ijms19102924.

Genome Wide Transcriptome Analysis Reveals Complex Regulatory Mechanisms Underlying Phosphate Homeostasis in Soybean Nodules

Affiliations

Genome Wide Transcriptome Analysis Reveals Complex Regulatory Mechanisms Underlying Phosphate Homeostasis in Soybean Nodules

Yingbin Xue et al. Int J Mol Sci. .

Abstract

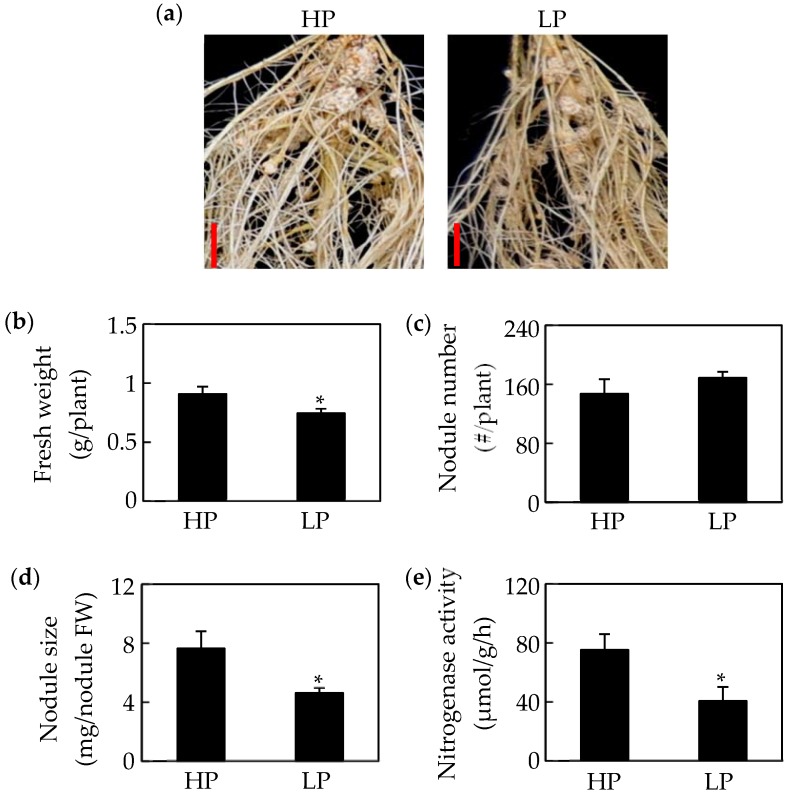
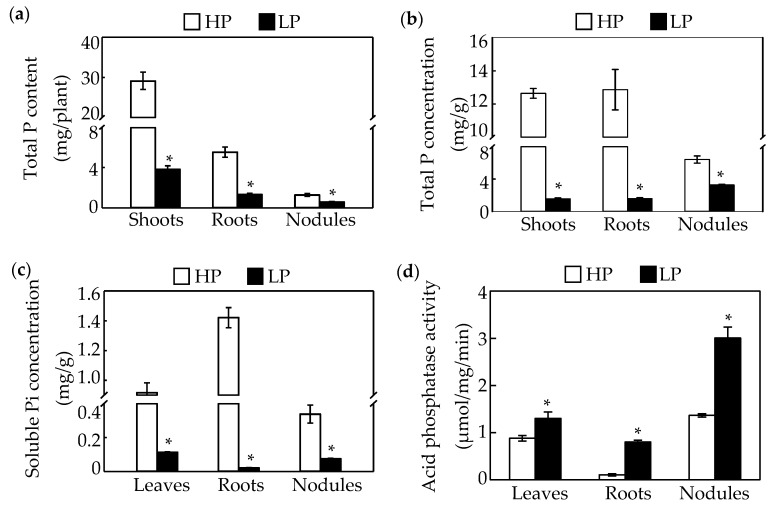
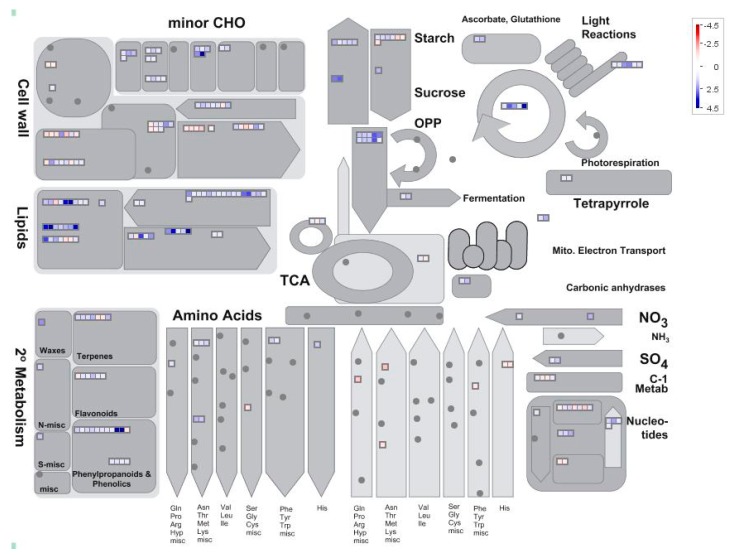
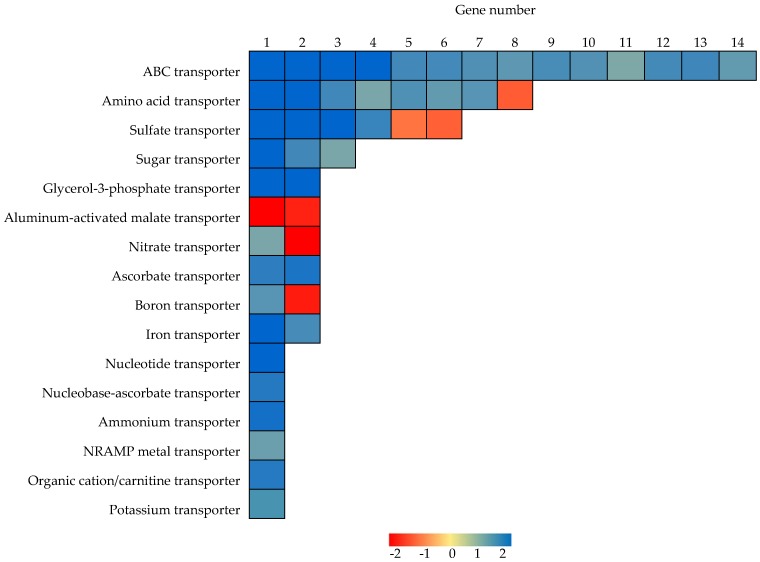
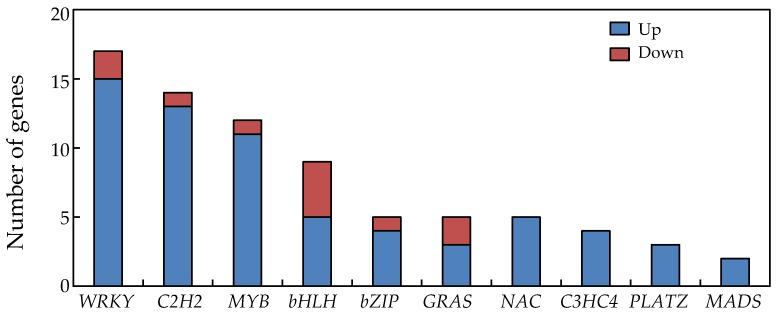
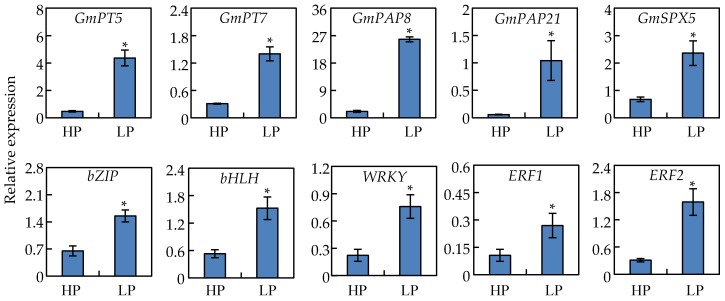
Phosphorus (P) deficiency is a major limitation for legume crop production. Although overall adaptations of plant roots to P deficiency have been extensively studied, only fragmentary information is available in regard to root nodule responses to P deficiency. In this study, genome wide transcriptome analysis was conducted using RNA-seq analysis in soybean nodules grown under P-sufficient (500 μM KH₂PO₄) and P-deficient (25 μM KH₂PO₄) conditions to investigate molecular mechanisms underlying soybean (Glycine max) nodule adaptation to phosphate (Pi) starvation. Phosphorus deficiency significantly decreased soybean nodule growth and nitrogenase activity. Nodule Pi concentrations declined by 49% in response to P deficiency, but this was well below the 87% and 88% decreases observed in shoots and roots, respectively. Nodule transcript profiling revealed that a total of 2055 genes exhibited differential expression patterns between Pi sufficient and deficient conditions. A set of (differentially expressed genes) DEGs appeared to be involved in maintaining Pi homeostasis in soybean nodules, including eight Pi transporters (PTs), eight genes coding proteins containing the SYG1/PHO81/XPR1 domain (SPXs), and 16 purple acid phosphatases (PAPs). The results suggest that a complex transcriptional regulatory network participates in soybean nodule adaption to Pi starvation, most notable a Pi signaling pathway, are involved in maintaining Pi homeostasis in nodules.

Keywords: P deficiency; RNA-seq; nodule; soybean; symbiotic nitrogen fixation.


Conflict of interest statement

The authors declare no conflict of interest.

Figures

Figure 1
Figure 1
Effects of phosphorus (P) deficiency on soybean nodule growth. (a) Phenotype of soybean nodules at two P levels. (b) Soybean fresh weight. (c) Nodule number. (d) Nodule size. (e) Nodule nitrogenase activity. Data in the figure are mean of four replicates with standard error bars. Asterisks indicate significant difference between HP (500 μM KH2PO4) and LP (25 μM KH2PO4) treatments in the Student’s t-test (*: p < 0.05). Bars = 1 cm.
Figure 2
Figure 2
Effects of P deficiency on phosphate (Pi) accumulation and acid phosphatase (APase) activity in soybean. (a) Total P content of shoots, roots, and nodules. (b) Total Pi concentrations in shoots, roots, and nodules. (c) Soluble Pi concentrations in leaves, roots, and nodules. (d) Acid phosphatase activity of leaves, roots, and nodules. Data in the figure are mean of four replicates with standard error bars. Asterisks indicate significant difference between HP and LP treatments in the Student’s t-test (*: p < 0.05).
Figure 3
Figure 3
MapMan analysis of differentially expressed genes in soybean nodules. In the color scale, blue and red represent up-regulated and down-regulated expression, respectively, in response to Pi starvation within soybean nodules. Black dots represent no gene enrichment to the category entries. Numbers represent fold changes in expression levels expressed as Log2(LP/HP).
Figure 4
Figure 4
Heatmap analysis of P responsive DEGs associated with transport in nodules. Blue and red represent up-regulated and down-regulated expression, respectively, in response to Pi starvation within soybean nodules. Numbers represent fold changes in expression levels expressed as Log2(LP/HP).
Figure 5
Figure 5
Differentially expressed genes associated with transcription factor activity in soybean nodules.
Figure 6
Figure 6
qRT-PCR analysis of ten Pi responsive genes in soybean nodules under Pi sufficient (HP) and deficient (LP) conditions. Data in the figure are mean of four replicates with standard error. Asterisks indicate significant difference between HP and LP treatments in the Student’s t-test (*: p < 0.05).

Similar articles

Cited by

References

    1. Raghothama K.G. Phosphate acquisition. Annu. Rev. Plant Biol. 1999;50:665–693. doi: 10.1146/annurev.arplant.50.1.665. - DOI - PubMed
    1. Richardson A.E. Regulating the phosphorus nutrition of plants: Molecular biology meeting agronomic needs. Plant Soil. 2009;322:17–24. doi: 10.1007/s11104-009-0071-5. - DOI
    1. Beardsley T.M. Peak phosphorus. Bioscience. 2011;61:91. doi: 10.1525/bio.2011.61.2.1. - DOI
    1. Veneklaas E.J., Lambers H., Bragg J., Finnegan P.M., Lovelock C.E., Plaxton W.C., Price C.A., Scheible W.R., Shane M.W., White P.J., et al. Opportunities for improving phosphorus-use efficiency in crop plants. New Phytol. 2012;195:306–320. doi: 10.1111/j.1469-8137.2012.04190.x. - DOI - PubMed
    1. Zhang Z., Liao H., Lucas W. Molecular mechanisms underlying phosphate sensing, signaling and adaptation in plants. J. Integr. Plant Biol. 2014;56:192–220. doi: 10.1111/jipb.12163. - DOI - PubMed

MeSH terms