. 2018 Sep 26;19(10):2928.
doi: 10.3390/ijms19102928.

Mapping the Contact Sites of the Escherichia coli Division-Initiating Proteins FtsZ and ZapA by BAMG Cross-Linking and Site-Directed Mutagenesis

Affiliations

Mapping the Contact Sites of the Escherichia coli Division-Initiating Proteins FtsZ and ZapA by BAMG Cross-Linking and Site-Directed Mutagenesis

Winfried Roseboom et al. Int J Mol Sci. .

Abstract

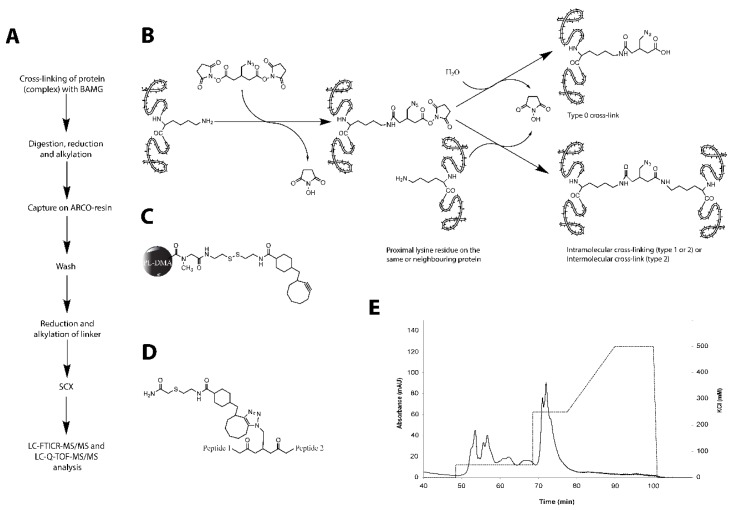
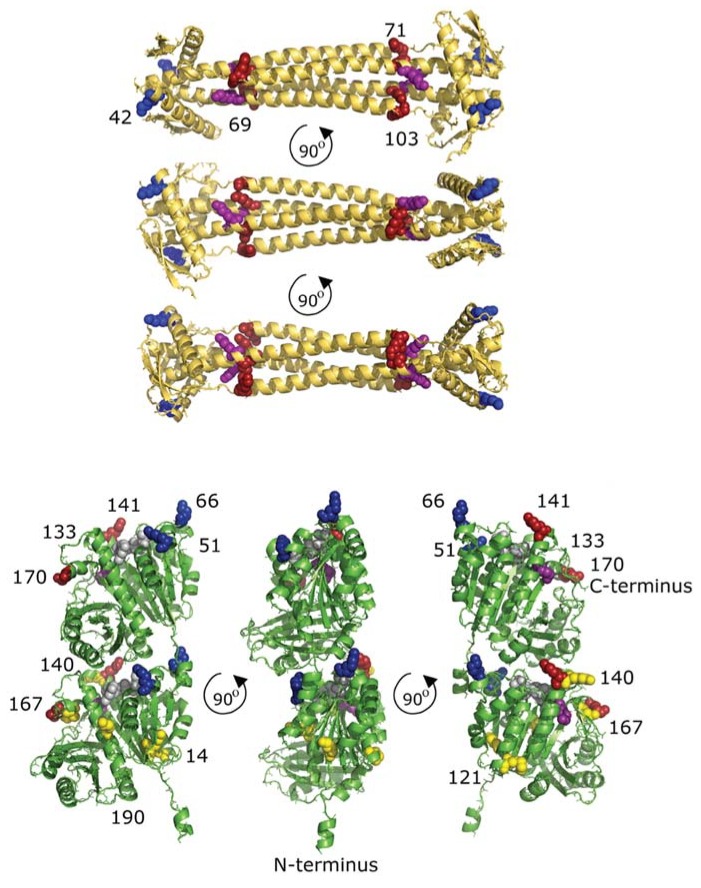
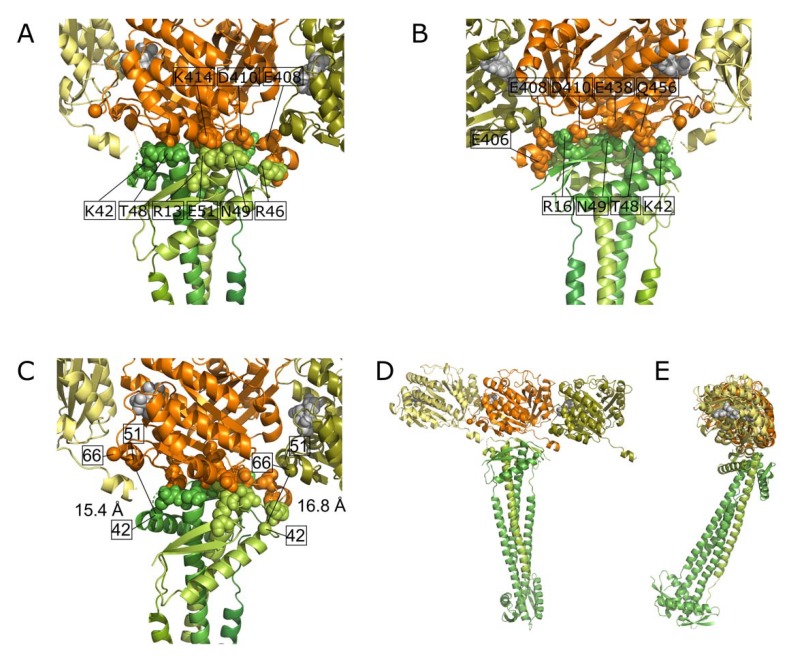
Cell division in bacteria is initiated by the polymerization of FtsZ at midcell in a ring-like structure called the Z-ring. ZapA and other proteins assist Z-ring formation and ZapA binds ZapB, which senses the presence of the nucleoids. The FtsZ⁻ZapA binding interface was analyzed by chemical cross-linking mass spectrometry (CXMS) under in vitro FtsZ-polymerizing conditions in the presence of GTP. Amino acids residue K42 from ZapA was cross-linked to amino acid residues K51 and K66 from FtsZ, close to the interphase between FtsZ molecules in protofilaments. Five different cross-links confirmed the tetrameric structure of ZapA. A number of FtsZ cross-links suggests that its C-terminal domain of 55 residues, thought to be largely disordered, has a limited freedom to move in space. Site-directed mutagenesis of ZapA reveals an interaction site in the globular head of the protein close to K42. Using the information on the cross-links and the mutants that lost the ability to interact with FtsZ, a model of the FtsZ protofilament⁻ZapA tetramer complex was obtained by information-driven docking with the HADDOCK2.2 webserver.

Keywords: 1,4-bis(succimidyl)-3-azidomethylglutarate (BAMG); Filamenting temperature sensitive Z (FtsZ); Fourier-Transform Ion Cyclotron Resonance mass spectrometry(FTICR); Z associated protein A (ZapA); cell division; quadrupole time of flight mass spectrometer (QTOF).


Conflict of interest statement

The authors declare no conflict of interest.

Figures

Figure 1
Figure 1
Overview of the used cross-linking methodology and terminology. (A) experimental work flow. Proteins are incubated with the azide-containing cross-linker bis(succinimidyl)-3-azidomethyl glutarate (BAMG). After cross-linking, proteins are digested and the obtained peptide mixture is incubated with the azide-reactive cyclooctyne (ARCO) resin to capture the cross-linked peptides out of the bulk of unmodified peptides. After cleavage from the resin, enriched peptides are fractionated by strong cation exchange (SCX) chromatography and analyzed by mass spectrometry. (B) structure of BAMG and its reactions with lysine residues in proteins. BAMG can react with a single lysine residue, the other reactive half of the cross-linker becoming either hydrolyzed or reacted with the quenching agent used to stop further cross-linking (type 0 cross-link), or it can react with two proximal lysine residues (type 1 or type 2 cross-linking). A type 1 cross-link occurs between two lysine residues in the same peptide after proteolytic digestion, while a type 2 cross-link connects lysine residues in different peptides. A type 2 cross-link can be formed in the same protein (intramolecular cross-linking) or between two different neighboring proteins (intermolecular cross-linking). BAMG adds 169.1 Da to a type 0 cross-linked peptide and 151.0 Da to type 1 and type 2 cross-linked peptides. (C) ARCO-resin, consisting of a poly-dimethylacrylamide solid support, a disulphide as a cleavable linker, and a cyclooctyne as a reactive group towards azides. Via the strain-promoted azide–alkyne cycloaddition, azide-containing peptides are captured on the resin. (D) enriched type 2 cross-linked peptides. The modification adds 509.2 Da to type 1 and type 2 cross-links and 527.2 Da to type 0 cross-links. (E) SCX chromatogram of enriched peptides. Type 0 and type 1 cross-linked peptides (solid line) elute predominantly at 50 mM KCl (dashed line), while elution of most type 2 cross-links occurs at a higher KCl concentration.
Figure 2
Figure 2
The ZapA structure (4P1M, [18]) in yellow and a model of the Escherichia coli FtsZ structure [38] in green with lysines involved in cross-links indicated. The K42 of ZapA cross-links with K51 and K66 of FtsZ (all blue). K71 and K103 (red) cross-link with each other and K71 cross-links with K69 (purple). In the upper molecule of the FtsZ dimer, the lysines that were found to cross-link are indicated. The C-terminal K380, which is not resolved in the model of the crystal structure, cross-links with K133 and K170 (both in red) and with K51 and K66. K141 in FtsZ also cross-links with K133 (purple). In the lower FtsZ molecule, the lysines that did not provide cross-links are indicated in yellow. The GTP connecting the two FtsZ monomers is shown in grey.
Figure 3
Figure 3
Fourier-transform ion cyclotron resonance (FTICR) mass spectra of the cross-link formed in FtsZ between K380 and K170. In the presence of ZapA, only intraprotein cross-links are formed (trace B). In the absence of ZapA and in the presence of Ca2+, a mixture of intraprotein and interprotein cross-links are formed (trace A). Cross-link experiments were carried out with 14N- and 15N-labelled FtsZ added to the reaction medium in a 1:1 ratio. The monoisotopic peaks in the 14N- (left) and 15N-(right) labelled peptides are marked m. Composing peptides of an intramolecular cross-link are either both 14N-labelled (A, left spectrum) or 15N-labelled (A, right spectrum). The peak marked with the asterisk indicates that the extent of 15N labelling was about 95%. The presence of interprotein cross-links is revealed by the hybrid 14N(LLKVGLR)–15N(KQAD) (a) and the hybrid 15N(LLKVGLR)–14N(KQAD) (b) spectra. A pure interprotein cross-link is revealed by a 1:1:1:1 peak intensity ratio of the four spectra. In a mixture of intraprotein and interprotein cross-links, the hybrid spectra have a lower intensity than the 14N and the 15N spectra.
Figure 4
Figure 4
Q-TOF MS/MS spectrum of a cross-linked peptide with K42 from ZapA connected to K51 from FtsZ. Product ions from peptide α and peptide β are annotated according to [37]. The inset shows the structure of the cross-linked peptide, the positions of cleaved bonds, and types of produced ions. P, precursor ion; p0, precursor ion with H2O loss. Five products resulting from cleavages in the cross-link remnant are indicated in the structure and corresponding mass peaks by square, star, triangle, diamond and black dot.
Figure 5
Figure 5
Map of diameter and map of fluorescence profiles and average fluorescence profile of FtsZ, ZapA, and ZapB of TB28∆zapA [10] expressing ZapA mutants from plasmid. The cells were grown exponentially in rich medium at 37 °C and the OD600 was kept below 0.3. Expression of the mutants was induced with 50 µM IPTG for six mass doublings. Cells were fixed and immunolabeled as described in the experimental procedures. Of each sample, from left to right the map of diameter of the FtsZ-labeled sample, the map of fluorescence of the FtsZ-labeled sample, the map of fluorescence of the ZapA-labeled sample, and the map of fluorescence of the ZapB labeled sample is shown. The cells are sorted according to their length in the maps (small cells on top and the longest cell on the bottom of the map). The number of analyzed cells is indicated and the percentage of cells with a cell length of more than 10 µm and the S.E.M. from a number (n) of experiments as indicated are shown. Brightness and contrast reflect the grey values within the map of fluorescence. EV is TB28∆zapA containing the plasmid pTHV037 [4] with the same resistance marker but without the ZapA gene. All mutants are shown in the supporting information Figure S4.
Figure 6
Figure 6
Weakly and non-complementing mutants in ZapA. The E. coli ZapA tetramer [18] is shown with two molecules in limon and two in green. The weakly complementing mutant amino acid residues (D32, T48, R46, E109) made in the present study are shown in cyan, the non-complementing residues (R13, E51, I56) are in red, and the complementing residues (N35 and Q39) in grey. Residue K42, which was cross-linked to FtsZ and which mutated versions were weakly complementing, is shown in blue.
Figure 7
Figure 7
Haddock model of the interaction between a FtsZ filament and the ZapA tetramer. (A) and (B). Front and back side view of a closeup of the interaction site with the interacting amino acid residues of both proteins indicated. (C) Distances between the Cα atoms (spheres) of residue K42 of ZapA and residues K51 and K66 of FtsZ that were found to cross-link. (D) Front and side view of the interacting proteins. (E) Frontal overview of a FtsZ filament consisting of three monomers and the interacting ZapA tetramer. (D) Side view of the same molecules with a second FtsZ filament and the cytoplasmic membrane indicated. The grey spheres at the interface of the FtsZ monomers is GTP.

Similar articles

Cited by

References

    1. Den Blaauwen T., Hamoen L.W., Levin P.A. The divisome at 25: The road ahead. Curr. Opin. Microbiol. 2017;36:85–94. doi: 10.1016/j.mib.2017.01.007. - DOI - PMC - PubMed
    1. Den Blaauwen T., Buddelmeijer N., Aarsman M.E., Hameete C.M., Nanninga N. Timing of FtsZ assembly in Escherichia coli. J. Bacteriol. 1999;181:5167–5175. - PMC - PubMed
    1. Van der Ploeg R., Verheul J., Vischer N.O.E., Alexeeva S., Hoogendoorn E., Postma M., Banzhaf M., Vollmer W., den Blaauwen T. Colocalization and interaction between elongasome and divisome during a preparative cell division phase in Escherichia coli. Mol. Microbiol. 2013;87:1074–1087. doi: 10.1111/mmi.12150. - DOI - PubMed
    1. Den Blaauwen T., Aarsman M.E.G., Vischer N.O.E., Nanninga N. Penicillin-binding protein PBP2 of Escherichia coli localizes preferentially in the lateral wall and at mid-cell in comparison with the old cell pole. Mol. Microbiol. 2003;47:539–547. doi: 10.1046/j.1365-2958.2003.03316.x. - DOI - PubMed
    1. De Pedro M.A., Quintela J.C., Höltje J.V., Schwarz H. Murein segregation in Escherichia coli. J. Bacteriol. 1997;179:2823–2834. doi: 10.1128/jb.179.9.2823-2834.1997. - DOI - PMC - PubMed

MeSH terms

LinkOut - more resources