. 2018 Sep 27;19(10):2939.
doi: 10.3390/ijms19102939.

Chemical Exposure-Induced Changes in the Expression of Neurotrophins and Their Receptors in the Main Olfactory System of Mice Lacking TRPM5-Expressing Microvillous Cells

Affiliations

Chemical Exposure-Induced Changes in the Expression of Neurotrophins and Their Receptors in the Main Olfactory System of Mice Lacking TRPM5-Expressing Microvillous Cells

Abdullah AlMatrouk et al. Int J Mol Sci. .

Abstract

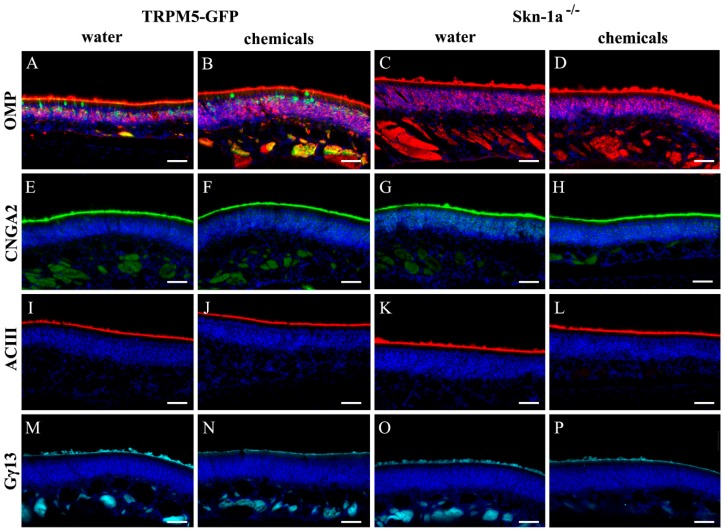
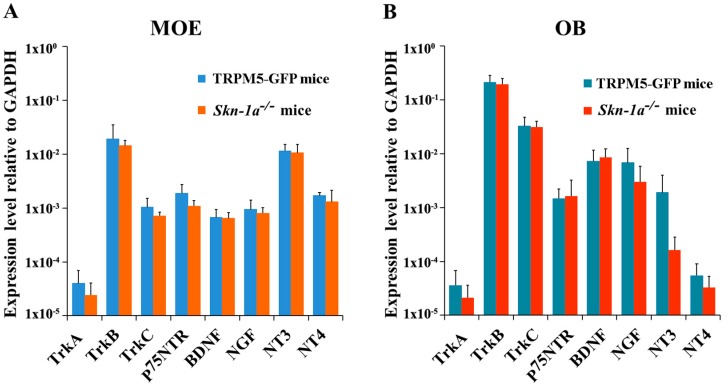
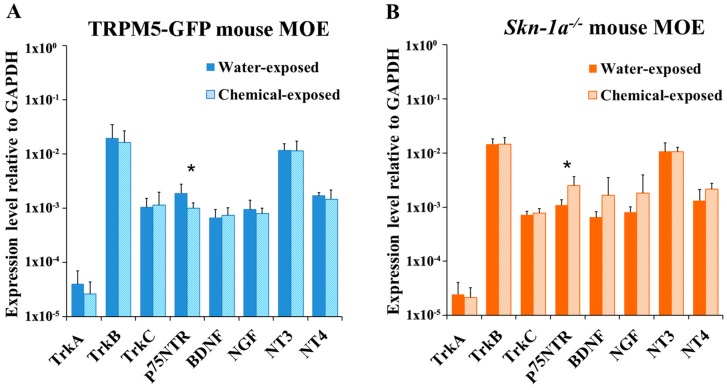
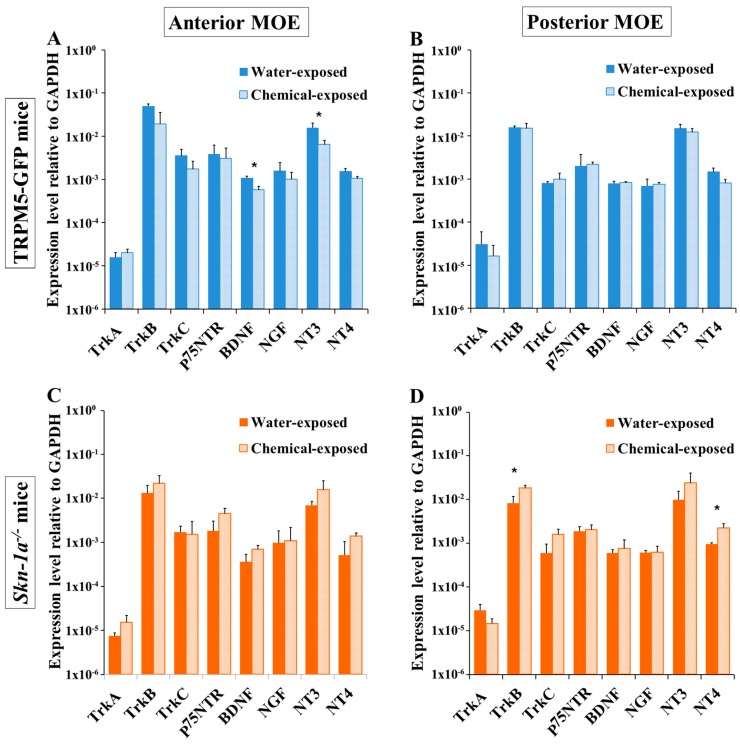
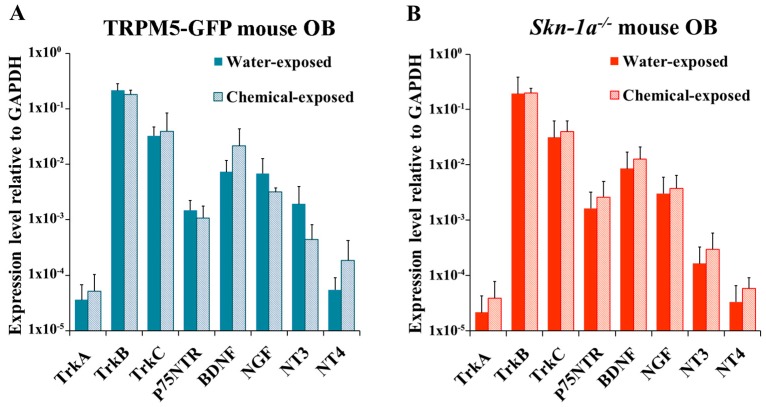
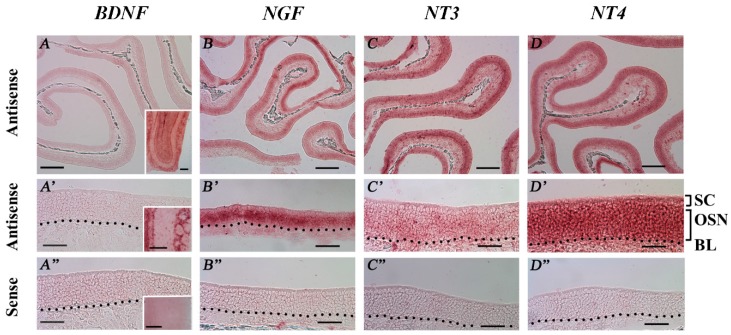
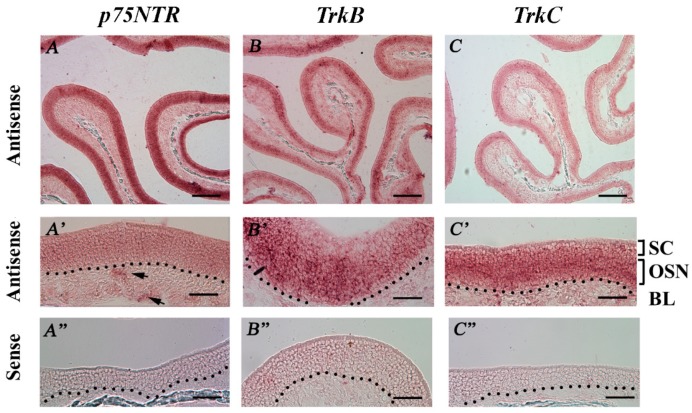
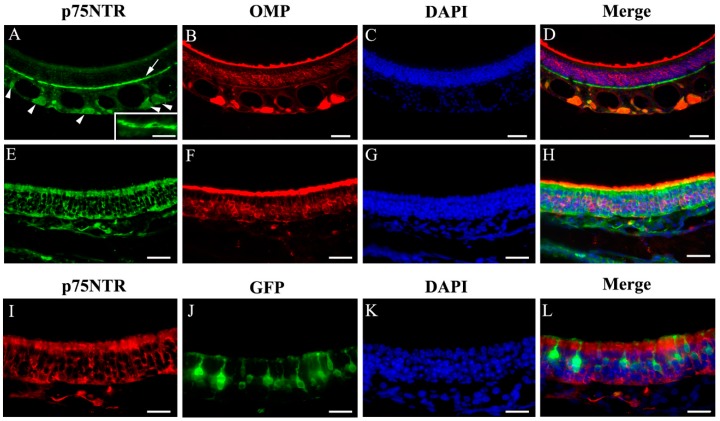
Functional maintenance of the mammalian main olfactory epithelium (MOE) is challenging because of its direct exposure to a wide spectrum of environmental chemicals. We previously reported that transient receptor potential channel M5-expressing microvillous cells (TRPM5-MCs) in the MOE play an important role in olfactory maintenance. To investigate the underpinning mechanisms, we exposed transcription factor Skn-1a knockout (Skn-1a-/-) mice lacking TRPM5-MCs, and TRPM5-GFP mice to either vehicle (water) or a mixture of odorous chemicals and chitin for two weeks and analyzed the expression of olfactory signaling proteins using immunolabeling and neurotrophin (NT) and NT receptor (NTR) gene transcripts using real-time quantitative PCR. The chemical exposure did not significantly attenuate the immunolabeling of olfactory signaling proteins. Vehicle-exposed Skn-1a-/- and TRPM5-GFP mice expressed similar levels of NT and NTR gene transcripts in the MOE and olfactory bulb. Chemical exposure significantly increased MOE expression of p75NTR in Skn-1a-/- mice, while p75NTR expression was reduced in TRPM5-GFP mice, as compared to vehicle-exposed mice. Additionally, our RNA in situ hybridization analysis and immunolabeling confirmed MOE expression of most NTs and NTRs. Together, these results indicate that TRPM5-MCs and chemical exposure influence expression of some NTs and NTRs in the MOE and olfactory bulb (OB).

Keywords: Skn-1a/Pou2f3; microvillous cells; olfactory epithelial maintenance; olfactory sensory neurons; real-time qPCR.


Conflict of interest statement

The authors declare no conflict of interest. The funders had no role in the design of the study; in the collection, analyses, or interpretation of data; in the writing of the manuscript, and in the decision to publish the results.

Figures

Figure 1
Figure 1
Immunolabeling of olfactory marker protein (OMP) and signaling proteins in TRPM5-GFP and Skn-1a−/− mice. (AD) Immunolabel of OMP (red) in mature OSNs. TRPM5 expression in TRPM5-MCs and TRPM5-expressing OSNs of a TRPM5-GFP mouse are shown in green (GFP+; A,B). Immunolabels of olfactory signaling protein CNGA2 (green in EH) and ACIII (red in IL), and G-protein Gγ13 (cyan in MP) are shown. (A,E,I,M) Vehicle (water)-exposed TRPM5-GFP mice. (B,F,J,N) chemical-exposed TRPM5-GFP mice. (C,G,K,O) Vehicle (water)-exposed Skn-1a−/− mice. (D,H,L,P) chemical-exposed Skn-1a−/− mice. For each antibody, images were taken under the same exposure time and from similar septal regions of coronal main olfactory epithelium (MOE) sections processed under the same conditions. DAPI staining is shown in blue. Scale bar: 40 μm.
Figure 2
Figure 2
Expression levels of neurotrophin and neurotrophin gene transcripts in the MOE and OB of vehicle-exposed TRPM5-GFP and Skn-1a−/− mice. Real-time qPCR was performed using total RNA extracted from (A) olfactory turbinate tissue consisting primarily of the MOE, and (B) the OB. The expression levels are plotted relative to the expression of the Gapdh reference gene. (A) Expression levels of each NT and NTR in the MOE of TRPM5-GFP and Skn-1a−/− mice. Similar expression patterns across the NTs and NTRs were found in both TRPM5-GFP and Skn-1a−/− mice with NT-3 and TrkB expression levels being the highest among NTs and NTRs, respectively. No statistically significant differences were detected in the expression of each gene in the MOE between TRPM5-GFP and Skn-1a−/− mice (two-tailed independent t-test, p > 0.05, n = 6 mice). (B) Expression levels of NTs and NTRs in the OB of TRPM5-GFP and Skn-1a−/− mice. Among the NTRs examined, TrkB showed the highest expression in both TRPM5-GFP and Skn-1a−/− mice (one-way ANOVA with Tukey’s post-hoc test, p < 0.05, n = 6). No statistically significant differences were detected in the expression of each gene in the OB between TRPM5-GFP and Skn-1a−/− mice (two-tailed independent t-test, p > 0.05, n = 6 mice). Bar graphs represent the mean ± standard deviation (SD).
Figure 3
Figure 3
Chemical exposure induced differential alterations in NT and NTR expression in the MOE of TRPM5-GFP and Skn-1a−/− mice. Real-time qPCR analysis and comparison of the expression of NTs and NTRs in the MOE of mice exposed to either vehicle (water) or a chemical mixture for 2 weeks. Gapdh was detected as the reference gene. (A) Relative expression levels of NTs and NTRs in TRPM5-GFP mice. No significant differences in the expression levels of NTs or NTRs were observed in the MOE of chemical-exposed mice compared to water-exposed mice except for p75NTR expression, which decreased significantly in the MOE of the chemical-exposed group. (B) Relative expression levels of NTs and NTRs in Skn-1a−/− mice. The expression of p75NTR in the MOE of the chemical-exposed group was significantly higher than in the vehicle-exposed group. * p < 0.05, two-tailed independent t test, n = 6. Bar graphs represent the mean ± SD.
Figure 4
Figure 4
Regional differences in the effects of chemical exposure on MOE NT and NTR gene-expression levels in TRPM5-GFP and Skn-1a−/− mice. Real-time qPCR was performed to analyze the expression of NTs and NTRs in the anterior and posterior MOEs of mice after a two-week exposure to either vehicle (water) or a chemical mixture. The plots show the NT and NTR mRNA-expression levels relative to that of the reference gene, Gapdh. (A) NT and NTR expression in the anterior MOE of TRPM5-GFP mice. BDNF and NT-3 expression levels in chemical-exposed TRPM5-GFP mice decreased significantly, compared to those in water-exposed TRPM5-GFP mice. (B) NT and NTR expression in the posterior MOE of TRPM5-GFP mice. Two week chemical exposure did not affect the expression of NTs and NTRs. (C) NT and NTR expression in the anterior MOE of Skn-1a−/− mice. No significant changes were detected. (D) NT and NTR expression in the posterior MOE of Skn-1a−/− mice. The expression levels of TrkB and NT-4 in the posterior MOE of chemical-exposed mice were significantly higher than those in water-exposed mice. * p < 0.05, two-tailed independent t test, n = 3. The bar graphs represent the mean ± SD.
Figure 5
Figure 5
NT and NTR expression levels in the OB of chemical- or vehicle (water)-exposed TRPM5-GFP and Skn-1a−/− mice. The plots show the relative gene expression levels obtained by qPCR analysis using total RNA extracted from the OBs. (A) TRPM5-GFP mice exposed to vehicle (water) or chemicals. No significant differences were detected between the two groups (p > 0.05, two-tailed independent t-test, n = 6). (B) Skn-1a−/− mice exposed to vehicle (water) or chemicals. No significant difference was observed between the two groups (p > 0.05, two-tailed independent t-test, n = 6), although the NT and NTR expression levels trended higher in the chemical-exposed group. The bar graphs represent the mean ± SD.
Figure 6
Figure 6
RNA in situ hybridization (RISH) analysis of NT mRNA expression in the MOE of TRPM5-GFP mice. RISH was performed on MOE coronal sections obtained from regularly housed TRPM5-GFP mice with digoxigenin-labeled antisense and sense riboprobes targeting each NT. (AD) and (A’D’) Low (10×) and high (40×) magnification images, respectively, of the MOE hybridized with the antisense probes for BDNF, NGF, NT-3, and NT-4. SC: sustentacular/supporting cell layer, OSN: olfactory sensory neuron layer, BL: basal lamina—black dotted line. (A”D”) show high-magnification images of sense-probe labeling for BDNF, NGF, NT-3, and NT-4, respectively. The sense probes yielded no detectable specific signals in the MOE. Insets in (AA’’): RISH images of BDNF mRNA expression in the OB as positive control for the riboprobes used. Scale bars: (AD) 200 μm; (A’D”) 50 μm.
Figure 7
Figure 7
RISH analysis of NTR mRNA expression in the MOE of regularly housed TRPM5-GFP mice. (AC) Low-magnification (10×) images showing labels of the antisense probes against p75NTR, TrkB, and TrkC. (A’C’) High-magnification (40×) images of antisense probes, correlating with the top row of images. SC: sustentacular/supporting cell layer, OSN: olfactory sensory neuron layer, BL: basal lamina—black dotted line. (A”C”) High-magnification (40×) images showing hybridization of the sense probe against p75NTR, TrkB, and TrkC. Arrows in A’ point to presumed ensheathing cells in the lamina propria. No specific signal was observed for the tested sense probes. Scale bars: (AC) 200 μm; (A’C’’) 50 μm.
Figure 8
Figure 8
Immunoreactivity of p75NTR in different MOE regions. (AD) Dorsal MOE. (EH) Ventrolateral MOE. p75NTR immunolabel is present in the basal cell layer (A, indicated by arrow, inset shows an enlarged image of basal cells), in ensheathing cells in and around the olfactory nerve bundles (A, indicated by arrowheads) and in supporting cells in the ventrolateral region (E, green; I, red). OMP immunolabel is shown (B,F, red). GFP signal in TRPM5-expressing OSNs and TRPM5-MCs was intensified using an anti-GFP antibody (J). No apparent colocalization of the GFP and p75NTR signal was found. Sections were stained with DAPI to show nuclei (blue, C,G,K). Scale bar: (AD) 50 μm; (EH) 30 μm; (IL) 20 μm.

Similar articles

Cited by

References

    1. Ajmani G.S., Suh H.H., Pinto J.M. Effects of Ambient Air Pollution Exposure on Olfaction: A Review. Environ. Health Perspect. 2016;124:1683–1693. doi: 10.1289/EHP136. - DOI - PMC - PubMed
    1. Lucchini R.G., Dorman D.C., Elder A., Veronesi B. Neurological impacts from inhalation of pollutants and the nose-brain connection. Neurotoxicology. 2012;33:838–841. doi: 10.1016/j.neuro.2011.12.001. - DOI - PMC - PubMed
    1. Koyuncu O.O., Hogue I.B., Enquist L.W. Virus infections in the nervous system. Cell Host Microbe. 2013;13:379–393. doi: 10.1016/j.chom.2013.03.010. - DOI - PMC - PubMed
    1. Doty R.L. The olfactory vector hypothesis of neurodegenerative disease: Is it viable? Ann. Neurol. 2008;63:7–15. doi: 10.1002/ana.21327. - DOI - PubMed
    1. Willner P. Chronic mild stress (CMS) revisited: Consistency and behavioural-neurobiological concordance in the effects of CMS. Neuropsychobiology. 2005;52:90–110. doi: 10.1159/000087097. - DOI - PubMed

MeSH terms

LinkOut - more resources