. 2019 Jan;4(1):27-38.
doi: 10.1016/j.bpsc.2018.07.014. Epub 2018 Aug 16.

Use of an Individual-Level Approach to Identify Cortical Connectivity Biomarkers in Obsessive-Compulsive Disorder

Affiliations

Use of an Individual-Level Approach to Identify Cortical Connectivity Biomarkers in Obsessive-Compulsive Disorder

Brian P Brennan et al. Biol Psychiatry Cogn Neurosci Neuroimaging. 2019 Jan.

Abstract

Background: Existing functional connectivity studies of obsessive-compulsive disorder (OCD) support a model of circuit dysfunction. However, these group-level observations have failed to yield neuroimaging biomarkers sufficient to serve as a test for the OCD diagnosis, predict current or future symptoms, or predict treatment response, perhaps because these studies failed to account for the substantial intersubject variability in structural and functional brain organization.

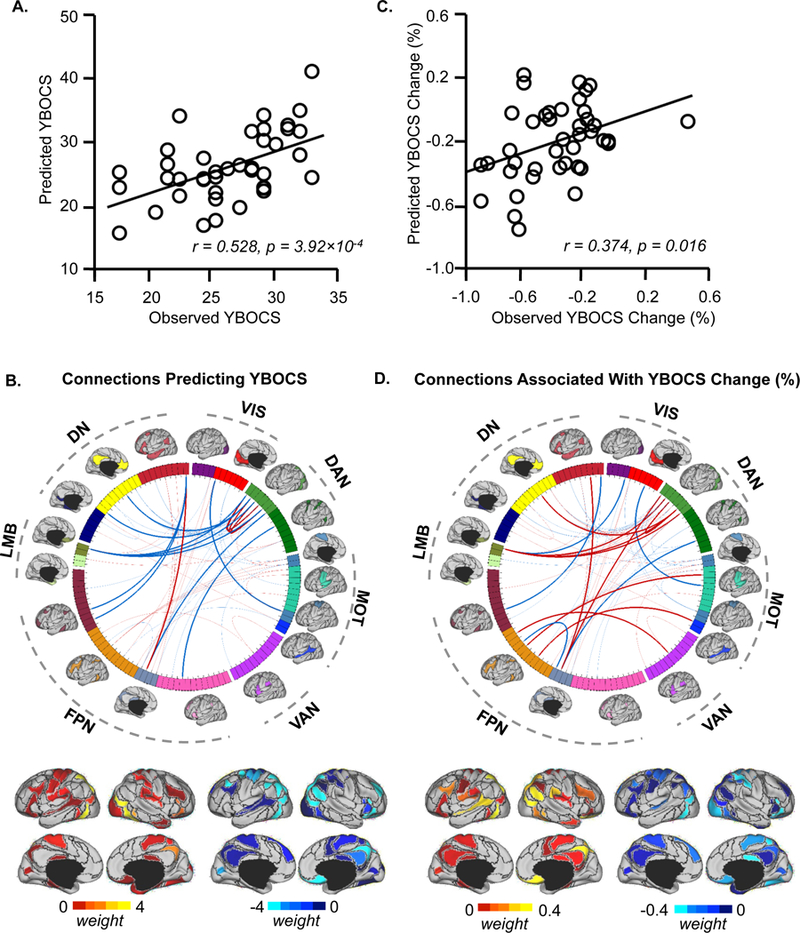
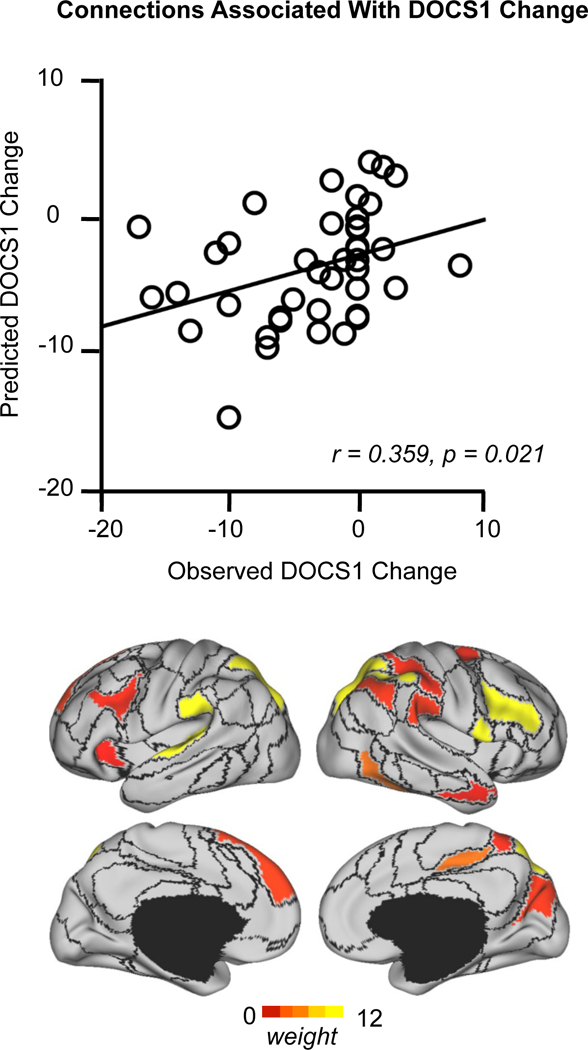
Methods: We used functional regions, localized in each of 41 individual OCD patients, to identify cortical connectivity biomarkers of both global and dimension-specific symptom severity and to detect functional connections that track changes in symptom severity following intensive residential treatment.

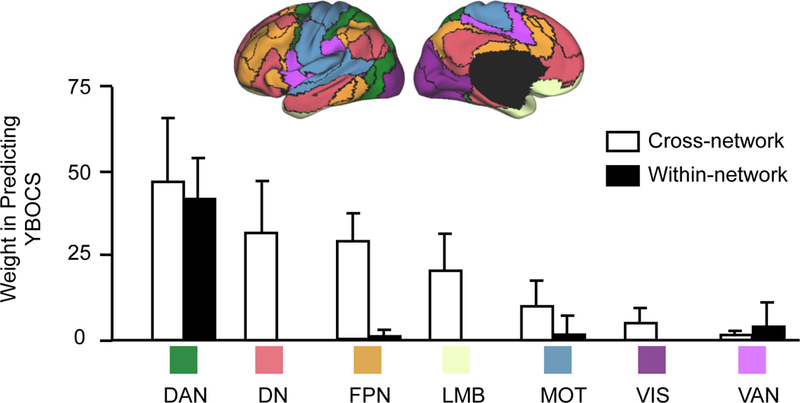
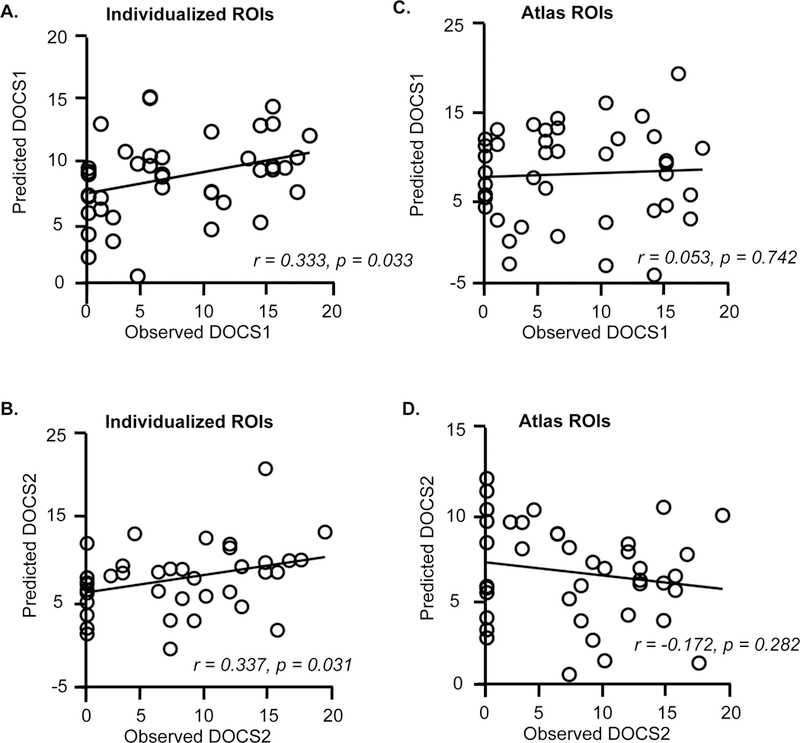
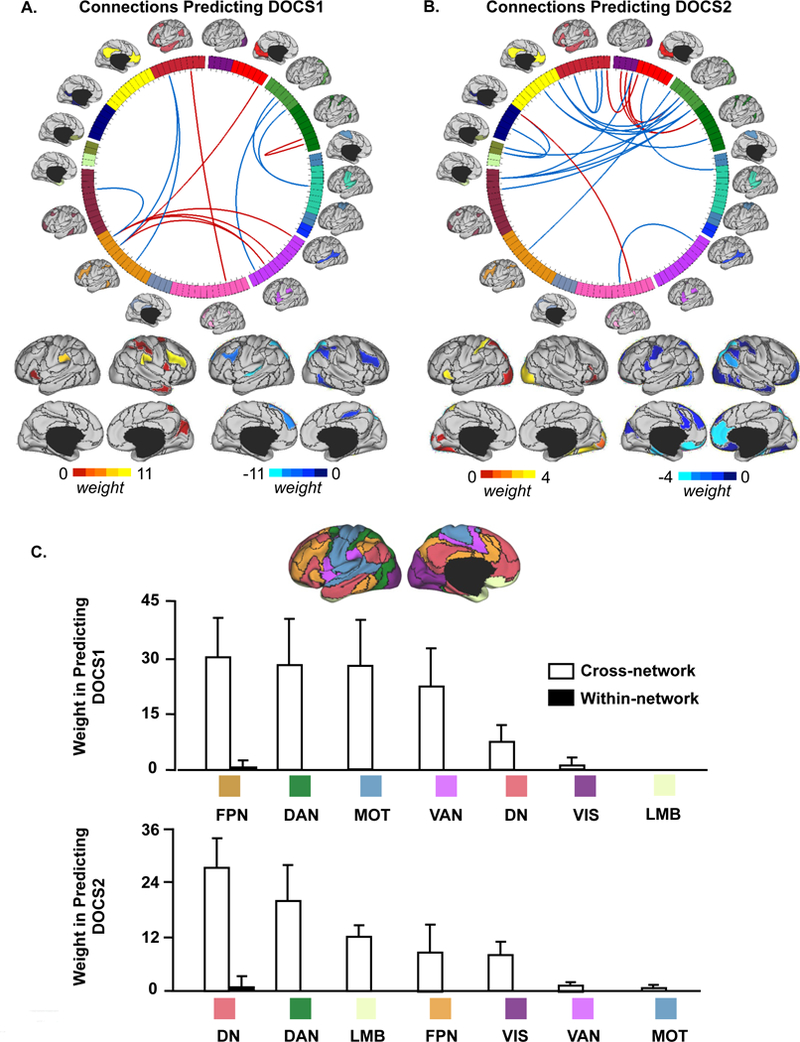
Results: Global OCD symptom severity was directly linked to dysconnectivity between large-scale intrinsic brain networks-particularly among the dorsal attention, default, and frontoparietal networks. Changes within a subset of connections among these networks were associated with symptom resolution. Additionally, distinct and nonoverlapping cortical connectivity biomarkers were identified that were significantly associated with the severity of contamination/washing and responsibility for harm/checking symptoms, highlighting the contribution of dissociable neural networks to specific OCD symptom dimensions. By contrast, when we defined functional regions conventionally, using a population-level brain atlas, we could no longer identify connectivity biomarkers of severity or improvement for any of the symptom dimensions.

Conclusions: Our findings would seem to encourage the use of individual-level approaches to connectivity analyses to better delineate the cortical and subcortical networks underlying symptom severity and improvement at the dimensional level in OCD patients.

Keywords: Biomarker; Connectivity; Dimension; OCD; Obsessive-compulsive disorder; fMRI.


Conflict of interest statement

Financial Disclosures

All other authors report no biomedical financial interests or potential conflicts of interest.

Figures

Figure 1.
Figure 1.. Individualized functional connectome predicts pre-treatment global OCD symptom severity and tracks change in symptom severity longitudinally.
(A) The scatterplot illustrates the correlation (r = 0.528, p = 3.92 ×10 −4) between the pre-treatment YBOCS scores predicted by connectivity among the individually-specified ROIs and the scores actually observed in the 41 participants with OCD. Pre-treatment depression symptoms and head motion were controlled as covariates in the prediction. (B) 86 ROIs extracted from 18 individualized networks are represented on a wheel. ROIs are color-coded according to the 18 networks. Group-level maps of the 18 functional networks are shown on the cortical surface outside the wheel. ROIs derived from the 18 networks could be grouped according to 7 well-studied canonical networks(23) (DN: default; VIS: visual; DAN: dorsal attention; MOT: motorsensory; VAN: ventral attention; FPN: frontoparietal; LMB: limbic). Sixty-four connections (ROI pairs) were identified that contributed to the prediction of pre-treatment YBOCS scores. The fifteen connections contributing most strongly to the prediction of pre-treatment YBOCS scores are indicated by the dark lines in the wheel (transparent lines indicate other 49 connections; see Figure S2 for more details on these 15 ROI pairs). The predictive power of each connection is indicated by the “weight”, as color-coded on the cortical surface representations under the wheel. Connections positively correlated with YBOCS scores are shown in red and connections negatively correlated with YBOCS scores are shown in blue. (C) Connectivity among individually-specified functional regions tracks changes in global symptom severity longitudinally. Among the 64 connections that predicted pre-treatment global OCD symptom severity, functional connectivity changes after intensive residential treatment are associated with percent change of YBOCS scores (r = 0.374, p = 0.016). (D) The fifteen connections most strongly associated with YBOCS improvement are indicated by the dark lines in the wheel. Functional regions involved in these connections are also rendered on the cortical surface. Connections positively correlated with change in YBOCS scores are shown in red and connections negatively correlated with change in YBOCS scores are shown in blue.
Figure 2.
Figure 2.. Pre-treatment global OCD symptom severity is associated with abnormal crosstalk between functional networks.
The 64 functional connections that are involved in the prediction of pre-treatment YBOCS scores are grouped according to the 7 well-studied networks (DN: default; VIS: visual; DAN: dorsal attention; MOT: motorsensory; VAN: ventral attention; FPN: frontoparietal; LMB: limbic). Connections contributing to pre-treatment YBOCS prediction are mainly cross-network connections (white bars). These cross-network connections involved regions in DAN, DN, FPN, and LMB. Only a few within-network connections (black bars) contributed to pre-treatment YBOCS prediction and mainly involved DAN. Error bars represent standard deviation.
Figure 3.
Figure 3.. Functional connectivity among individually-specified ROIs can predict pre-treatment dimension-specific symptoms in OCD participants.
(A, B) The scatter plots demonstrate the correlation between the predicted and observed pre-treatment DOCS1 scores (r = 0.333; p = 0.033) and the correlation between the predicted and observed pre-treatment DOCS2 scores (r = 0.337, p = 0.031). (C, D) In contrast, connectivity among the atlas-based ROIs did not predict pre-treatment DOCS1 (r = 0.053, p = 0.742) or DOCS2 scores ( r = −0.172, p = 0.282).
Figure 4.
Figure 4.. Use of individualized functional connectome identifies discrete, non-overlapping cortical connectivity biomarkers of pre-treatment dimensional OCD symptom severity.
(A, B) Connections that are predictive of pre-treatment DOCS1 and DOCS2 scores are shown on the wheel. Functional regions involved in these connections are also rendered on the cortical surface. The predictive power of each region is color-coded. Connections positively correlated with DOCS scores are shown in red and connections negatively correlated with DOCS scores are shown in blue. (C) Pre-treatment DOCS1 and DOCS2 are both associated with abnormal crosstalk between functional networks. Functional connections that are involved in the prediction of pre-treatment DOCS1 scores are grouped according to the 7 networks (DN: default; VIS: visual; DAN: dorsal attention; MOT: motorsensory; VAN: ventral attention; FPN: frontoparietal; LMB: limbic). Connections contributing to the prediction of pre-treatment DOCS1 are mainly cross-network connections (white bars) involving regions in FPN, DAN, MOT, and VAN. Connections contributing to the prediction of pre-treatment DOCS2 are mainly cross-network connections involving regions in DN, DAN, and LMB. Error bars represent standard deviation.
Figure 5.
Figure 5.. Connectivity changes among individually-specified functional regions tracks changes in contamination/washing symptom severity longitudinally.
Functional connectivity changes within the 13 connections that are predictive of pre-treatment DOCS1 scores are associated with percent change in DOCS1 scores after treatment (r = 0.359, p = 0.021). The strength of association of each functional region involved in these connections is color-coded.

References

    1. Ruscio AM, Stein DJ, Chiu WT, and Kessler RC. (2010): The epidemiology of obsessive-compulsive disorder in the National Comorbidity Survey Replication. Mol Psychiatry 15: 53–63. - PMC - PubMed
    1. Meier SM, Mattheisen M, Mors O, Schendel DE, Mortensen PB, and Plessen KJ. (2016): Mortality Among Persons With Obsessive-Compulsive Disorder in Denmark. JAMA Psychiatry 73: 268–74. - PMC - PubMed
    1. Harrison BJ, Pujol J, Cardoner N, Deus J, Alonso P, Lopez-Sola M, et al. (2013): Brain corticostriatal systems and the major clinical symptom dimensions of obsessive-compulsive disorder. Biol Psychiatry 73: 321–8. - PubMed
    1. Harrison BJ, Soriano-Mas C, Pujol J, Ortiz H, Lopez-Sola M, Hernandez-Ribas R, et al. (2009): Altered corticostriatal functional connectivity in obsessive-compulsive disorder. Arch Gen Psychiatry 66: 1189–200. - PubMed
    1. Posner J, Marsh R, Maia TV, Peterson BS, Gruber A, and Simpson HB. (2014): Reduced functional connectivity within the limbic cortico-striato-thalamo-cortical loop in unmedicated adults with obsessive-compulsive disorder. Hum Brain Mapp 35: 2852–60. - PMC - PubMed

Publication types