. 2018 Oct 26;362(6413):eaaq0681.
doi: 10.1126/science.aaq0681. Epub 2018 Sep 27.

Single-cell analysis uncovers convergence of cell identities during axolotl limb regeneration

Affiliations

Single-cell analysis uncovers convergence of cell identities during axolotl limb regeneration

Tobias Gerber et al. Science. .

Abstract

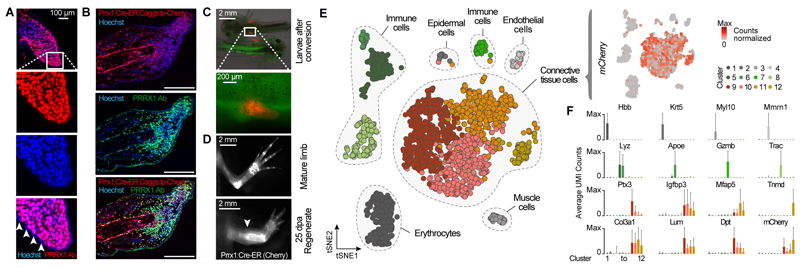
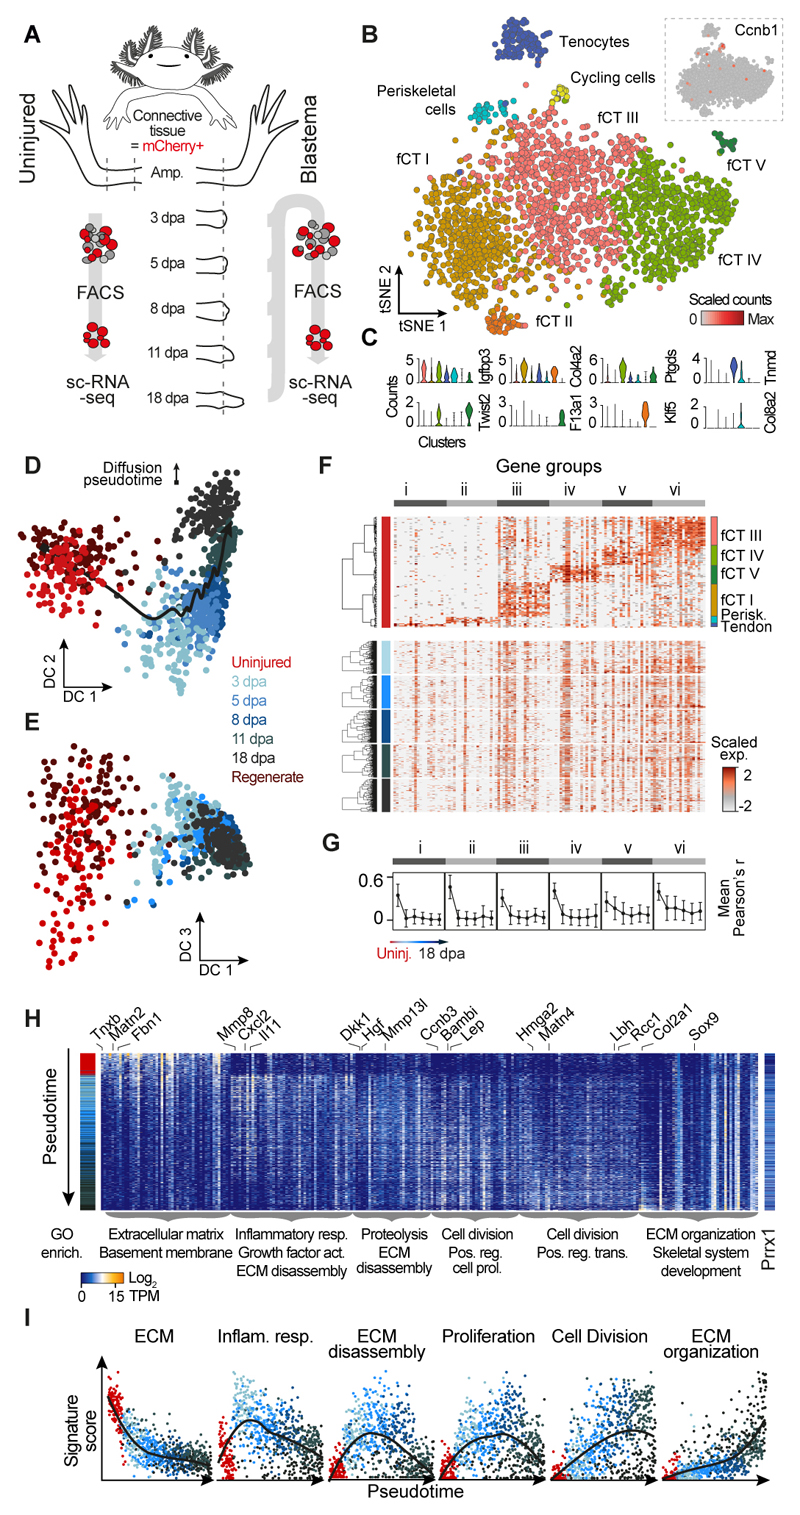
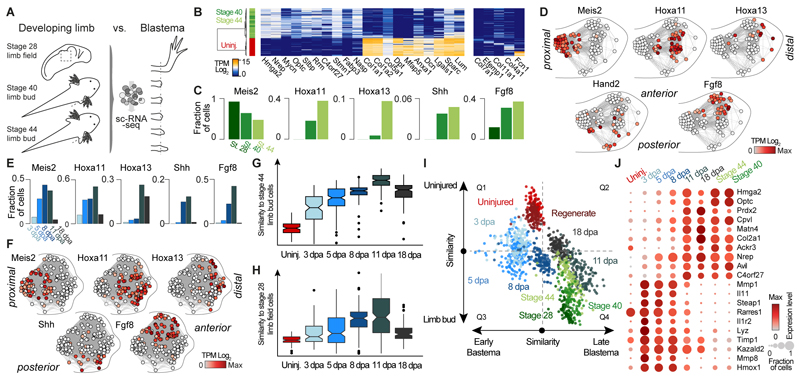
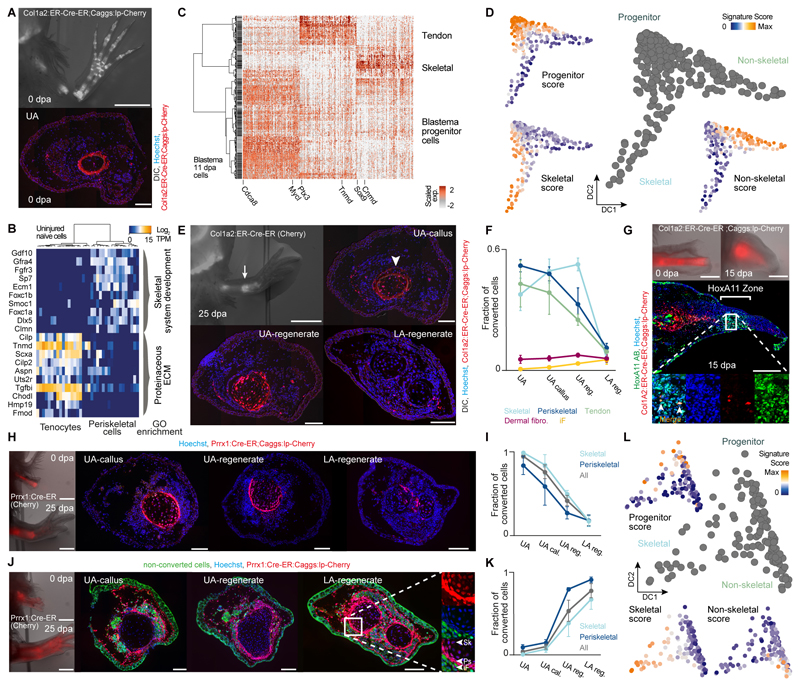
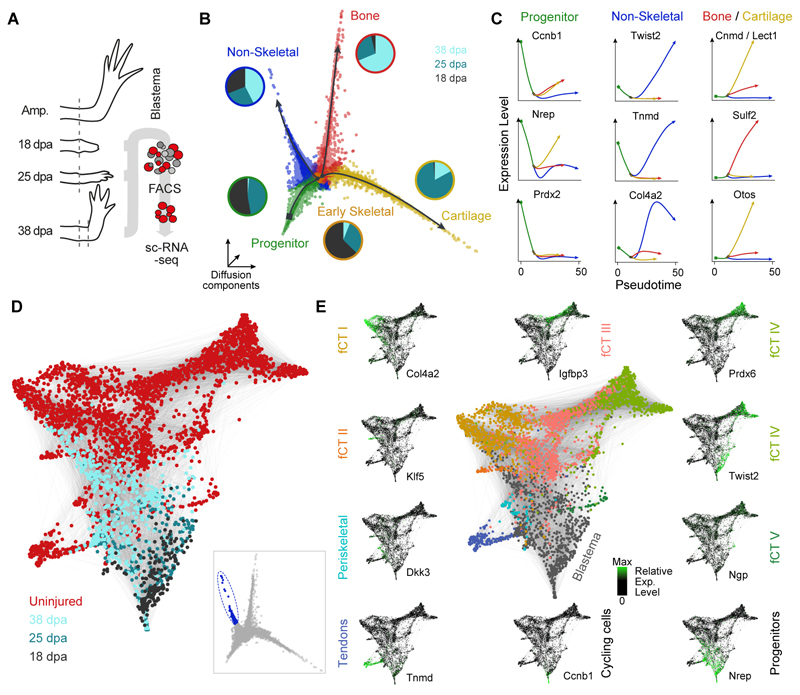
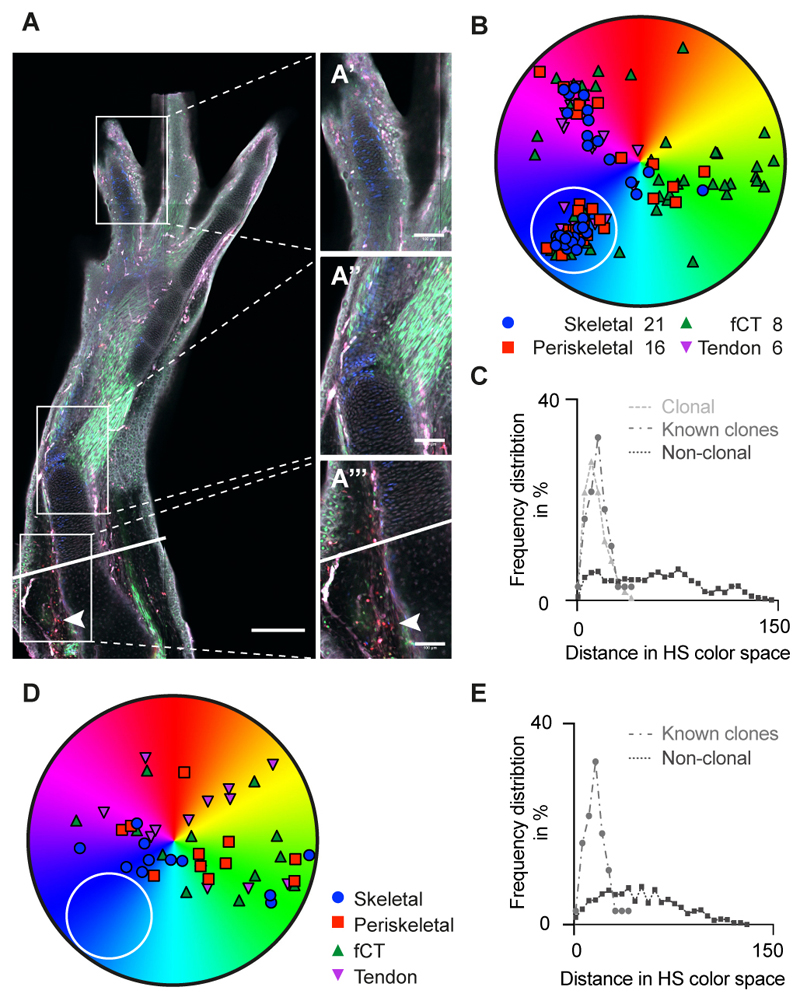
Amputation of the axolotl forelimb results in the formation of a blastema, a transient tissue where progenitor cells accumulate prior to limb regeneration. However, the molecular understanding of blastema formation had previously been hampered by the inability to identify and isolate blastema precursor cells in the adult tissue. We have used a combination of Cre-loxP reporter lineage tracking and single-cell messenger RNA sequencing (scRNA-seq) to molecularly track mature connective tissue (CT) cell heterogeneity and its transition to a limb blastema state. We have uncovered a multiphasic molecular program where CT cell types found in the uninjured adult limb revert to a relatively homogenous progenitor state that recapitulates an embryonic limb bud-like phenotype including multipotency within the CT lineage. Together, our data illuminate molecular and cellular reprogramming during complex organ regeneration in a vertebrate.


Figures

Fig. 1
Fig. 1. Tracking and molecular profiling of axolotl limb connective tissue (CT).
(A) Longitudinal section of a limb bud at stage 47 stained with anti-PRRX1 Ab (red) identifies Prrx1 as a pan-CT marker during limb development. Arrowheads indicate absence of PRRX1 staining in the epidermis. (B) Longitudinal section of a blastema 11 days post amputation (dpa) stained with anti-PRRX1 Ab (green). Red: converted cells; Blue: Hoechst = nuclei. Scale bar: 500 μm. (C) Embryos after induction of Prrx1:Cre-ER;CAGGs:lp-Cherry using Tamoxifen (4-OHT) show expression of mCherry only in limb mesenchyme. (D) Fluorescence image of converted cells in uninjured and regenerated limb (conversion at limb bud stage) indicates stable labeling of CT prior to and post regeneration. Arrowhead indicates amputation plane. (E) Left: tSNE plot visualizing single-cell (sc) RNA-seq data of 2,379 single cells (circles) from the adult axolotl upper arm. Gray patches outline related cell types. Right: mCherry expression is detected exclusively in CT cell types. (F) Bar plots showing mean expression of marker genes in each cluster. X-axis represents cell clusters identified in Fig. 1E. Error bars indicate standard deviation. UMI: unique molecular identifier.
Fig. 2
Fig. 2. Blastema formation from axolotl upper arm connective tissue cells involves molecular funneling during regeneration.
(A) Schematic of CT scRNA-seq experiments. ScRNA-seq was performed on FACS sorted mCherry+ CT cells of the uninjured axolotl upper arm (0 days post amputation, dpa) and during regeneration of the upper arm blastema at 3 dpa, 5 dpa, 8 dpa, 11 dpa and 18 dpa using Prrx1:Cre-ER;Caggs:Lp-Cherry animals (conversion at 1 cm size). (B) Cellular heterogeneity of the uninjured upper arm CT based on 2375 single cell transcriptomes. tSNE projection reveals 8 clusters referring to 7 CT subtypes. The 8th cluster contains cycling cells marked by expression of Ccnb1 shown as an inset. fCT: fibroblastic connective tissue. (C) Violin plots showing distribution of expression for selected tSNE cluster marker genes (panel B). The cluster of cycling cells was excluded. Colors refer to cluster colors of tSNE map (panel B). (D) Diffusion map projection (16) describes lineage relationships between uninjured CT cells and cells from all blastema time points as well as cells from a fully regenerated upper arm. DC: Diffusion component. CT cells from limb regenerate cluster with cells from uninjured upper arm tissue. (E) Diffusion component (DC) 3 captures the cell type heterogeneity in the uninjured CT, which is lost in the blastema. (F) Cellular heterogeneity of the mature CT is lost in the blastema. Expression of cell type marker genes (gene groups i to vi) identified for the uninjured CT is shown for each blastema time point as heatmap with genes in columns and cells hierarchically clustered in rows. Transcript levels are scaled across columns, respectively. (G) Mean pairwise correlation (Pearson) between genes of each of the 6 identified gene groups (panel F) across all cells was calculated for each experimental time point. Mean correlation coefficients decrease over the course of blastema formation indicating the loss of cell type heterogeneity in the blastema. Error bars indicate standard deviation. (H) Heatmap visualization of time point-specific marker genes (columns) with cells (rows) ordered by diffusion pseudotime (see also fig. S4I). GO enrichments are provided below the heatmap for each gene group and exemplary genes are shown at the top (see also fig. S5A). Colored sidebar on the left indicates time points. (I) Pseudotemporal expression of different gene signatures across all cells from uninjured upper arm CT to blastema 18dpa. Smoothed conditional means using LOESS are presented.
Fig. 3
Fig. 3. Connective tissue reprogramming progresses through a blastema-specific state prior to recapitulating embryonic limb bud development.
(A) Overview of scRNA-seq experiments on three axolotl limb bud stages. 279 limb bud CT cells were in silico identified based on Prrx1 expression and their transcriptomes were compared to scRNA-seq data of the blastema cells. (B) Left: Heatmap showing expression of genes (columns) that distinguish mature limb CT cells from limb bud CT cells (rows). Right: Heatmap showing expression of marker genes for uninjured CT cell types (columns) across mature limb and limb bud CT cells (rows). Cells are hierarchically clustered (Pearson) based on expression of all shown genes. (C) Bar graphs show fraction of cells per embryonic stage that express genes involved in proximal-distal patterning (Meis2, Hoxa11, Hoxa13) or in anterior-posterior patterning (Fgf8, Shh). (D) Spatial patterning genes describe most of the heterogeneity found in the limb bud CT (See also fig. S6C). Intercellular correlation network constructed for stage 44 limb bud cells (circles) based on expression of 5 known patterning genes places cells on a hypothetical position within an imaginary limb bud. Note, that Hand2 instead of Shh was used as anterior marker due to the low number of Shh expressing cells (Fig. 3C). (E) Limb bud patterning genes are reactivated during blastema formation. Bar graphs show fraction of cells per blastema time point that express genes involved in proximal-distal patterning (Meis2, Hoxa11, Hoxa13) or in anterior-posterior patterning (Fgf8, Shh). (F) Intercellular correlation network constructed for all blastema 11 dpa cells (circles) based on expression of 5 patterning genes places cells on a hypothetical position within an imaginary limb blastema. (See also fig. S6D). (G) Correlation analysis reveals the highest similarity of limb bud progenitors with blastema 11 dpa cells. Boxplot shows distributions of scaled correlation between single cell transcriptomes at any given time point and the mock bulk transcriptome of stage 44 limb bud CT cells. (H) Correlation analysis reveals the highest similarity of stage 28 limb field cells with blastema 11 dpa cells. Boxplots show distributions of scaled correlation values between single-cell transcriptomes at the different sampled time points and the mock bulk transcriptome of limb field CT cells. (I) Scatterplot showing differential correlation of single cell transcriptomes (dots, color-coded based on time point) with limb bud versus uninjured mature CT transcriptomes (y-axis) and with blastema 5 dpa versus blastema 11 dpa transcriptomes (x-axis). (J) Dotplot visualizing expression of genes shared between blastema 11 dpa and limb bud progenitor cells. Circle size represents the fraction of cells of each time point expressing the gene and color represents the average expression level.
Fig. 4
Fig. 4. Tracking different connective tissue subpopulations in the blastema reveals distinct cell sources for proximal versus distal limb regenerate tissue.
(A) Top: Fluorescence overlaid with bright-field image of Col1a2:ER-Cre-ER;Caggs:lp-Cherry (conversion at 3 cm size) limbs at 0 dpa overlaid with DIC. Bottom: Upper arm limb cross-section reveals labeling of periskeletal and tendon cells. Hoechst (blue), Col1a2:ER-Cre-ER;Caggs:lp-Cherry (red). (B) Heatmap showing distinct expression profiles for 36 mature limb periskeletal and tendon cells (Col1a2:ER-Cre-ER;Caggs:lp-Cherry labeled) with cells (columns) being hierarchically clustered (Pearson). GO enrichments are shown. (C) Cellular heterogeneity of labeled Col1a2:ER-Cre-ER;Caggs:lp-Cherry descendants in the 11 dpa blastema (349 cells). Heatmap visualizing expression of genes (columns) identified by PCA in 11 dpa blastema cells (rows, hierarchically clustered based on Pearson’s correlation). Transcript levels are scaled across columns. (D) Pseudotemporal trajectory obtained by Diffusion Map projection (26) on genes identified by PCA (Table S10) for 11 dpa blastema cells deriving from labeled Col1a2:ER-Cre-ER;Caggs:lp-Cherry descendants. Blastema progenitors are linked to 2 emerging cell lineages: non-skeletal (likely precursors to periskeletal cells and tenocytes) and skeletal. (23) Scores for developmental, non-skeletal and skeletal signatures projected onto the Diffusion Map are shown. (E) Top left: Fluorescence overlaid with bright-field image of Col1a2:ER-Cre-ER;Caggs:lp-Cherry limbs at 25 dpa. Scale bar: 2 mm. From top right to bottom left to bottom right: Limb cross-sections along the proximo-distal axis (UA: upper arm, LA: lower arm). Hoechst (blue), Col1A2:ER-Cre-ER;Caggs:lp-Cherry (red) overlaid with DIC. Scale bar: 200 μm. (F) Fraction of converted cells in five CT subtypes at different proximo-distal positions after regeneration, (cell number n > 8000, 3 independent limb samples). iF: Interstitial fibroblasts (fCT I-III). (G) Col1a2:ER-Cre-ER;Caggs:lp-Cherry labeled humerus transplantation into unlabeled host. Top: Stereoscopic images of live animals at 0 dpa and 15 dpa. Scale bar: 1 mm. Center: Longitudinal sections of 15 dpa blastema. Converted cells (red), HoxA11 (green), Hoechst (blue). Scale bar: 500 μm. Bottom: Magnified view showing co-localization of mCherry+ cells with HoxA11 antibodies. (H) Prrx1:Cre-ER;Caggs:lp-Cherry labeled humerus transplantation into unlabeled host. Left: Stereoscopic images of live animals at 0 dpa and 25 dpa. Scale bar: 1 mm. From left to right: Cross sections of limbs from UA-callus, UA-regenerate and LA-regenerate. Converted cells (red), Hoechst (blue). Scale bar: 200 μm. (I) Quantification of converted cells in periskeletal, skeletal and aggregate of periskeletal and skeletal subtypes (All) plotted on proximo-distal axis. (J) Unlabeled humerus transplantation into Prrx1:Cre-ER;Caggs:lp-Cherry converted host. Left: Stereoscopic images of live animals at 0 dpa and 25 dpa. Scale bar: 1 mm. From left to right: Cross sections of limbs from UA-callus, UA-regenerate and LA-regenerate. Converted cells (red), Non-converted cells (green), Hoechst (blue). Scale bar: 200 μm. Right: Magnified view showing mCherry+ periskeletal (Ps) and skeletal (Sk) and iF: Interstitial fibroblasts (fCT I-III). (K) Quantification of converted cells in periskeletal, skeletal and aggregate of periskeletal and skeletal subtypes plotted (All) on proximo-distal axis. (L) Pseudotemporal trajectory obtained by Diffusion Map projection (26) on genes identified by PCA (Table S10) for 18 dpa blastema cells of labeled Prrx1:Cre-ER;Caggs:lp-Cherry descendants links limb bud-like blastema progenitors to 2 emerging cell lineages: non-skeletal (precursors to all non-skeletal CT subtypes) and skeletal. (23) Scores for developmental, non-skeletal and skeletal signatures are projected onto the Diffusion Map.
Fig. 5
Fig. 5. Following the re-emergence of connective tissue lineages through multipotent progenitors.
(A) Schematic of high-throughput scRNA-seq experiments on late blastema stages using Prrx1:Cre-ER;Caggs:Lp-Cherry converted animals. ScRNA-seq was performed on FACS sorted mCherry+ CT cells of the uninjured axolotl upper arm (0 days post amputation, dpa) and during regeneration of the upper arm blastema at 18 dpa, 25 dpa and 35 dpa using the 10x Genomics Chromium controller. (B) Three-dimensional representation of a Diffusion analysis (16) of blastema time points (18, 25, 38 dpa) identifies 4 branches. Merlot (23) was used to identify end points and branching points (color coded) within the trajectory and to obtain branch-specific gene expression patterns. Pie charts next to the branches show the time point distribution per respective branch. (C) Pseudotemporal expression of marker genes along the branches identified in panel B. Shown markers were used to assign cell types to each branch (blastema progenitors, two skeletal lineages (cartilage and bone) and one non-skeletal lineage). (D) SPRING (27) visualization of late non-skeletal blastema cells (cells with highest pseudotime encircled and highlighted in blue in inset) together with mature CT cells (total 3151 cells) reveals emergence of CT subpopulations identified in the mature tissue. (E) Genes identified as markers for distinct CT subtypes (Tnmd, Col4a2, Twist2) in the mature uninjured tissue highlight the emergence of cell types during the last phases of regeneration while the expression of developmental blastema markers (Nrep) and cell cycle markers (Ccnb1) decrease during final differentiation.
Fig. 6
Fig. 6. Brainbow clonal analysis confirms multi-lineage potential of connective tissue cells upon limb regeneration.
(A) Representative image of a regenerated limb in a Brainbow axolotl. A presumptive clone of blue cells is observed throughout the limb, from the digit tip (A’), the elbow (A”), and amputation plane (solid line) at the injection site (arrowhead) (A”’). Scale bars: (A) 300 μm; (A’-A”’): 100 μm. (B) Example of HS color distribution of cells from a representative image containing a presumptive clone of blue cells (white circle). Multiple cells of each connective tissue sub-type (Skeletal cells, periskeletal cells, tenocytes and fibroblastic CT cells) are all represented. Similar distributions were observed in 3/10 analyzed samples (for examples see fig. S11H). (C) Frequency distribution in HS color space calculated using the formula (fig. S11E), for known clonally related cells (fig. S11, F and G), presumptive clonally related cells (“blue cells” in white circle, panel B) in a regenerated limb, and non-clonally related cells in a regenerate. Frequency distribution of suspected clonally related cells is indistinguishable from known clones (Kruskal-Wallis analysis and Dunn’s multiple comparison). (D) Example of HS color distribution of cells from a representative image lacking a discreet cluster of blue cells (white circle). Similar distribution was observed for 7/10 analyzed samples (for examples see fig. S11I). (E) Frequency distribution as in C for sample shown in D. Note that due to the lack in identifying a clonally related subset, no presumptive clone could be mapped.

Comment in

References

    1. Brockes JP, Kumar A. Comparative aspects of animal regeneration. Annu Rev Cell Dev Biol. 2008;24:525–549. - PubMed
    1. Nacu E, Tanaka EM. Limb regeneration: a new development? Annu Rev Cell Dev Biol. 2011;27:409–440. - PubMed
    1. Muneoka K, Fox WF, Bryant SV. Cellular contribution from dermis and cartilage to the regenerating limb blastema in axolotls. Dev Biol. 1986;116:256–260. - PubMed
    1. Kragl M, et al. Cells keep a memory of their tissue origin during axolotl limb regeneration. Nature. 2009;460:60–65. - PubMed
    1. Dunis DA, Namenwirth M. The role of grafted skin in the regeneration of x-irradiated axolotl limbs. Dev Biol. 1977;56:97–109. - PubMed

Publication types