. 2018 Sep 27;9(10):1011.
doi: 10.1038/s41419-018-1042-7.

A new signaling cascade linking BMP4, BMPR1A, ΔNp73 and NANOG impacts on stem-like human cell properties and patient outcome

Affiliations

A new signaling cascade linking BMP4, BMPR1A, ΔNp73 and NANOG impacts on stem-like human cell properties and patient outcome

Thibault Voeltzel et al. Cell Death Dis. .

Abstract

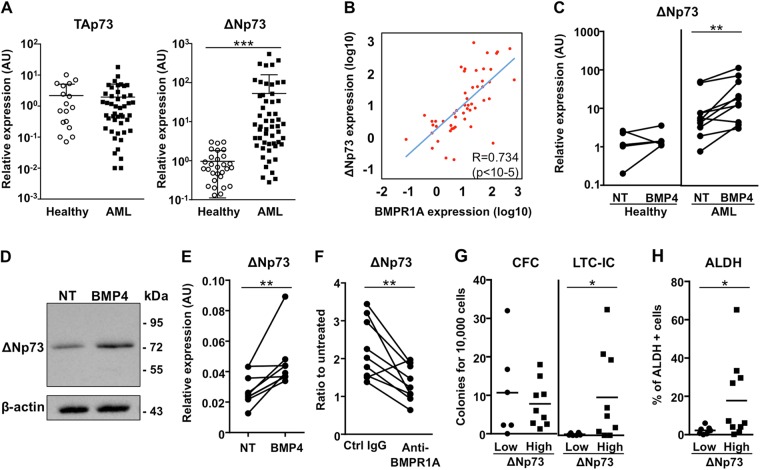
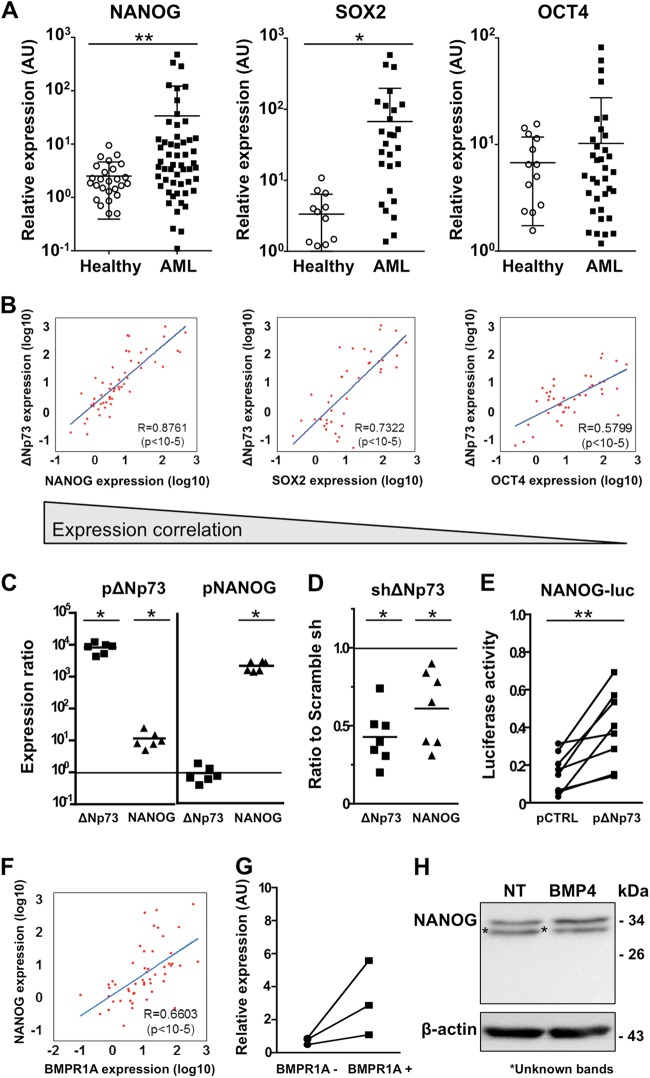
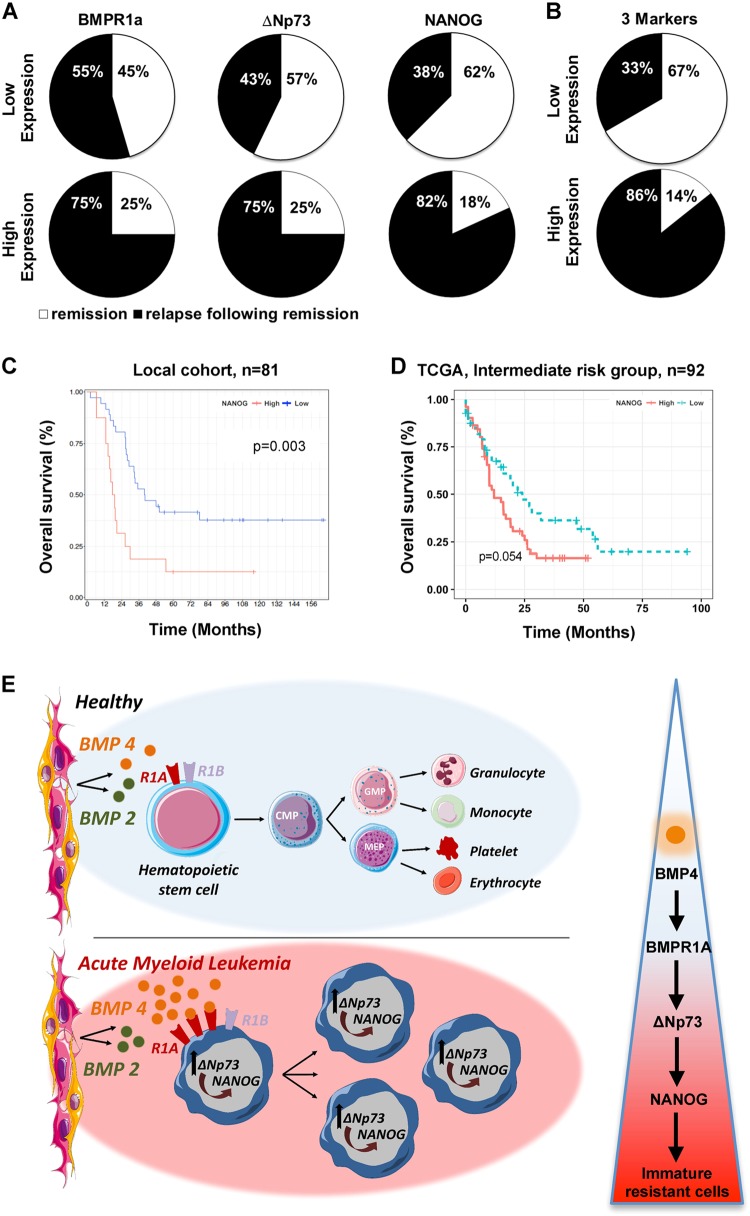
In a significant number of cases cancer therapy is followed by a resurgence of more aggressive tumors derived from immature cells. One example is acute myeloid leukemia (AML), where an accumulation of immature cells is responsible for relapse following treatment. We previously demonstrated in chronic myeloid leukemia that the bone morphogenetic proteins (BMP) pathway is involved in stem cell fate and contributes to transformation, expansion, and persistence of leukemic stem cells. Here, we have identified intrinsic and extrinsic dysregulations of the BMP pathway in AML patients at diagnosis. BMP2 and BMP4 protein concentrations are elevated within patients' bone marrow with a BMP4-dominant availability. This overproduction likely depends on the bone marrow microenvironment, since MNCs do not overexpress BMP4 transcripts. Intrinsically, the receptor BMPR1A transcript is increased in leukemic samples with more cells presenting this receptor at the membrane. This high expression of BMPR1A is further increased upon BMP4 exposure, specifically in AML cells. Downstream analysis demonstrated that BMP4 controls the expression of the survival factor ΔNp73 through its binding to BMPR1A. At the functional level, this results in the direct induction of NANOG expression and an increase of stem-like features in leukemic cells, as shown by ALDH and functional assays. In addition, we identified for the first time a strong correlation between ΔNp73, BMPR1A and NANOG expression with patient outcome. These results highlight a new signaling cascade initiated by tumor environment alterations leading to stem-cell features and poor patients' outcome.


Conflict of interest statement

The authors declare that they have no conflict of interest.

Figures

Fig. 1
Fig. 1. The BMP pathway is activated in bone marrow (BM) and peripheral blood of AML patients.
a BMP2 and BMP4 concentrations in bone marrow (BM) supernatants from AML patients (n = 17) and healthy donors (n = 19) evaluated by ELISA. b BMP2 and BMP4 mRNA level in blood and bone marrow MNCs from healthy donors and AML patients’ samples at diagnosis. c BMP2 and BMP4 mRNA level in bone marrow MNCs only, from healthy donors and AML patients’ samples at diagnosis. d Expression of BMP receptors: BMPR1A, BMPR1B and BMPR2, and BMP target genes: Id1 and RunX1 evaluated in normal (n = 14–25) and AML (n = 34–51) grouped BM and blood samples by RT-qPCR. Arbitrary unit (AU): relative expression compared to a healthy sample used as a reference for each PCR experiment. P values were determined using the Mann−Whitney U test. *P < 0.05; **P < 0.01; ***P < 0.001; ****P < 0.0001
Fig. 2
Fig. 2. The presence of BMPR1A at the cell surface of AML samples is induced by BMP4 and BMPR1A and is associated with the presence of very immature cells.
a Percentage of mononuclear cells (MNCs) of healthy donors (n = 8) and AML (n = 11) samples expressing BMPR1A at their membrane determined by flow cytometry. b Correlation between the expressions of BMPR1A and Id1 in AML samples at diagnosis (n = 50). c Relative expression of BMPR1A in MNCs from healthy donors (n = 6) and AML patients (n = 9), exposed or not, to BMP4 (10 ng/mL) for 24 h. d Effect of BMP4 (10 ng/mL) exposure on the proportion of BMPR1A-positive cells at the surface in healthy and AML MNC samples (n = 6 patients for each cohort). e Effect of BMP4 (10 ng/mL) exposure for 24 h on the proportion of very immature leukemic cells in AML mononuclear cells (MNCs), evaluated by long-term culture-initiating cells (LTC-IC) assay (n = 3). f Flow cytometric analysis of the expression of BMPR1A at the cell surface according to CD34 and CD38 status of MNCs from an AML patient. g Number of colony-forming cells (CFC) and LTC-IC among peripheral blood MNCs from AML patients according to their low (n = 8) or high (n = 6) BMPR1A mRNA level. h AML samples with low (n = 6) or high (n = 7) BMPR1A mRNA levels were analyzed for ALDH activity by flow cytometry. NT non-treated, NBM normal bone marrow. Statistical analysis: P values were determined using Spearman’s nonparametric test (b); Wilcoxon matched-pairs signed rank test (c, d); *P < 0.05; **P < 0.01
Fig. 3
Fig. 3. ΔNp73 overexpression in AML samples at diagnosis is correlated with BMP pathway activation and is associated with the presence of very immature cells.
a Expression of TAp73 and ΔNp73 in mononuclear cell (MNC) samples from healthy donors (n = 19–29) and AML at diagnosis (n = 46–54) quantified by RT-qPCR. Arbitrary Unit (AU), relative expression compared to a healthy sample used as a reference. b Correlations between the expressions of ΔNp73 and BMPR1A (n = 51). P values were determined using Spearman’s nonparametric test. c Relative expression of ΔNp73 in MNCs from healthy donors (n = 5) and AML patients (n = 7), exposed or not, to BMP4 (10 ng/mL) for 24 h; NT not treated. d Western blot analysis of AML cells exposed or not, to BMP4 (20 ng/mL) for 24 h (n = 2); N not treated. e Relative expression of ΔNp73 in KG1A cells exposed to BMP4 (10 ng/mL) for 24 h with (n = 8). f Expression of ΔNp73 in KG1A cells exposed to BMP4, in presence of either an antibody specific for BMPR1A or a control antibody, measured by RT-qPCR. Ratio was calculated according to untreated KG1A cells. g CFC and LTC-IC values in AML samples according to low (<8 AU, n = 6) or high (>8 AU, n = 9) ΔNp73 levels. h Flow cytometry analysis of ALDH activity in AML samples with low (n = 7) or high (n = 9) ΔNp73 expressions levels. Statistical analysis: Wilcoxon matched-pairs signed rank test was used for (c, e, f); *P < 0.05; **P < 0.01; ***P < 0.001
Fig. 4
Fig. 4. BMPR1A, ΔNp73, and NANOG overexpression are correlated in AML samples at diagnosis.
Distribution of normal mononuclear cells (MNCs) (n = 14–27) and AML samples from patients (n = 31–54) according to a NANOG, OCT4, and SOX2 expression. b Correlation between NANOG (n = 52), SOX2 (n = 41), OCT4 (n = 41) and ΔNp73 mRNA levels in AML samples. Statistical analysis: Spearman’s nonparametric test. c Expression of NANOG and ΔNp73 in KG1A cells 48 h after transfection with pBabe-ΔNp73, pMXS-NANOG or empty vector (control). Expression ratio is the relative expression after transfection with the indicated vector as compared to transfection with the empty vector (n = 6). d Expression of NANOG and ΔNp73 48 h after KG1A cells transfection with an anti-ΔNp73-specific shRNA (n = 6). e Luciferase assay using the pNANOG-Luc, as reporter, cotransfected with a vector expressing ΔNp73 or an empty vector in KG1A cells (n = 6). f Correlation between BMPR1A and NANOG mRNA levels (n = 51). Statistical test: Spearman’s nonparametric test. g NANOG mRNA levels in AML cells sorted according to their surface expression BMPR1A (n = 3). RT-qPCR was used for mRNA quantification. Arbitrary Unit (AU), relative expression compared to a healthy sample used as a reference. h Western blot analysis of primary AML cells exposed or not, to BMP4 (20 ng/mL) for 24 h. Statistical analysis: P values were determined using Wilcoxon signed rank test for c, d; Wilcoxon matched-pairs signed rank test was used for e; *P < 0.05; **P < 0.01; ***P < 0.001
Fig. 5
Fig. 5. BMPR1A, ΔNp73, and NANOG expression at diagnosis are correlated with patient outcome.
Percentage of AML patients in remission or relapse 3 years after diagnosis, according to BMPR1A, ΔNp73 or NANOG expression levels separately (n = 19) (a) or in combination (n = 13) (b). c Overall survival (OS) curve of AML patients from the date of sampling onwards, by using the Kaplan−Meier method. The level of significance was determined by the log-rank test (n = 52; 23 high and 29 low NANOG level). d Overall survival (OS) curve of AML patients from the date of sampling onwards, by using the Kaplan−Meier method. TCGA dataset from AML patients of the intermediate group. e Schematic representation of the role played by BMPs on homeostasis under healthy conditions (top) and the cascade of dysregulations associated with increased concentration of BMP4 in the microenvironment of leukemic immature cells (bottom)

References

    1. Hirsch P, et al. Genetic hierarchy and temporal variegation in the clonal history of acute myeloid leukaemia. Nat. Commun. 2016;7:12475. doi: 10.1038/ncomms12475. - DOI - PMC - PubMed
    1. Zhou HS, Carter BZ, Andreeff M. Bone marrow niche-mediated survival of leukemia stem cells in acute myeloid leukemia: Yin and Yang. Cancer Biol. Med. 2016;13:248–259. doi: 10.20892/j.issn.2095-3941.2016.0023. - DOI - PMC - PubMed
    1. Shafat MS, et al. Leukemic blasts program bone marrow adipocytes to generate a protumoral microenvironment. Blood. 2017;129:1320–1332. doi: 10.1182/blood-2016-08-734798. - DOI - PubMed
    1. Toofan P, Wheadon H. Role of the bone morphogenic protein pathway in developmental haemopoiesis and leukaemogenesis. Biochem. Soc. Trans. 2016;44:1455–1463. doi: 10.1042/BST20160104. - DOI - PubMed
    1. Kirmizitas A, Meiklejohn S, Ciau-Uitz A, Stephenson R, Patient R. Dissecting BMP signaling input into the gene regulatory networks driving specification of the blood stem cell lineage. Proc. Natl. Acad. Sci. USA. 2017;114:5814–5821. doi: 10.1073/pnas.1610615114. - DOI - PMC - PubMed

Publication types

MeSH terms

Substances