. 2018 Sep 27;9(1):3967.
doi: 10.1038/s41467-018-05528-3.

Hallmarks of primate lentiviral immunodeficiency infection recapitulate loss of innate lymphoid cells

Affiliations

Hallmarks of primate lentiviral immunodeficiency infection recapitulate loss of innate lymphoid cells

Joseph C Mudd et al. Nat Commun. .

Abstract

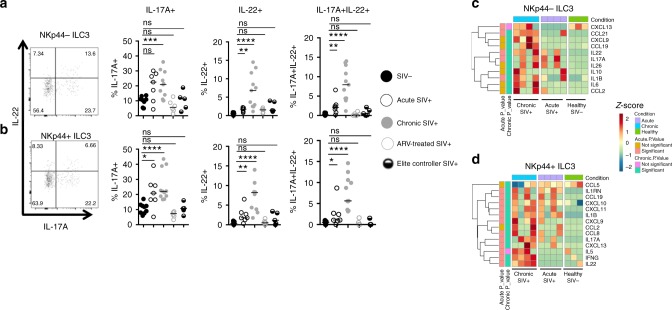
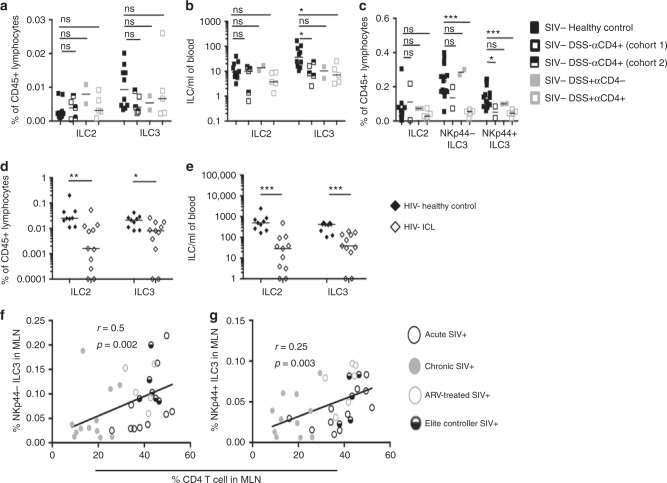
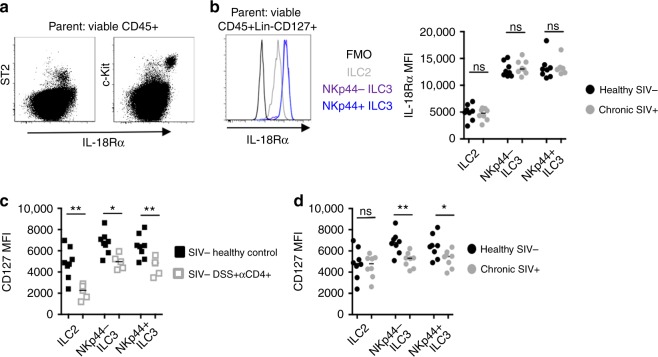
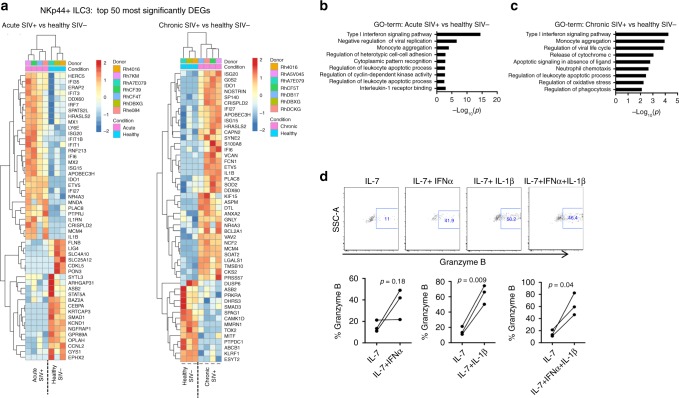
Innate lymphoid cells (ILCs) play critical roles in mucosal barrier defense and tissue homeostasis. While ILCs are depleted in HIV-1 infection, this phenomenon is not a generalized feature of all viral infections. Here we show in untreated SIV-infected rhesus macaques (RMs) that ILC3s are lost rapidly in mesenteric lymph nodes (MLNs), yet preserved in SIV+ RMs with pharmacologic or natural control of viremia. In healthy uninfected RMs, experimental depletion of CD4+ T cells in combination with dextran sodium sulfate (DSS) is sufficient to reduce ILC frequencies in the MLN. In this setting and in chronic SIV+ RMs, IL-7Rα chain expression diminishes on ILC3s in contrast to the IL-18Rα chain expression which remains stable. In HIV-uninfected patients with durable CD4+ T cell deficiency (deemed idiopathic CD4+ lymphopenia), similar ILC deficiencies in blood were observed, collectively identifying determinants of ILC homeostasis in primates and potential mechanisms underlying their depletion in HIV/SIV infection.


Conflict of interest statement

The authors declare no competing interests.

Figures

Fig. 1
Fig. 1
Defining ILCs in nonhuman primates. a Representative gating strategy for ILCs in the MLN of a healthy animal. b RORγT expression in MLN ILC subpopulations (N = 9). c GATA-3 expression in MLN ILC subpopulations (N = 7). d T-bet expression in MLN ILC subpopulations (N = 7). e Relative distribution of ILC subtype frequencies as a proportion of total lineage CD127+ cells in axillary, mesenteric lymphoid tissues, and jejunum (N = 7). Statistical significance was calculated using the Mann–Whitney test. ns = P > 0.05, * = P ≤ 0.05, ** = P ≤ 0.01, *** = P ≤ 0.001, and **** = P ≤ 0.0001
Fig. 2
Fig. 2
Local and systemic depletion of ILCs in untreated SIV infection. a Frequencies of MLN ILCs in healthy uninfected RMs (N = 10), untreated acute and chronic SIV-infected RMs (N = 10) (N = 11), chronic SIV+ RMs receiving ART (N = 6), and SIV-infected ECs (N = 4). Determined as a proportion of viable CD45+ hematopoietic cells. b Summary data of CD3-c-Kit+ cell number per area of paracortical region in the MLN. c Relationship between c-Kit+ LC3 proportions assessed by flow cytometry and c-Kit+ ILC3 enumeration by microscopy. d Frequencies of ILC3s in jejunal cell suspensions. e Correlation of NKp44+ ILC3 frequencies in animals with matching MLN and jejunal samples at the time of necropsy. f Frequencies of ILCs in axillary lymph nodes. g Relationship between NKp44+ ILC3 frequencies in the MLN and sCD14 in plasma. Statistical significance was calculated using the Mann–Whitney test. A Pearson's correlation was calculated for panels c, e, and g. ns = P > 0.05, * = P ≤ 0.05, ** = P ≤ 0.01, *** = P ≤ 0.001, and **** = P ≤ 0.0001
Fig. 3
Fig. 3
ILC dysfunction in the SIV+ MLN normalizes with ART or elite control. a Frequencies of MLN ILCs in cell cycle in healthy uninfected RMs, untreated acute, and chronic SIV-infected RMs, chronic SIV+ RMs receiving ART, and SIV-infected ECs. b Frequencies of MLN ILCs shown to express active caspase-3 in the uninfected and SIV+ MLN. c Relationship between NKp44+ ILC3 frequencies in the MLN and NKp44+ ILC3s expressing active caspase-3. d Percentage of MLN ILCs expressing HLA-DR. e Percentage of MLN ILCs expressing granzyme B. Statistical significance was calculated using the Mann–Whitney test. A Pearson's correlation was calculated for panel (c). ns = P > 0.05, * = P ≤ 0.05, ** = P ≤ 0.01, *** = P ≤ 0.001, and **** = P ≤ 0.0001
Fig. 4
Fig. 4
IL-13 production is impaired in ILC2 cells in MLNs that are marked by ST2 expression. a Plot of ST2 expression in total ILC compartment against IL-13 production in total ILC compartment. b Correlation between ST2+ ILCs and IL-13-producing ILCs in a cohort of uninfected animals. c Mes LNMCs from healthy, acute, or chronically SIV-infected animals were stimulated for 6 h with PMA/ionomycin. Intracellular IL-13 expression was measured in ILC1, ILC2, and ILC3 subtypes. d Gene expression profiles of cytokines produced by ILC2. Color scheme in both heatmaps represents the number of standard deviations above (red) or below (blue) the mean. Statistical significance was determined by the Mann–Whitney test. A Spearmann's correlation was calculated for panel b. ns = P > 0.05, * = P ≤ 0.05, ** = P ≤ 0.01, *** = P ≤ 0.001, and **** = P ≤ 0.0001
Fig. 5
Fig. 5
SIV infection is associated with significant functional changes in MLN ILCs. Mesenteric lymph node mononuclear cells from healthy (N = 7), acute (N = 7), chronic (N = 9), ART-treated (N = 6), or EC SIV-infected animals (N = 5) were stimulated for 6 h with PMA/ionomycin. Intracellular IL-17A and IL-22 expression was measured in NKp44 (a) or NKp44+ (b) ILC3. Gene expression profiles of selected cytokines and chemokines produced by NKp44 (c) and NKp44+ (d) ILC3s in the SIV (N = 3) and the untreated acute (N = 4) and chronic (N = 4) SIV+ MLN. Color scheme in both heatmaps represents number of standard deviations above (red) or below (blue) the mean. Statistical significance was determined by the Mann–Whitney test for a, b. Statistical significance of c, d was determined using the Wald test with Bonferroni correction for multiple comparisons. ns = P > 0.05, * = P ≤ 0.05, ** = P ≤ 0.01, *** = P ≤ 0.001, and **** = P ≤ 0.0001
Fig. 6
Fig. 6
Deficient ILCs in CD4 lymphopenic HIV/SIV-uninfected human and nonhuman primates. a Frequencies and b absolute numbers of ILC subsets in blood of uninfected control animals (N = 9), animals receiving DSS (N = 2), or animals experimentally depleted of CD4 T cells with (N = 5) or without DSS treatment (N = 5). c Frequencies of ILCs in MLN of healthy control, SIV-uninfected DSS-treated, αCD4-treated, or animals receiving both treatments. d Frequencies and e absolute numbers of blood ILCs in healthy (N = 10) and ICL (N = 11) human subjects. Correlation between f NKp44 ILC3 and g NKp44+ ILC3 percentages and CD4 T cell percentage in the MLN of SIV+ RMs. Statistical significance was calculated using the Mann–Whitney test. A Pearson's correlation was calculated for panels f, g. ns = P > 0.05, * = P ≤ 0.05, ** = P ≤ 0.01, *** = P ≤ 0.001, and **** = P ≤ 0.0001
Fig. 7
Fig. 7
CD4 depletion in RMs reduces CD127 surface expression on MLN ILCs. a Representative dot plots of IL-18Rα expression on ST2 and c-Kit-expressing hematopoietic cells in the MLN. b MLN ILCs were defined by CD127 surface expression and IL-18Rα MFI was assessed on MLN ILCs from healthy uninfected (N = 8) and chronic SIV+ RMs (N = 7). c ILCs were defined by IL-18Rα surface expression and CD127 MFI were assessed on MLN ILCs from SIV healthy control (N = 8) and DSS+ αCD4+ RMs (N = 5). d Summary data of CD127 surface expression on IL-18Rα-expressing ILCs in the SIV-uninfected and chronic SIV+ MLN (N = 7). Statistical significance in panels bd were calculated using the Mann-Whitney test. ns = P > 0.05, * = P ≤ 0.05, ** = P ≤ 0.01, *** = P ≤ 0.001, and **** = P ≤ 0.0001
Fig. 8
Fig. 8
NKp44+ ILC3s exhibit robust IFN gene signatures in the SIV+ MLN. a Gene expression profiles of the top 50 most significantly DEGs among NKp44+ ILC3s in the acute (N = 3) and chronic SIV+ MLN (N = 4). Color scheme represent standardized gene expression (z-score) with red and blue signifying up-regulated and down-regulated genes, respectively. The list of top 50 DEGs in a were functionally annotated by GO term analysis for significantly enriched pathways in acute SIV+ (b) and chronic SIV+ contrasts (c). Significance was determined by a Fisher’s exact test on the likelihood of their association compared to other genes in the gene universe. d ILC subpopulations from MLNs of healthy animals (N = 3) were sorted and stimulated with IL-7 in the presence or absence of IL-1β and/or IFNα. Intracellular granzyme B was assessed following 6 days of culture. Significance was determined using the paired Student’s t test. ns = P > 0.05, * = P ≤ 0.05, ** = P ≤ 0.01, *** = P ≤ 0.001, and **** = P ≤ 0.0001

Similar articles

Cited by

References

    1. Brenchley JM, et al. Microbial translocation is a cause of systemic immune activation in chronic HIV infection. Nat. Med. 2006;12:1365–1371. doi: 10.1038/nm1511. - DOI - PubMed
    1. Estes JD, et al. Damaged intestinal epithelial integrity linked to microbial translocation in pathogenic simian immunodeficiency virus infections. PLoS. Pathog. 2010;6:e1001052. doi: 10.1371/journal.ppat.1001052. - DOI - PMC - PubMed
    1. Mattapallil JJ, et al. Massive infection and loss of memory CD4+ T cells in multiple tissues during acute SIV infection. Nature. 2005;434:1093–1097. doi: 10.1038/nature03501. - DOI - PubMed
    1. Pandrea IV, et al. Acute loss of intestinal CD4+ T cells is not predictive of simian immunodeficiency virus virulence. J. Immunol. 2007;179:3035–3046. doi: 10.4049/jimmunol.179.5.3035. - DOI - PMC - PubMed
    1. Hao XP, et al. Experimental colitis in SIV-uninfected rhesus macaques recapitulates important features of pathogenic SIV infection. Nat. Commun. 2015;6:8020. doi: 10.1038/ncomms9020. - DOI - PMC - PubMed

Publication types

MeSH terms