. 2018 Sep 27;9(1):3960.
doi: 10.1038/s41467-018-06277-z.

Nuclear lamina dysfunction triggers a germline stem cell checkpoint

Affiliations

Nuclear lamina dysfunction triggers a germline stem cell checkpoint

Lacy J Barton et al. Nat Commun. .

Abstract

LEM domain (LEM-D) proteins are conserved components of the nuclear lamina (NL) that contribute to stem cell maintenance through poorly understood mechanisms. The Drosophila emerin homolog Otefin (Ote) is required for maintenance of germline stem cells (GSCs) and gametogenesis. Here, we show that ote mutants carry germ cell-specific changes in nuclear architecture that are linked to GSC loss. Strikingly, we found that both GSC death and gametogenesis are rescued by inactivation of the DNA damage response (DDR) kinases, ATR and Chk2. Whereas the germline checkpoint draws from components of the DDR pathway, genetic and cytological features of the GSC checkpoint differ from the canonical pathway. Instead, structural deformation of the NL correlates with checkpoint activation. Despite remarkably normal oogenesis, rescued oocytes do not support embryogenesis. Taken together, these data suggest that NL dysfunction caused by Otefin loss triggers a GSC-specific checkpoint that contributes to maintenance of gamete quality.


Conflict of interest statement

The authors declare no competing interests.

Figures

Fig. 1
Fig. 1
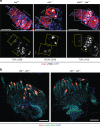
Loss of Ote causes germline stem cell-specific NL defects. a Schematic of the Drosophila nuclear lamina (NL). Underneath the inner nuclear envelope (yellow) resides the NL (blue) that contains three Drosophila LEM-D proteins, Otefin (Ote), Bocksbeutel (Bocks α and β), and dMAN1. Each protein localizes to the NL using a domain (orange, Peripheral localization, PL) that interacts with lamin or using transmembrane domains (orange, TM). Proteins in the LEM-D family carry a LEM-D (blue) that binds Barrier-to-Autointegration Factor (BAF, green), to promote chromatin assembly at the nuclear periphery. b Confocal images of ote+/+ and ote−/− (oteB279G/PK) nuclei stained with antibodies against Lamin Dm0 (red) and Heterochromatin protein 1a (HP1a; green). Scale bars, 2.5 μm
Fig. 2
Fig. 2
Chk2 activation is responsible for oogenesis defects in ote mutants. a, b Confocal images of ovaries dissected from less than 2-day-old females stained for Vasa (red) and DAPI (white). Genotypes are noted on the top of each image, wherein    ote−/− corresponds to oteB279G/PK. The chk2- alleles were either deletion alleles (a) or a kinase dead allele (Table S1, b). Scale bars represent 250 µm (a) or 100 µm (b). c Fecundity (eggs per female per day) of females mated to ote+/+ males as a function of female age in days. Bars indicate the standard deviation from a minimum of three independent experiments, assaying 7–15 females each time. Genotypes are noted to the right of each line. d Quantification of germarial phenotypic classes, as described on the right. Genotypes are listed below the corresponding bar, with the number of germaria scored listed at the top. e Percentage of eggs that hatched within 48 h following deposition by females that were mated to ote+/+ males. Bars represent the standard deviation from at least two independent experiments. The number of eggs analyzed is noted above each bar. f Volcano plot of gene expression microarray results. The x-axis shows fold change between NULL (chk2P6, otePK/ oteB279G and otePK/ chk2P30, oteB279G), and HET (chk2P6, otePK/ CyO and chk2P30, oteB279G/ CyO) ovaries and the y-axis shows one-way ANOVA p value; areas corresponding to twofold change cutoff and p < 0.05 are shaded, points corresponding to significantly decreasing or increasing RNAs are colored blue and red, respectively
Fig. 3
Fig. 3
Select DDR components contribute to the checkpoint pathway in ote mutants. a Schematic representation of signaling through the DNA damage response (DDR) pathway. Common triggers that activate the ATM and ATR responder kinases are shown. The responder kinases canonically activate the Chk2 and Chk1 transducer kinases, which signal to p53 and cause cell death. b Quantification of peak fecundity (eggs per female per day) of ddr, ote double-mutant females crossed to ote+/+ males. Genotypes are noted below each bar, with ote−/− corresponding to oteB279G/PK. Error bars represent the standard deviation from a minimum of two independent experiments, each using 7–15 females. c Fecundity (eggs per female per day) of ddr, ote double-mutant females of indicated genotypes, crossed to wild-type males, with ote−/− corresponding to oteB279G/PK. Genotypes are noted above the graph. Error bars indicate the standard deviation from a minimum of three independent experiments with 7–15 females each. Wild-type data from Fig. 2c. were included in the graph as a reference. d. Quantification of germarial phenotypic classes (noted to the right) in 2-day-old ddr, ote double-mutant females, with ote−/− corresponding to oteB279G/PK. Number of germaria assessed from at least ten females is noted above each bar
Fig. 4
Fig. 4
DNA damage in ote−/− GSCs is downstream of Chk2. a Confocal images of germaria stained with antibodies against Vasa (red), DNA damage marker γ-H2Av (grayscale) and with DAPI (blue). Genotypes are noted above each image, wherein ote−/− corresponds to oteB279G/PK and chk2−/− corresponding to chk2P6/P30. Bottom: Image of the signal in the γ-H2Av channel. Boxes and brackets indicate GSCs and meiotic germ cells, respectively. Dashed line indicates the position of GSC niche. The percentage of γ-H2Av-positive GSCs is noted at the bottom of the γ-H2Av image, with the number of GSCs analyzed in parenthesis. All scale bars represent 20 µm. b Confocal images of whole mount ovaries dissected from ote mutants with heterozygous or homozygous loss of Claspin (Cla). Ovaries were stained for Vasa (red), Lamin Dm0 (green), and DNA (DAPI, blue), revealing the absence of suppression of ote mutant phenotypes. Genotypes are indicated at the top of each image, with ote−/− corresponding to oteB279G/PK; scale bars represent 100 µm
Fig. 5
Fig. 5
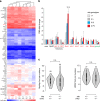
Transposon transcription and telomere capping are unchanged in ote mutants. a Heat map of the log2 signal intensities of RNAs corresponding to D. melanogaster transposons (indicated to the left); unsupervised clustering reveals no segregation by genotype. The genotypes are shown below. b Quantitative RT-PCR analysis of transposon RNAs in the ovary. For Ote-containing genotypes (light and dark gray), ovaries were dissected from less than two-hour old females, and for ote null genotypes (blue and red), ovaries were dissected from 3-day-old females. Transposons analyzed are noted below (red indicates germline transposons and green indicates somatic transposons). RNAs were normalized to vasa and fold change is shown relative to ote+/+. Error bars indicate standard deviation from three biological replicates (*p < 0.05, Student’s t-test comparing RNAs from ote mutant ovaries to RNAs from oteB279G/+ ovaries). c Violin plots of the number of HipHop foci (left) or HOAP foci (right) per GSC nucleus in 1-day-old females. Numbers of GSCs analyzed are noted above each plot. Significance was assessed by Student’s t-test; n.s., not significant
Fig. 6
Fig. 6
HP1a coalescence does not lead to increased γH2Av staining or GSC loss. a Confocal images of germaria and GSC nuclei in females carrying either the nosgal4:vp16 driver alone (top) or the nosgal4:vp16 and the D1EP473 allele (bottom). Ovaries were stained with antibodies against HP1a (green), γ-H2Av (white), and Ote (red). The percentage of γ-H2Av-positive GSCs is noted at the bottom of the GSC image, with the number of GSCs analyzed in parenthesis. Scale bars represent 5 μm. b Box plots of the quantification of HP1a foci per GSC nucleus found in GSCs of the indicated genotype. Genotypes are noted below each box plot, and the number of nuclei analyzed is noted above each top whisker. An A indicates absence of the nosgal4:vp16 driver or the D1EP allele, and P indicates their presence. For each box plot, the box represents the 25th to 75th percentile interval, the line represents the median and the whiskers represent the 5th to 95th percentile interval and non-outlier range. Asterisks indicate significance (one-way ANOVA, ns = not significant, **<0.01, ***<0.001, ****<0.0001). c Confocal images of a GSC nucleus from 1-day-old chk2−/−, ote−/− females stained for Lamin Dm0 (red) and HP1a (green), revealing that nuclear structural defects are upstream of Chk2. Genotypes are listed above each image. The chk2−/− corresponds to chk2P6/chk2P30 and ote−/− corresponds to oteB279G/PK. The box outlines GSCs. Scale bars represent 5 μm
Fig. 7
Fig. 7
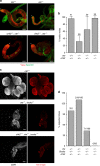
Checkpoint inhibition rescues male GSC, but not somatic defects in ote mutants. a Confocal images of testes from 6-day-old males stained for Vasa (red) and Spectrin (green). Genotypes are noted above the images. The GSC niche is denoted by an asterisk. b Percentage of fertile 12–15-day-old males mated to ote+/+ virgin females. Males were determined to be fertile if greater than 5 offspring were produced over a 3-day mating period as described in ref. . Genotypes are noted below, and the number of males analyzed is noted above each data set. Error bars indicate the standard deviation from a minimum of three independent experiments. c Confocal images of the central nervous system and surrounding imaginal discs dissected from wandering third instar larvae stained for DAPI (gray) and antibodies against phosphorylated serine 10 of Histone H3 (H3 S10ph; red). Genotypes are noted above each image. All scale bars are 100 µm. d Percent expected class from the following cross: y1,w67c23; chk2P6,otePK/CyO; bocksΔ66/Tm6b,Tb1 crossed to y1,w67c23; chk2P30,oteB279G/CyO; bocksΔ10/Tm6b,Tb1. The genotype of the progeny is noted below and the number of progeny eclosed over the expected number is noted above
Fig. 8
Fig. 8
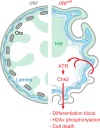
Loss of Otefin activates a NL checkpoint in GSCs. In ote+/+ GSCs (left side), Ote (gray bars) resides within the NL, stabilizing NL structure (blue ribbon) and heterochromatin (green shading) contacts. In ote−/− GSCs (right side), the NL becomes thick and deformed, causing NL dysfunction that activates a checkpoint pathway. This pathway uses the ATR and Chk2 kinases, leading to blocked differentiation, H2Av phosphorylation, and, ultimately, death of GSCs. As loss of ATR/Chk2 in ote mutants rescues oogenesis, but not embryogenesis, we suggest this NL checkpoint pathway functions to ensure that healthy gametes are passed on to the next generation

Similar articles

Cited by

References

    1. Wilson KL, Foisner R. Lamin-binding proteins. Cold Spring Harb. Perspect. Biol. 2010;2:a000554. doi: 10.1101/cshperspect.a000554. - DOI - PMC - PubMed
    1. Barton LJ, Soshnev AA, Geyer PK. Networking in the nucleus: a spotlight on LEM-domain proteins. Curr. Opin. Cell Biol. 2015;34:1–8. doi: 10.1016/j.ceb.2015.03.005. - DOI - PMC - PubMed
    1. Brachner A, Foisner R. Evolvement of LEM proteins as chromatin tethers at the nuclear periphery. Biochem. Soc. Trans. 2011;39:1735–1741. doi: 10.1042/BST20110724. - DOI - PMC - PubMed
    1. Samwer M, et al. DNA cross-bridging shapes a single nucleus from a set of mitotic chromosomes. Cell. 2017;170:956–972 e923. doi: 10.1016/j.cell.2017.07.038. - DOI - PMC - PubMed
    1. Gonzalez-Aguilera C, et al. Genome-wide analysis links emerin to neuromuscular junction activity in Caenorhabditis elegans. Genome Biol. 2014;15:R21. doi: 10.1186/gb-2014-15-2-r21. - DOI - PMC - PubMed

Publication types

MeSH terms