. 2018 Sep 27;8(1):14449.
doi: 10.1038/s41598-018-32425-y.

Crystallographic texture and mineral concentration quantification of developing and mature human incisal enamel

Affiliations

Crystallographic texture and mineral concentration quantification of developing and mature human incisal enamel

Mohammed Al-Mosawi et al. Sci Rep. .

Abstract

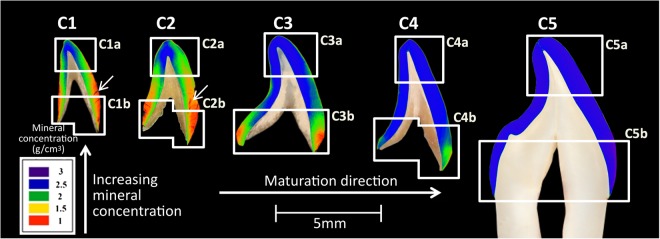
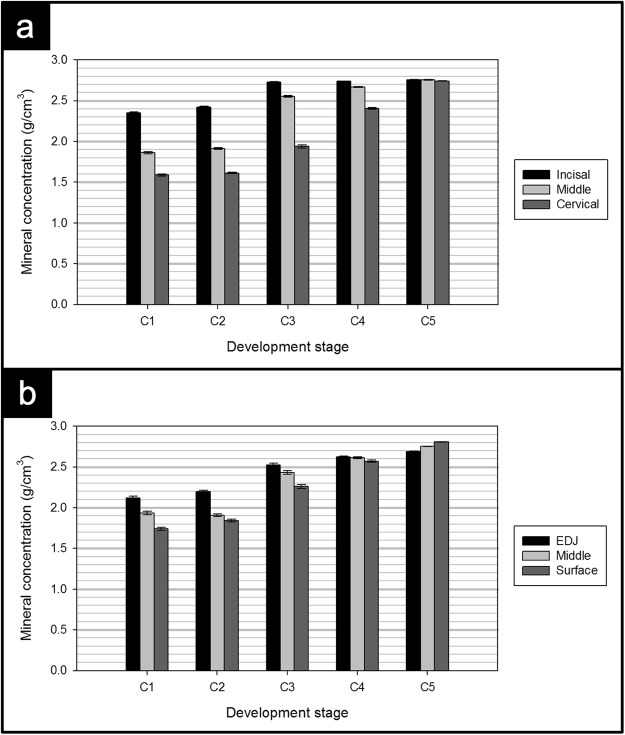
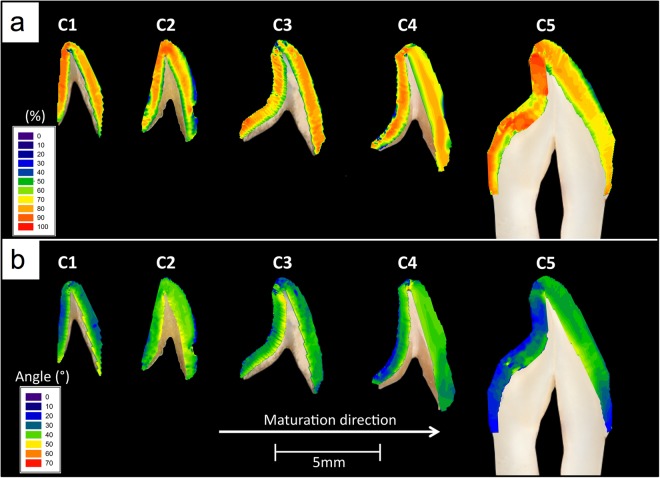
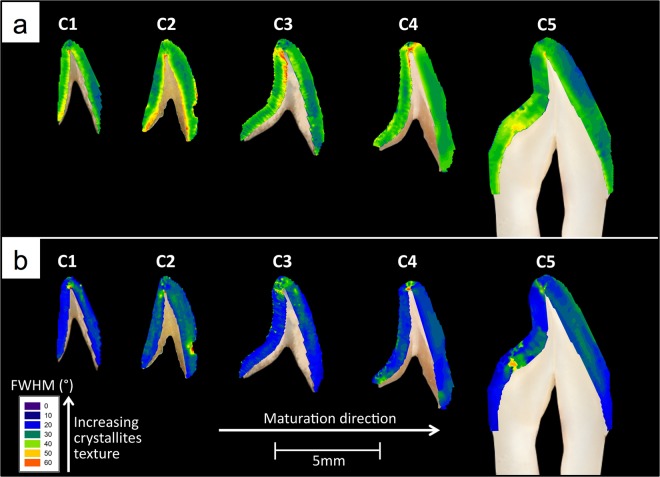
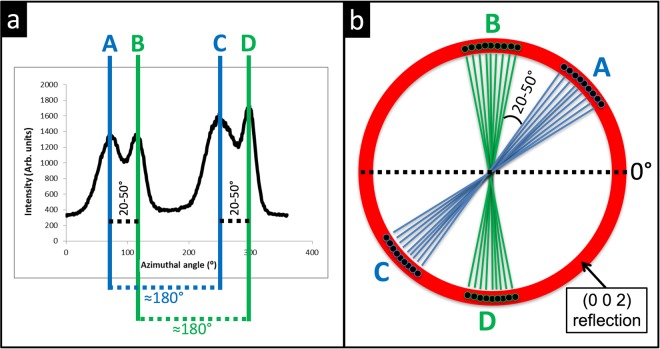
For human dental enamel, what is the precise mineralization progression spatially and the precise timing of mineralization? This is an important question in the fundamental understanding of matrix-mediated biomineralization events, but in particular because we can use our understanding of this natural tissue growth in humans to develop biomimetic approaches to repair and replace lost enamel tissue. It is important to understand human tissues in particular since different species have quite distinct spatial and temporal progression of mineralization. In this study, five human central incisors at different stages of enamel maturation/mineralization were spatially mapped using synchrotron X-ray diffraction and X-ray microtomography techniques. From the earliest developmental stage, two crystallite-orientation populations coexist with angular separations between the crystallite populations of approximately 40° varying as a function of position within the tooth crown. In general, one population had significantly lower texture magnitude and contributed a higher percentage to the overall crystalline structure, compared to the other population which contributed only 20-30% but had significantly higher texture magnitude. This quantitative analysis allows us to understand the complex and co-operative structure-function relationship between two populations of crystallites within human enamel. There was an increase in the mineral concentration from the enamel-dentin junction peripherally and from the incisal tip cervically as a function of maturation time. Quantitative backscattered-electron analyses showed that mineralization of prism cores precedes that of prism boundaries. These results provide new insights into the precise understanding of the natural growth of human enamel.


Conflict of interest statement

The authors declare no competing interests.

Figures

Figure 1
Figure 1
Mineral concentration distribution maps of central incisal enamel at various developmental stages. For each tooth section labial is on the right hand side.
Figure 2
Figure 2
(a) Vertical and (b) horizontal distribution of mineral concentration of central incisal enamel at various developmental stages.
Figure 3
Figure 3
Texture direction maps of crystallites from the first orientation population in enamel at various developmental stages. Two regions were selected and magnified to show the texture directions of crystallites from both orientation populations. For each tooth section the labial surface is on the right hand side.
Figure 4
Figure 4
(a) The percentage of crystallites belonging to the first orientation population and (b) the angle between the two orientation populations in central incisal enamel at various development stages. For each tooth section the labial surface is on the right hand side.
Figure 5
Figure 5
Texture magnitude distribution of crystallites from the (a) first and (b) second orientation populations in central incisal enamel at various development stages. For each tooth section labial is on the right hand side.
Figure 6
Figure 6
qBSE images at various locations of central incisors at (ag) early-, (hp) mid- and (qy) full- development. The arrows in images (f) and (p) indicate hypomineralized intra-prismatic regions. For each labial section the enamel surface is on the right hand side.
Figure 7
Figure 7
A proposed model representing the texture magnitude and direction of the two orientation populations as they span the enamel thickness. The thicker the lines, the lower the texture magnitude and the higher the number of lines, the higher the population percentage.
Figure 8
Figure 8
Photographs of the four human permanent maxillary central incisors at various developmental stages obtained from the 12th–16th century AD medieval cemetery of Blackfriars (Gloucester, UK).
Figure 9
Figure 9
Schematic diagram of (a) the XMT experimental setup using the MuCAT 2 scanner (QMUL) and a typical XMT slice showing the 18 regions and how they are divided for (b) vertical and (c) horizontal analyses.
Figure 10
Figure 10
Photographs of the 0.3 mm thick slices of human permanent maxillary central incisors at various developmental stages. For each tooth section, labial is on the right hand side.
Figure 11
Figure 11
A diagram showing the (a) S-XRD experimental setup and the relation between (b) the c-axis of a c-HAp crystallite and (c) the (002) reflection in a typical diffraction pattern. (d) The azimuthal 1-D profile of the (002) reflection obtained from the deconvolution of the 2-D diffraction patterns can be used to determine crystalline texture (e) magnitude and (f) direction.
Figure 12
Figure 12
(a) A typical (002) reflection curve displaying the variations in intensity around the (002) reflection. Peaks A and C are separated by approximately 180°, as with peaks B and D. Peaks A and B and peaks C and D are separated by 20–50°. (b) A schematic showing the two orientation populations of crystallites, where peaks A and C represent the first population and peaks B and D represent the second population with an angular separation of 20–50° between them.

References

    1. Stack, M. V. Chemical organization of the organic matrix of enamel. In Miles, A. E. W. (ed.) Structural and Chemical Organization of Teeth, vol. 2, chap. 20, 317–346 (Academic Press, London, 1967).
    1. Robinson C, Kirkham J, Brookes SJ, Bonass WA, Shore RC. The chemistry of enamel development. Int. J. Dev. Biol. 1995;39:145–152. - PubMed
    1. Elliott, J. C. Structure, crystal chemistry and density of enamel apatites. In Dental Enamel (Ciba Foundation Symposium), vol. 205, 54–72 (John Wiley & Sons Ltd., West Sussex, 1997). - PubMed
    1. Elliott, J. C. Hydroxyapatite and nonstoichiometric apatites. In Structure and Chemistry of the Apatites and Other Calcium Orthophosphates, vol. 18, chap. 3, 111–189 (Elsevier, Amsterdam, 1994).
    1. Rönnholm E. The amelogenesis of human teeth as revealed by electron microscopy: II. The development of the enamel crystallites. J. ultrastructure research. 1962;6:249–303. doi: 10.1016/S0022-5320(62)80036-7. - DOI - PubMed

Publication types