

Parallelized, real-time, metabolic-rate measurements from individual Drosophila
- PMID: 30262912
- PMCID: PMC6160429
- DOI: 10.1038/s41598-018-32744-0
Parallelized, real-time, metabolic-rate measurements from individual Drosophila
Abstract
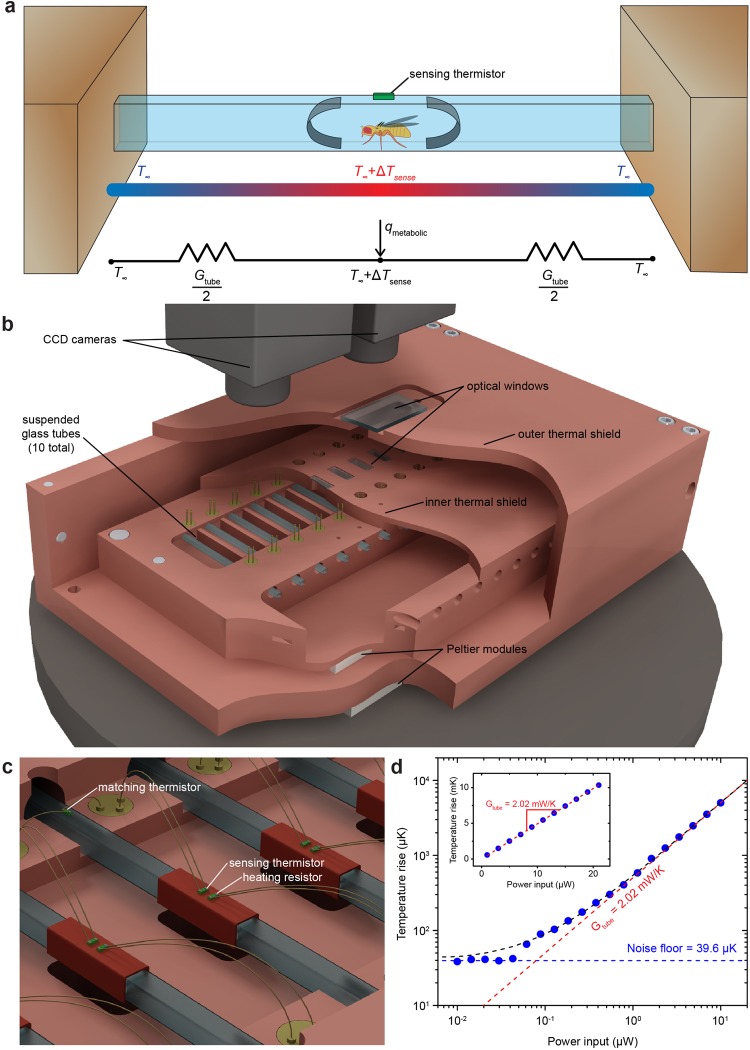
Significant recent evidence suggests that metabolism is intricately linked to the regulation and dysfunction of complex cellular and physiological responses ranging from altered metabolic programs in cancers and aging to circadian rhythms and molecular clocks. While the metabolic pathways and their fundamental control mechanisms are well established, the precise cellular mechanisms underpinning, for example, enzymatic pathway control, substrate preferences or metabolic rates, remain far less certain. Comprehensive, continuous metabolic studies on model organisms, such as the fruit fly Drosophila melanogaster, may provide a critical tool for deciphering these complex physiological responses. Here, we describe the development of a high-resolution calorimeter, which combines sensitive thermometry with optical imaging to concurrently perform measurements of the metabolic rate of ten individual flies, in real-time, with ~100 nW resolution. Using this calorimeter we have measured the mass-specific metabolic rates of flies of different genotypes, ages, and flies fed with different diets. This powerful new approach enables systematic studies of the metabolic regulation related to cellular and physiological function and disease mechanisms.
Conflict of interest statement
The authors declare no competing interests.
Figures
Similar articles
-
Circadian Rhythms and Sleep in Drosophila melanogaster.Genetics. 2017 Apr;205(4):1373-1397. doi: 10.1534/genetics.115.185157. Genetics. 2017. PMID: 28360128 Free PMC article. Review.
-
Chronic circadian misalignment results in reduced longevity and large-scale changes in gene expression in Drosophila.BMC Genomics. 2019 Jan 7;20(1):14. doi: 10.1186/s12864-018-5401-7. BMC Genomics. 2019. PMID: 30616504 Free PMC article.
-
Robustness of circadian timing systems evolves in the fruit fly Drosophila melanogaster as a correlated response to selection for adult emergence in a narrow window of time.Chronobiol Int. 2012 Dec;29(10):1312-28. doi: 10.3109/07420528.2012.728550. Epub 2012 Nov 6. Chronobiol Int. 2012. PMID: 23130824
-
Circadian clocks of faster developing fruit fly populations also age faster.Biogerontology. 2014 Feb;15(1):33-45. doi: 10.1007/s10522-013-9467-y. Epub 2013 Oct 2. Biogerontology. 2014. PMID: 24085519
-
Genetics and molecular biology of rhythms in Drosophila and other insects.Adv Genet. 2003;48:1-280. doi: 10.1016/s0065-2660(03)48000-0. Adv Genet. 2003. PMID: 12593455 Review.
Cited by
-
Phenotyping of Drosophila Melanogaster-A Nutritional Perspective.Biomolecules. 2022 Jan 27;12(2):221. doi: 10.3390/biom12020221. Biomolecules. 2022. PMID: 35204721 Free PMC article. Review.
-
Neuromorphic computing for robotic vision: algorithms to hardware advances.Commun Eng. 2025 Aug 13;4(1):152. doi: 10.1038/s44172-025-00492-5. Commun Eng. 2025. PMID: 40804110 Free PMC article. Review.
-
Measuring metabolic rate in single flies during sleep and waking states via indirect calorimetry.J Neurosci Methods. 2022 Jul 1;376:109606. doi: 10.1016/j.jneumeth.2022.109606. Epub 2022 Apr 26. J Neurosci Methods. 2022. PMID: 35483506 Free PMC article.
-
RNA virus-mediated changes in organismal oxygen consumption rate in young and old Drosophila melanogaster males.Aging (Albany NY). 2023 Mar 22;15(6):1748-1767. doi: 10.18632/aging.204593. Epub 2023 Mar 22. Aging (Albany NY). 2023. PMID: 36947702 Free PMC article.
-
Molecular and Neural Mechanisms of Temperature Preference Rhythm in Drosophila melanogaster.J Biol Rhythms. 2023 Aug;38(4):326-340. doi: 10.1177/07487304231171624. Epub 2023 May 24. J Biol Rhythms. 2023. PMID: 37222551 Free PMC article. Review.
References
-
- Alberts, B., Wilson, J. H. & Hunt, T. Molecular biology of the cell. 5th edn., (Garland Science, 2008).
-
- Voet, D. & Voet, J. G. Biochemistry. 4th edn., (John Wiley & Sons, 2011).
-
- Pearl, R. The Rate of Living. (A.A. Knopf, 1928).
Publication types
MeSH terms
LinkOut - more resources
Full Text Sources
Other Literature Sources
Molecular Biology Databases
