. 2018 Oct 1;210(0):9-28.
doi: 10.1039/c8fd00134k.

Nanoscale electrochemical kinetics & dynamics: the challenges and opportunities of single-entity measurements

Affiliations

Nanoscale electrochemical kinetics & dynamics: the challenges and opportunities of single-entity measurements

M A Edwards et al. Faraday Discuss. .

Abstract

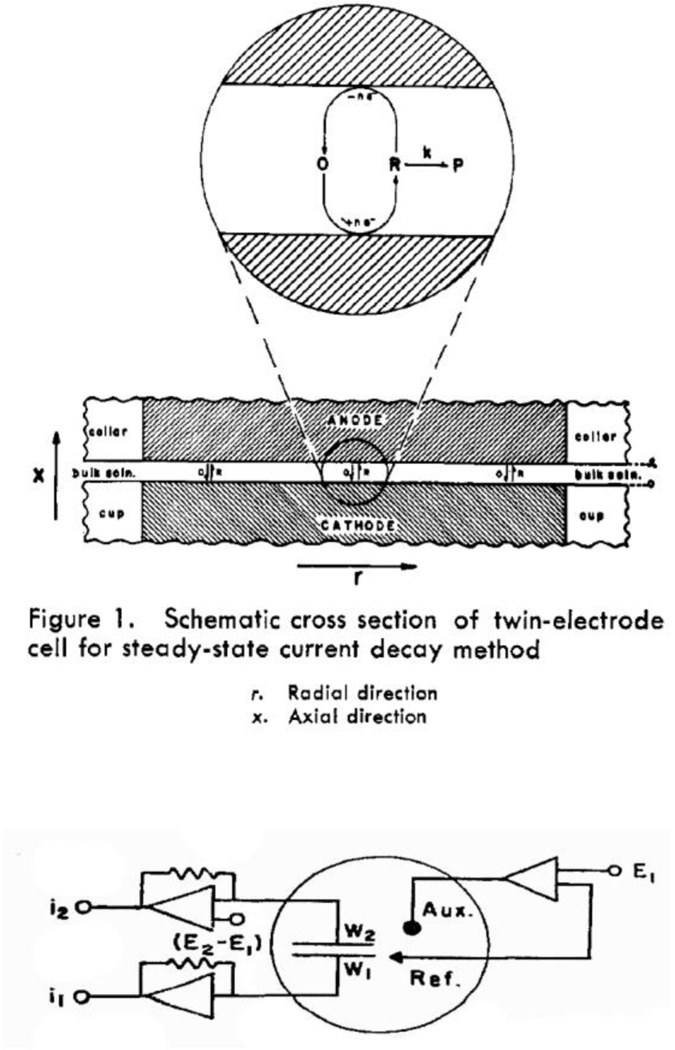
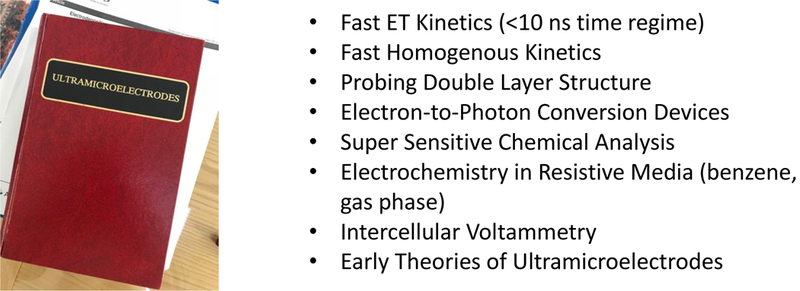
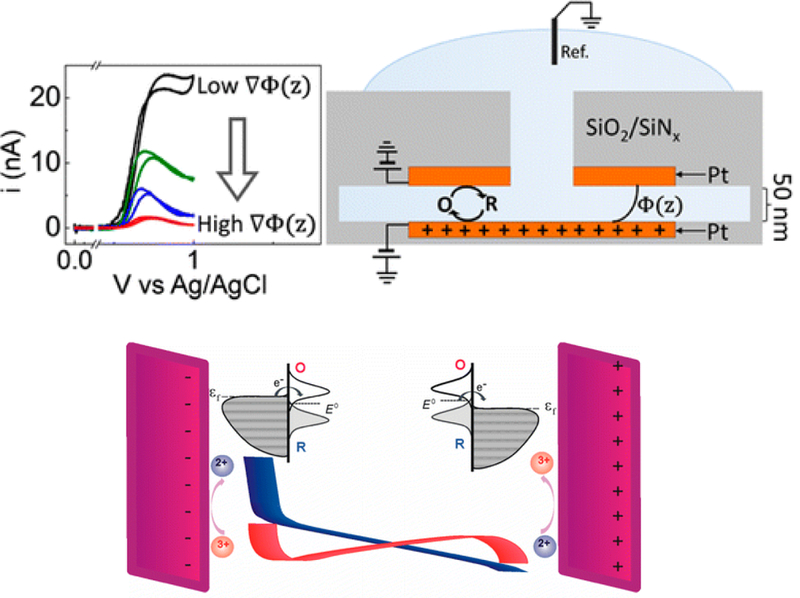
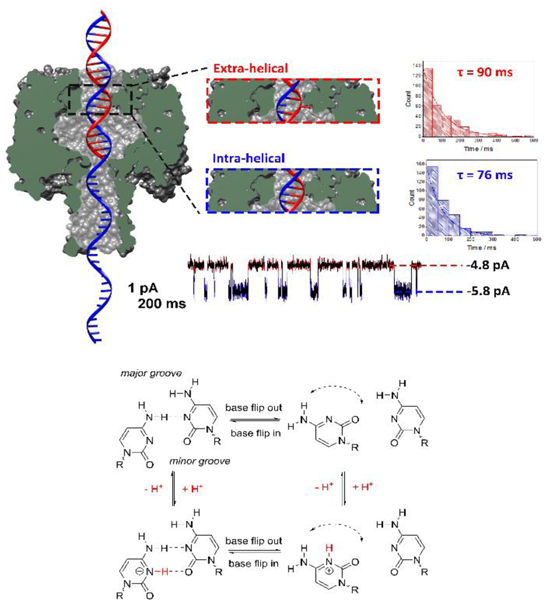
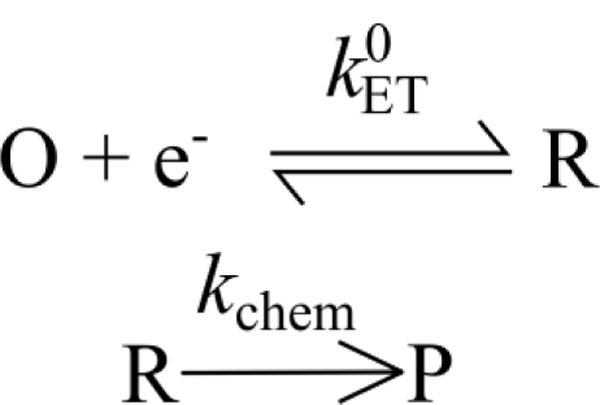
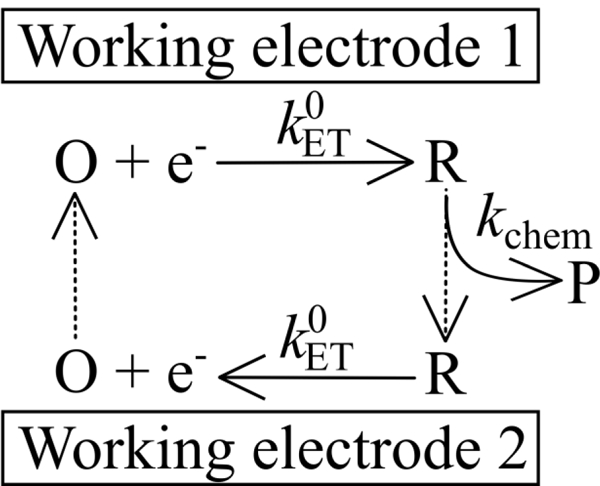
The development of nanoscale electrochemistry since the mid-1980s has been predominately coupled with steady-state voltammetric (i-E) methods. This research has been driven by the desire to understand the mechanisms of very fast electrochemical reactions, by electroanalytical measurements in small volumes and unusual media, including in vivo measurements, and by research on correlating electrocatalytic activity, e.g., O2 reduction reaction, with nanoparticle size and structure. Exploration of the behavior of nanoelectrochemical structures (nanoelectrodes, nanoparticles, nanogap cells, etc.) of a characteristic dimension λ using steady-state i-E methods generally relies on the well-known relationship, λ2 ∼ Dt, which relates diffusional lengths to time, t, through the coefficient, D. Decreasing λ, by performing measurements at a nanometric length scales, results in a decrease in the effective timescale of the measurement, and provides a direct means to probe the kinetics of steps associated with very rapid electrochemical reactions. For instance, steady-state voltammetry using a nanogap twin-electrode cell of characteristic width, λ ∼ 10 nm, allows investigations of events occurring at timescales on the order of ∼100 ns. Among many other advantages, decreasing λ also increases spatial resolution in electrochemical imaging, e.g., in scanning electrochemical microscopy, and allows probing of the electric double layer. This Introductory Lecture traces the evolution and driving forces behind the "λ2 ∼ Dt" steady-state approach to nanoscale electrochemistry, beginning in the late 1950s with the introduction of the rotating ring-disk electrode and twin-electrode thin-layer cells, and evolving to current-day investigations using nanoelectrodes, scanning nanocells for imaging, nanopores, and nanoparticles. The recent focus on so-called "single-entity" electrochemistry, in which individual and very short redox events are probed, is a significant departure from the steady-state approach, but provides new opportunities to probe reaction dynamics. The stochastic nature of very fast single-entity events challenges current electrochemical methods and modern electronics, as illustrated using recent experiments from the authors' laboratory.


Figures

Figure 1.
Figure 1.
Scanning electron micrographs of a ~250-nm-radius Pt nanodisk electrode formed by heating and pulling a micron-sized Pt wire inside a glass capillary. Top image shows the needle-like geometry of the entire electrode, bottom image shows the tip of the electrode with the bright spot in the center being the Pt nanodisk. Adapted from reference 3.
Figure 2.
Figure 2.
Scanning tunneling microscopy (STM) break junction measurement of the conductivity of a single 4,4′-vinylenedipyridine molecule. Protonation modulates the conductivity between high conductivity (HC) and low conductivity (LC) states. Figure adapted from reference 12.
Figure 3.
Figure 3.
Schematic of the measurement of fM concentrations of metal ions, Mn+ (e.g., Co2+, Ni2+, Pb2+), through electrocatalytic amplification. Oxidation of Mn+ to metal oxides (MOx) is accompanied by anodic spikes corresponding to electrocatalytic conversion of reactants, R, to products, P; e.g., water oxidation. Figure adapted from reference 30.
Figure 4.
Figure 4.
Original drawings of the thin-layer cell and twin-electrode circuitry introduced by Anderson and Reilley and for monitoring rapid chemical processes (RkP) during redox cycling. The two working electrodes, W1 and W2, were maintained at independent potentials, E1 and E2, with a dual op-amp scheme used to measure the two currents. Adapted from references 58 and 59.
Figure 5.
Figure 5.
(Top) Schematic of a nanogap cell during redox cycling of a single-molecule. (bottom) Experimentally measured current-time trace measured at the top (blue) and bottom (red) electrodes. Occasions where a single FcTMA0/+ molecule enters the gap and undergoes redox cycling, are visible by correlated increases/decreases in the current at the top/bottom electrode. The ability to detect a single molecule is due to rapid redox cycling. Adapted from reference 65.
Figure 6.
Figure 6.
Ultramicroelectrodes contained contributions from participants at a conference held in 1986 in Snowbird, Utah), outlining research topics and concepts pursued during the following decades.
Figure 7.
Figure 7.
Redox cycling at electrodes separated at distances approaching the Debye length display unusual steady-state voltammetric responses. These measurements have been analyzed using theory describing the electric double-layer and models of electron-transfer kinetics. Adapted from references 71 and 72.
Figure 8.
Figure 8.
Experimental and simulated results for partial oxidations of an individual Ag nanoparticle, 35 nm radius. (a) Current vs time (i-t) trace (bottom) resulting from multiple partial oxidation/collision events at a Au microelectrode, 6.25 μm radius, held at 600 mV vs Ag/AgCl wire (1.1 V vs SHE), acquired with 3-pole low-pass Bessel filter (10 kHz cutoff) and 50 kHz sampling rate, electrolyte: 20 mM potassium nitrate and 8 mM trisodium citrate. (b) Simulated 3-D motion trajectory over a 0.1 s time interval, starting (0 ms) and ending (100 ms) positions in trajectory trace as labelled. Au electrode (yellow) and glass sheath (light gray) drawn to scale. (c) Results of electrochemical random-walk simulation for a Ag nanoparticle, 35 nm radius, showing resulting i-t traces for ideal unfiltered current (black) over the first 100 ns of electrode-nanoparticle collisions/oxidations, cumulative collision count shown in red numeric labels. (d) Results from same simulation in part (c) shown over longer (0.1 ms) timescale with simulated filtered current (3-pole low-pass Bessel, 10 kHz cutoff frequency, 250 kHz sampling rate) shown in red (right vertical axis). Number of discrete simulated motion steps included in top horizontal axes for parts (c) and (d). Adapted from references 77 and 78.
Figure 9.
Figure 9.
Nucleation and growth of a single H2 nanobubble at a Pt nanoelectrode. A) Schematic corresponding to: ① H+ reduction, ② formation of critical H2 bubble nucleus, and ③ steady-state bubble sustained at the Pt surface. B) Top: voltammogram corresponding to nucleation and growth of a single H2 bubble. Dashed lines indicate the range of applied currents (iapp) for nucleation rate measurements. Bottom: Calculated nucleation rates (J) from classical nucleation theory as a function of voltage. Note the log scale for J. C) Cumulative probability distribution of nucleation induction time (tind) at different iapp measured from 40 individual nucleation events at each applied current. Figure adapted from reference 87.
Figure 10.
Figure 10.
Measuring the dynamics of the motion of an individual DNA base by monitoring the ionic current through a protein nanochannel. (Top) Cross-section of the α-HL protein nanopore with a double-stranded DNA molecule (with a single-stranded tail) captured in the vestibule. The dsDNA contains a cytosine-cytosine mismatch near the latch zone of the protein. The observed current displays a two state modulation on the millisecond timescale resulting from the dynamic base flipping of one of the cytosine bases between intrahelical and extrahelical states. Histograms of the duration times between the two current states, and single exponential fits, are used to measure the first-order lifetimes of the extra-helical (out of the helix) and intra-helical (within the helix) states. (Bottom) Square scheme depicting the protonation/deprotonation and the effect of pH on the number of hydrogen bonds within cytosine-cytosine base pair. Below the pKa of the cytosine mismatch, an additional hydrogen bond is formed decreasing the rate of base flipping. Although base flipping is a relatively slow process, the protonation/deprotonation that affects the flipping kinetics is immeasurably fast. Figure adapted from reference 99.
Scheme 1.
Scheme 1.
The ECi reaction, in which an irreversible chemical reaction follows an initial electron-transfer step.
Scheme 2.
Scheme 2.
The ErCi mechanism of Scheme 1 expressed in context of redox cycling, introduced in the 1965 Anderson-Reilley twin-electrode thin-layer cell., Redox cycling results in current amplification and the amount of cycling depends on the rate of the following chemical rate, kchem, and the “gap” distance between the electrodes. Clearly, larger values of kchem (i.e., faster chemical reactions) can be measured when the gap distance is reduced.

References

    1. Murray RW, Chem. Rev, 2008, 108, 2688–2720. - PubMed
    1. Oja SM, Fan YS, Armstrong CM, Defnet P and Zhang B, Anal. Chem, 2016, 88, 414–430. - PubMed
    1. Katemann BB and Schuhmann W, Electroanalysis, 2002, 14, 22–28.
    1. Yu Y, Sun T and Mirkin MV, Anal. Chem, 2016, 88, 11758–11766. - PubMed
    1. Wang W, Zhang J, Wang FF, Mao BW, Zhan DP and Tian ZQ, J. Am. Chem. Soc, 2016, 138, 9057–9060. - PubMed

Publication types

LinkOut - more resources