Meta-Analysis
. 2018 Nov;144(11):1200-1227.
doi: 10.1037/bul0000164. Epub 2018 Sep 27.

Low and variable correlation between reaction time costs and accuracy costs explained by accumulation models: Meta-analysis and simulations

Affiliations
Meta-Analysis

Low and variable correlation between reaction time costs and accuracy costs explained by accumulation models: Meta-analysis and simulations

Craig Hedge et al. Psychol Bull. 2018 Nov.

Abstract

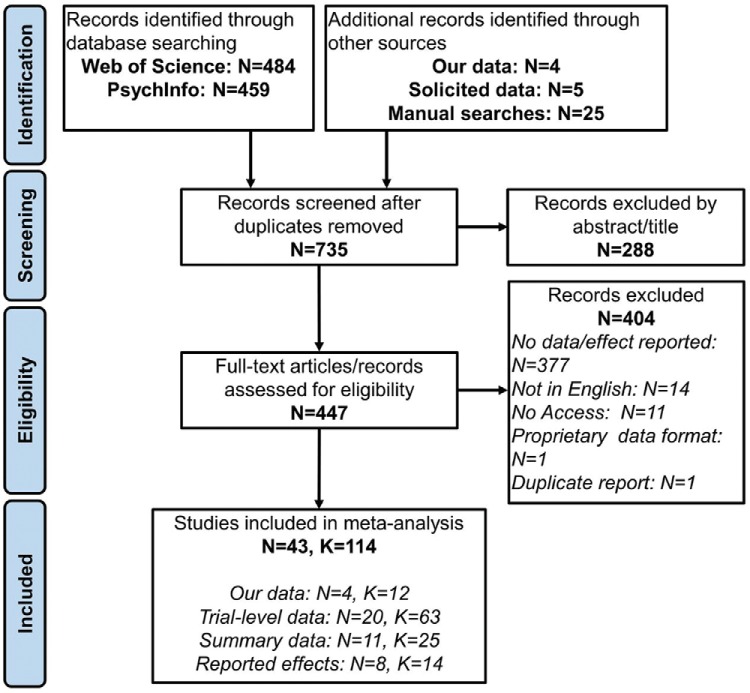
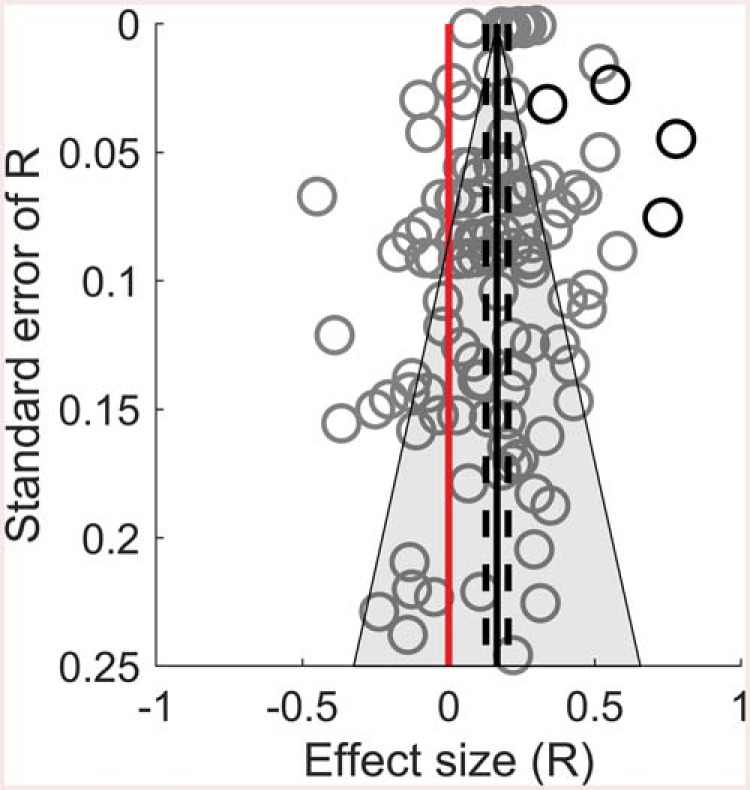
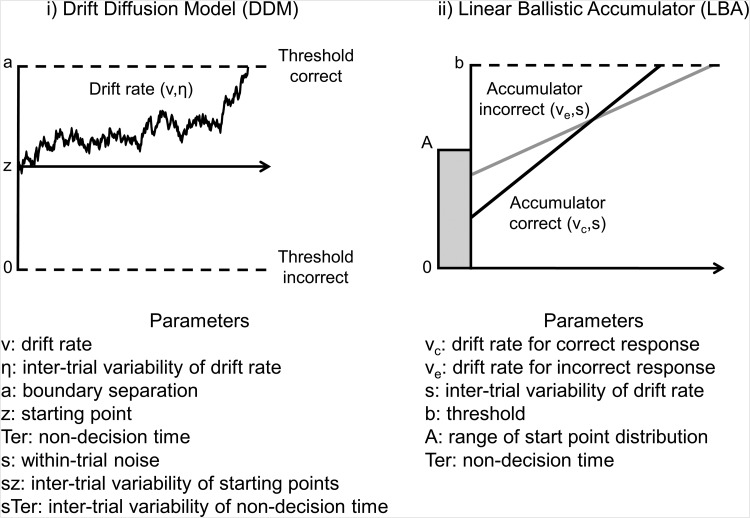
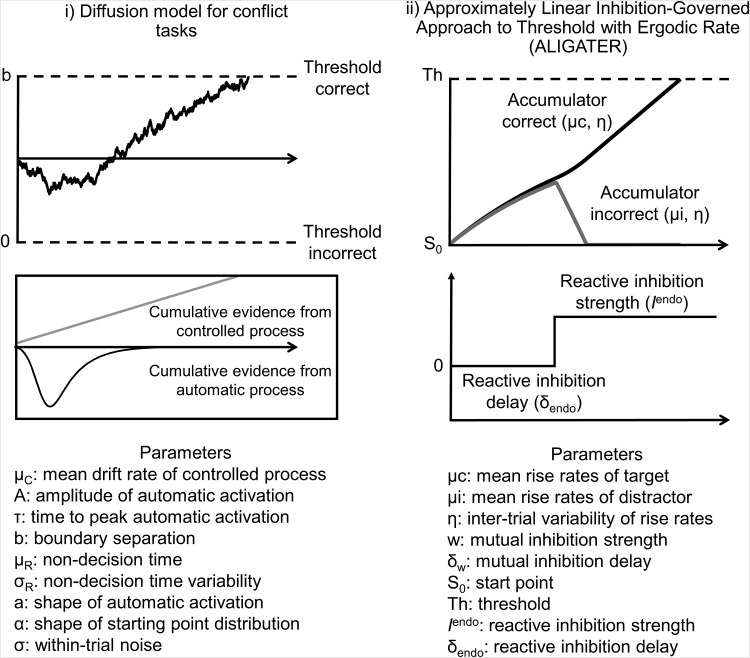
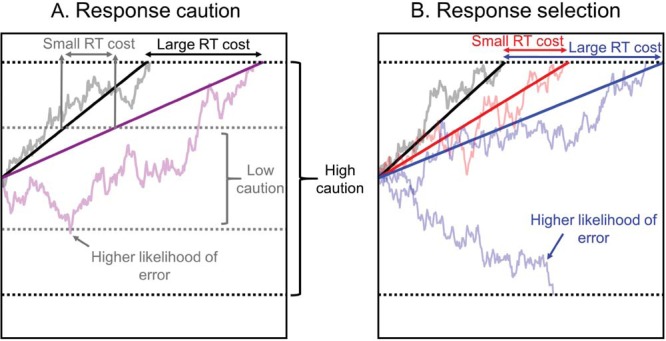
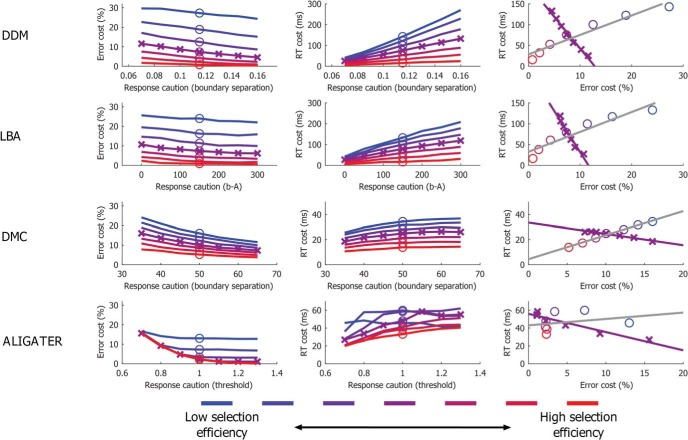
The underpinning assumption of much research on cognitive individual differences (or group differences) is that task performance indexes cognitive ability in that domain. In many tasks performance is measured by differences (costs) between conditions, which are widely assumed to index a psychological process of interest rather than extraneous factors such as speed-accuracy trade-offs (e.g., Stroop, implicit association task, lexical decision, antisaccade, Simon, Navon, flanker, and task switching). Relatedly, reaction time (RT) costs or error costs are interpreted similarly and used interchangeably in the literature. All of this assumes a strong correlation between RT-costs and error-costs from the same psychological effect. We conducted a meta-analysis to test this, with 114 effects across a range of well-known tasks. Counterintuitively, we found a general pattern of weak, and often no, association between RT and error costs (mean r = .17, range -.45 to .78). This general problem is accounted for by the theoretical framework of evidence accumulation models, which capture individual differences in (at least) 2 distinct ways. Differences affecting accumulation rate produce positive correlation. But this is cancelled out if individuals also differ in response threshold, which produces negative correlations. In the models, subtractions between conditions do not isolate processing costs from caution. To demonstrate the explanatory power of synthesizing the traditional subtraction method within a broader decision model framework, we confirm 2 predictions with new data. Thus, using error costs or RT costs is more than a pragmatic choice; the decision carries theoretical consequence that can be understood through the accumulation model framework. (PsycINFO Database Record (c) 2018 APA, all rights reserved).


Figures

Figure 1
Figure 1
PRISMA flow diagram illustrating our process for identifying eligible articles and datasets. N refers to records (articles or records on data repositories), K refers to correlations identified. Manual searches refers to records obtained through reference lists, Google, and manually searching data repositories (e.g. OSF.io).
Figure 2
Figure 2
Funnel plot of observed effect sizes (Pearson’s r) for correlations between RT costs and error costs with associated standard errors. Larger values on the y-axis reflect larger sample sizes. Solid black line indicates weighted mean effect from a random effects model. Grey area indicates 95% confidence region. Dashed black lines show 95% confidence intervals of the mean effect estimated from a random-effects model. Red line indicates an effect size of zero. The lexical decision task effects are shown in black circles, all other tasks are shown in gray (see text for details).
Figure 3
Figure 3
Schematic of two sequential sampling models. i) The drift-diffusion model (Ratcliff, 1978; Ratcliff & McKoon, 2008) consists of a single accumulator accruing evidence from a starting point (z) to one or the other response threshold (a and 0). The drift rate on each simulated trial is taken from a distribution that has a mean (v) and standard deviation (η) across trials, and is subject to within-trial noise (s). ii) The LBA model consists of an accumulator for each response option, accruing evidence to a common response threshold (b). On each simulated trial, drift rates are taken from distributions which have a mean (vc, ve) and standard deviation (s), and begin accumulating evidence from a starting point selected from a uniform distribution (A-0). The models also normally add non-decision time to capture sensory and motor delays, but here we simply assume this is a constant, as variance in non-decision time is not needed for our discussion.
Figure 4
Figure 4
Schematic of two sequential sample models for conflict tasks. i) The diffusion model for conflict tasks, DMC (Ulrich et al., 2015), an extension of the drift-diffusion model to accommodate the flanker and Simon tasks. The DMC adds a transient input for the irrelevant competing information (black gamma function in the lower panel) to the sustained linear process for the correct information (μc: grey line in the lower panel). The gamma function, defined by the parameters A, a and τ, provides an impulse function, so that the irrelevant features (e.g. the flankers) initially have a large input, which diminishes rapidly within the trial. ii) ALIGATER is an extension of LATER (Carpenter and Williams, 1995) originally tested in the context of saccadic interference effects (Bompas & Sumner, 2011). Two LATER units, one for the target and one for the distractor, attempt to rise to threshold while mutually inhibiting each other. To produce goal-directed selectivity ALIGATER includes reactive inhibition instead of altering drift rates. This inhibition attenuates the activation in the distractor node by a specified amount (Iendo) after a delay (δendo) (lower right panel).
Figure 5
Figure 5
Pattern of RT costs and Error costs produced by variation in response caution and selection in the drift diffusion model. Straight, solid lines show condition averages, faint lines show example individual trials. Black lines show drift rates in congruent/baseline condition, coloured lines show incongruent condition. A. Response caution: Individuals who are low in response caution will set a lower threshold (e.g. grey dotted line) than highly cautious individuals (black dotted line). This means not only that their RTs will be faster, but also the difference between conditions will be smaller, leading to smaller RT costs, noted by grey arrows compared to black arrows. However, the lower threshold will lead to more errors due to noise in the accumulation process, which can be overcome with higher thresholds (example trial in purple reaches the grey error threshold, but not the black error threshold). Note that this will predominantly affect the incongruent or more difficult condition, as errors are rare in congruent/baseline conditions, leading to higher relative error costs. B. Response selection: Individuals who have high selection efficiency will have relatively higher drift rates in incongruent conditions (red solid lines) compared to individuals with lower selection efficiency (blue solid lines), leading to smaller RT costs (noted by red arrows compared to blue arrows). Moreover, the higher drift rate means noise is less likely to cause the incorrect response (illustrated with blue example trial that reaches the error threshold). Note that individuals could also vary in their average drift rates in congruent conditions, and the conclusions would remain the same, since the same difference in drift rate between conditions creates larger costs if average drift rates are lower. For simplicity we keep average congruent drift rates constant in our simulations.
Figure 6
Figure 6
Simulated error costs and RT costs produced by four decision models. DDM = Drift-diffusion model, LBA = Linear ballistic accumulator model, DMC = Diffusion model for conflict tasks, ALIGATER = Approximately linear rise to threshold with ergodic rate. The first and second columns show the patterns of error costs and RT costs, respectively, as a function of variation in both caution and response selection as implemented in the different models (see main text for details). The third column shows the correlation between RT costs and error costs that arise from holding response selection constant and allowing caution to vary (purple line and crosses), and for allowing response selection to vary while caution is held constant (grey line and circles). Though the simulated data are often non-linear, linear trend lines are plotted for illustrative purposes since most studies of individual differences would calculate linear correlations. Note some changes of scale between plots, due to the range of parameters used, as guided by previous literature (see text). Trials with decision times longer than 2000 ms were excluded from the plots.

References

    1. Aichert D. S., Wöstmann N. M., Costa A., Macare C., Wenig J. R., Möller H. J., et al. Ettinger U. (2012). Associations between trait impulsivity and prepotent response inhibition. Journal of Clinical and Experimental Neuropsychology, 34, 1016–1032. 10.1080/13803395.2012.706261 - DOI - PubMed
    1. Arnold N. R., Bröder A., & Bayen U. J. (2015). Empirical validation of the diffusion model for recognition memory and a comparison of parameter-estimation methods. Psychological Research, 79, 882–898. 10.1007/s00426-014-0608-y - DOI - PMC - PubMed
    1. Awh E., Belopolsky A. V., & Theeuwes J. (2012). Top-down versus bottom-up attentional control: A failed theoretical dichotomy. Trends in Cognitive Sciences, 16, 437–443. 10.1016/j.tics.2012.06.010 - DOI - PMC - PubMed
    1. Balota D. A., Tse C. S., Hutchison K. A., Spieler D. H., Duchek J. M., & Morris J. C. (2010). Predicting conversion to dementia of the Alzheimer’s type in a healthy control sample: The power of errors in Stroop color naming. Psychology and Aging, 25, 208–218. 10.1037/a0017474 - DOI - PMC - PubMed
    1. Balota D. A., Yap M. J., Cortese M. J., Hutchison K. A., Kessler B., Loftis B., et al. Treiman R. (2007). The English Lexicon Project. Behavior Research Methods, 39, 445–459. 10.3758/BF03193014 - DOI - PubMed

Publication types