. 2018;13(9):988-1011.
doi: 10.1080/15592294.2018.1529504. Epub 2018 Oct 23.

Dynamic epimarks in sex-related genes predict gonad phenotype in the European sea bass, a fish with mixed genetic and environmental sex determination

Affiliations

Dynamic epimarks in sex-related genes predict gonad phenotype in the European sea bass, a fish with mixed genetic and environmental sex determination

Dafni Anastasiadi et al. Epigenetics. 2018.

Abstract

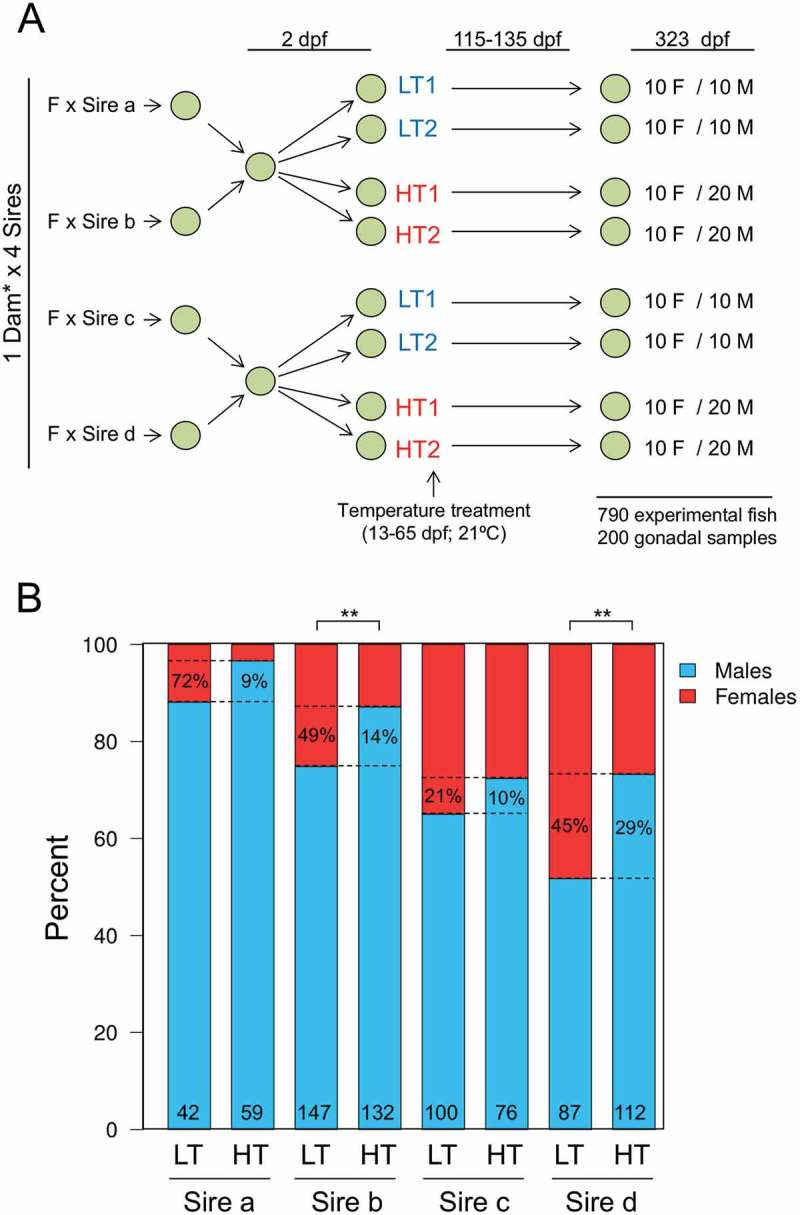
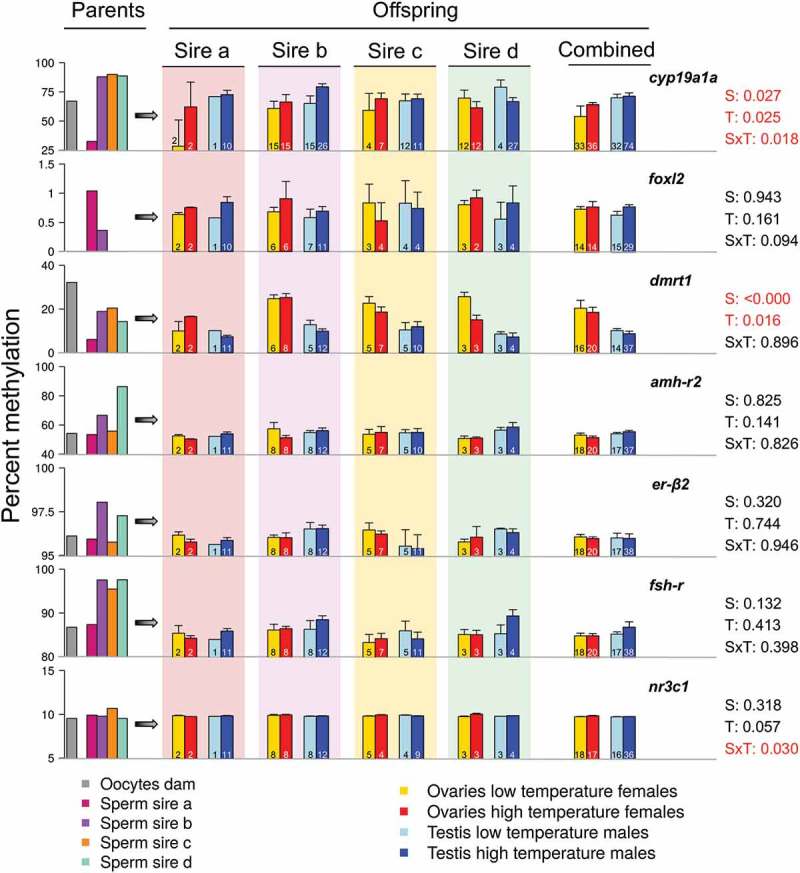
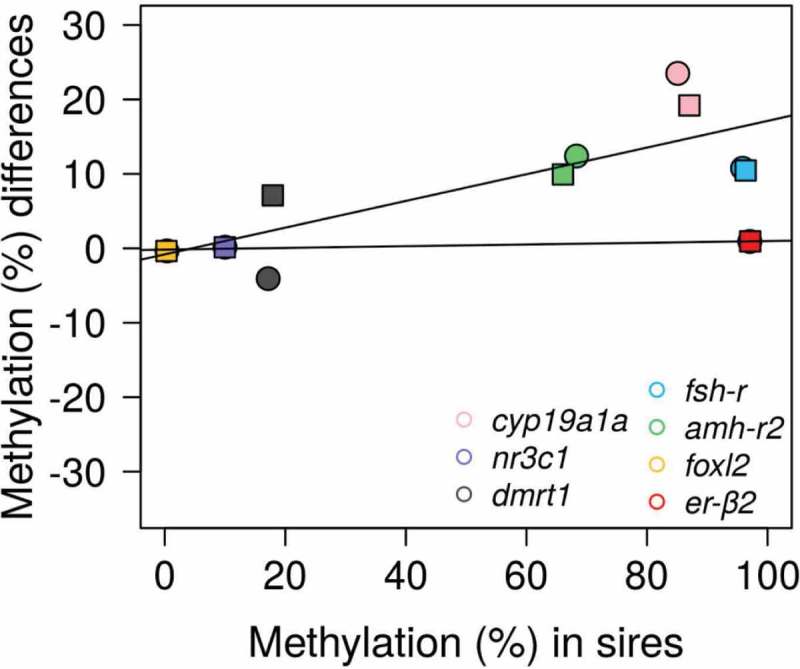
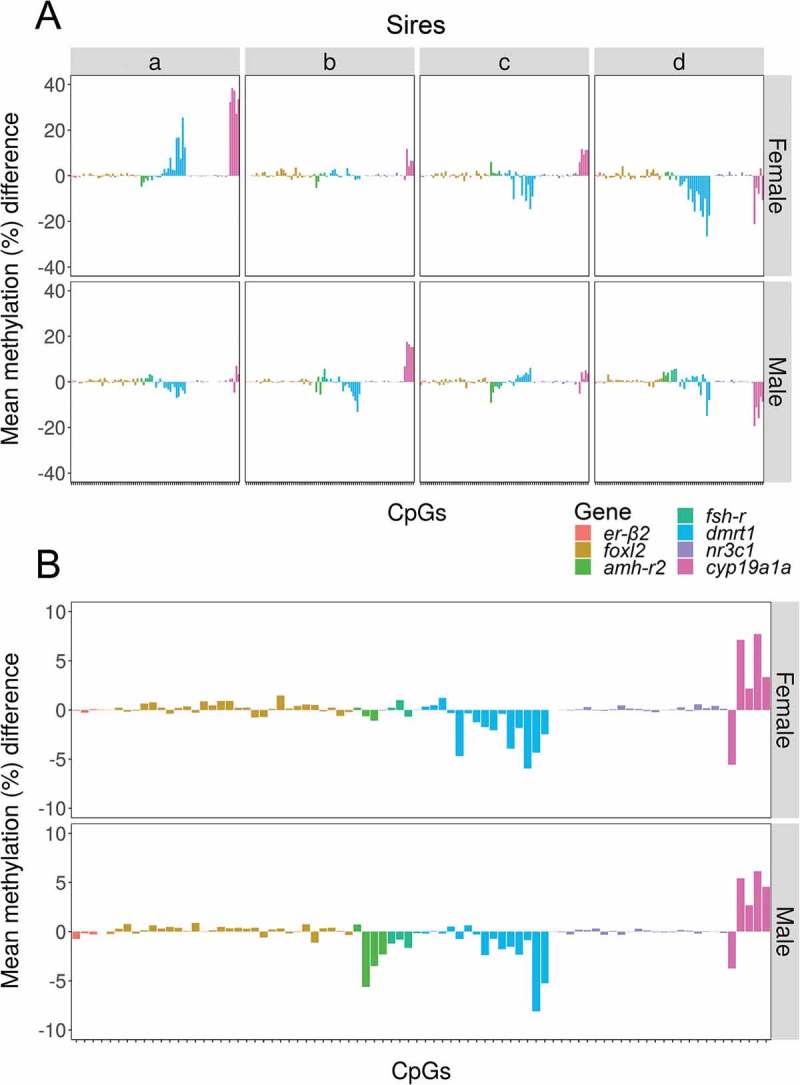
The integration of genomic and environmental influences into methylation patterns to bring about a phenotype is of central interest in developmental epigenetics, but many details are still unclear. The sex ratios of the species used here, the European sea bass, are determined by genetic and temperature influences. We created four families from parents known to produce offspring with different sex ratios, exposed larvae to masculinizing temperatures and examined, in juvenile gonads, the DNA methylation of seven genes related to sexual development by a targeted sequencing approach. The genes most affected by both genetics and environment were cyp19a1a and dmrt1, with contrasting sex-specific methylation and temperature responses. The relationship between cyp19a1a methylation and expression is relevant to the epigenetic regulation of vertebrate sex, and we report the evidence of such relationship only below a methylation threshold, ~ 80%, and that it was sex-specific: negatively correlated in females but positively correlated in males. From parents to offspring, the methylation in gonads was midway between oocytes and sperm, with bias towards oocytes for amh-r2, er-β2, fsh-r and cyp19a1a. In contrast, dmrt1 levels resembled those of sperm. The methylation of individual CpGs from foxl2, er-β2 and nr3c1 were conserved from parents to offspring, whereas those of cyp19a1a, dmrt1 and amh-r2 were affected by temperature. Utilizing a machine-learning procedure based on the methylation levels of a selected set of CpGs, we present the first, to our knowledge, system based on epigenetic marks capable of predicting sex in an animal with ~ 90% accuracy and discuss possible applications.

Keywords: DNA methylation; DNA methylation threshold; Early development; aromatase; cyp19a1a; dmrt1; environmental temperature; epigenetic inheritance; epigenetic marks; sex determination.


Figures

Figure 1.
Figure 1.
Experimental set-up and sex ratios of the offspring. (a) Experimental set-up of crossings and temperature treatments. Eggs were obtained from crossing sires known from previous trials to produce offspring with lower (sires a and b) or higher (sires c and d) percentage of females. The sires were crossed with two females, however the offspring of one dam only represented 0.9% of the total offspring and was thus excluded from further analysis. Two days post fertilization (dpf) eggs were mixed according to the male prone and female prone groups. On day 13, larvae from the two groups were divided into four with half of the fish being raised at low temperature (LT; 16.5ºC) and the other half at high temperature (HT; 21ºC) until 65 dpf, the end of the thermosensitive period. In each tank, an equal number of albino fish was added as a control for tank effects. Fish were sampled at one year of age (323 dpf) and gonad samples were taken from 10 females and 10 males for the LT groups and 10 females and 20 males from the HT groups from each tank. b) Paternal effects on European sea bass sex ratio and effects of elevated temperature. Percent of female (red) and male (blue) offspring of each sire (a, b, c and d) raised at low (LT) or high (HT) temperature. Absolute numbers of analyzed fish are shown in the bottom of each bar. The dotted lines indicate the differences of sex ratios between the LT and the HT offspring of each sire. The numbers between the dotted lines inside the LT bars indicate the percent of sex-reversed females among the LT females, while the numbers inside the HT bars indicate the percent of presumed neomales (sex-reversed females into males) among the HT males. The effects of temperature on sex ratios were assessed by Fisher’s exact test for count data and shown with the following equivalence: ** = < 0.01.
Figure 2.
Figure 2.
DNA methylation levels of the genes examined in the parents and the offspring. In the left part of the figure, the DNA methylation in the oocytes of the dam (grey), the sperm of sire a (deep pink), b (violet), c (orange) and d (green blue) is shown. The central and right part of the figure illustrate the DNA methylation levels in the offspring, separately by each sire with the background color indicating the corresponding sire and also, in the offspring of the four sires combined. The offspring is divided in four groups according to sex and temperature experienced during early development and DNA methylation values are shown in the ovaries of low (yellow) and high (red) temperature females and in the testis of low (light blue) and high (blue) temperature males. The far-right data indicate p-values for the effects of sex (S), temperature (T) or their interaction (SxT). The absolute numbers of fish analyzed in each case are shown inside the bars. Data as mean ± SEM.
Figure 3.
Figure 3.
Expression of cyp19a1a in gonads of females and males with low, intermediate or high DNA methylation levels. In the left side, the distribution of DNA methylation values is shown by individual points for females (F) and males (M). Datapoints in blue (low), green (intermediate) and red (high) correspond to the first, second and third terciles of the distribution, respectively. The central boxplots represent low (blue), intermediate (green) and high (red) DNA methylation levels in females and males. The boxplots on the right side display the distribution of cyp19a1a expression depending on the level of DNA methylation in females and males. The boxes include the values distributed between the lower and upper quartiles, the upper whisker = min(max(x), Q3 + 1.5 * IQR), the lower whisker = max(min(x), Q1 – 1.5 * IQR), where IQR = third quartile (Q3) – first quartile (Q1). The black dots inside the boxplots indicate the mean and the line the median. Asterisks represent the level of significance of Wilcox rank sum test between females and males: ns = not significant; *** = < 0.001. Notice the increase in inverse relationship between DNA methylation and gene expression with low methylation levels.
Figure 4.
Figure 4.
Correlations of expression of cyp19a1a and mean DNA methylation of the five central CpGs of its promoter. Correlations between cypa19a1a expression and promoter DNA methylation are shown by Spearman’s rank correlation coefficient (ρ) in the gonads of female and male offspring of sires b, c and d reared at low (LT) or high temperature (HT). There was insufficient data for offspring of sire a. The direction of the long axis of the ellipses and the color indicate the type of correlation, with negative shown in shades of red and positive shown in blue. The short axis of the ellipse and the color intensity are proportional to the correlation coefficients.
Figure 5.
Figure 5.
Methylation differences from sire to offspring in individual CpGs. Mean methylation difference in individual CpGs of the seven genes analyzed between the sperm and the gonads of their male and female offspring reared at low (control) temperature. Information is provided individually for sires a–d (a) and independently of sire (b). Data are shown as the mean of methylation differences of the corresponding sire to the individual fish in each group ± SEM.
Figure 6.
Figure 6.
Relationship of methylation in the sires and in the offspring. Scatterplot of the mean methylation differences per gene calculated as levels in the sires minus levels in their corresponding offspring reared at low temperature (female offspring: circles; male offspring: squares). Methylation differences close to zero indicate stable methylation levels, whereas differences above and below zero indicate hypomethylation and hypermethylation, respectively, in offspring vs. parents. The regression lines correspond to genes with low methylation differences between sires and offspring (foxl2, nr3c1 and er-β2) and genes with higher methylation differences between sires and offspring (cyp19a1a, dmrt1, fsh-r and amh-r2).
Figure 7.
Figure 7.
Methylation differences between high and low temperature in individual CpGs. Mean methylation difference in individual CpGs of the seven genes analyzed between the offspring reared at high vs. low temperature according to sex. Information is provided individually for sires a–d (a) and independently of sire (b). Data are shown as the difference of the mean methylation of individual fish reared at high temperature minus the mean methylation of individual fish reared at low temperature.
Figure 8.
Figure 8.
Prediction of offspring phenotypic sex using the methylation of selected CpGs as epigenetic biomarkers. (a) The DNA methylation levels of individual CpGs from the three genes that presented the highest differences between fish reared at low and at high temperature were the multiple variables used in the PCA. The individual fish are plotted as dots in the space of the two principal components. The percentage of variance explained by the two first components is shown in parenthesis. Of the total sample size available (n = 87), 83% (n = 72) were used as training set and are colored according to sex (female, red; male, blue) and 17% (n = 15) of the individual fish are colored in green for which the coordinates and hence the sex was predicted based on the training set (F, females; M, males). Confidence ellipses are drawn for the two groups and colored according to sex. The pink arrows point to the two predicted individuals for which prediction of sex failed. The names of the variables (Bn and Cn; n = 1, 2, …) correspond to the CpGs of informative genes. Of the total CpGs used for the PCA only the 10 with the highest contribution to the principal components are shown for clarity. (b) Distribution of the expression of cyp19a1a in females and males. Fish are divided in three groups based on the PCA analysis: training set, test set with success and test set with fail. The expression is shown by boxplots as 2ΔCq values for the first two groups and individual points for the third group. The boxes include the values distributed between the lower and upper quartiles, the upper whisker = min(max(x), Q3 + 1.5 * IQR), the lower whisker = max(min(x), Q1 – 1.5 * IQR), where IQR = third quartile (Q3) – first quartile (Q1), the black triangle indicates the mean, the tick line the median and the points outside the boxes represent values higher than the upper whisker. Statistical significance is shown as follows: ns = not significant; *** = < 0.001.

References

    1. Gilbert SF, Epel D.. Ecological developmental biology: integrating epigenetics, medicine, and evolution. Sunderland, MA: Sinauer Associates; 2008.
    1. Skinner MK. Role of epigenetics in developmental biology and transgenerational inheritance. Birth Defects Res Part C. 2011;93:51–55. - PMC - PubMed
    1. Piferrer F. Epigenetics of sex determination and gonadogenesis. Dev Dyn. 2013;242:360–370. - PubMed
    1. Piferrer F, Ribas L, Díaz N. Genomic approaches to study genetic and environmental influences on fish sex determination and differentiation. Mar Biotechnol. 2012;14:591–604. - PMC - PubMed
    1. Devlin RH, Nagahama Y. Sex determination and sex differentiation in fish: an overview of genetic, physiological, and environmental influences. Aquaculture. 2002;208:191–364.

Publication types