. 2018 Sep 28:7:e39636.
doi: 10.7554/eLife.39636.

Identification of functionally distinct fibro-inflammatory and adipogenic stromal subpopulations in visceral adipose tissue of adult mice

Affiliations

Identification of functionally distinct fibro-inflammatory and adipogenic stromal subpopulations in visceral adipose tissue of adult mice

Chelsea Hepler et al. Elife. .

Abstract

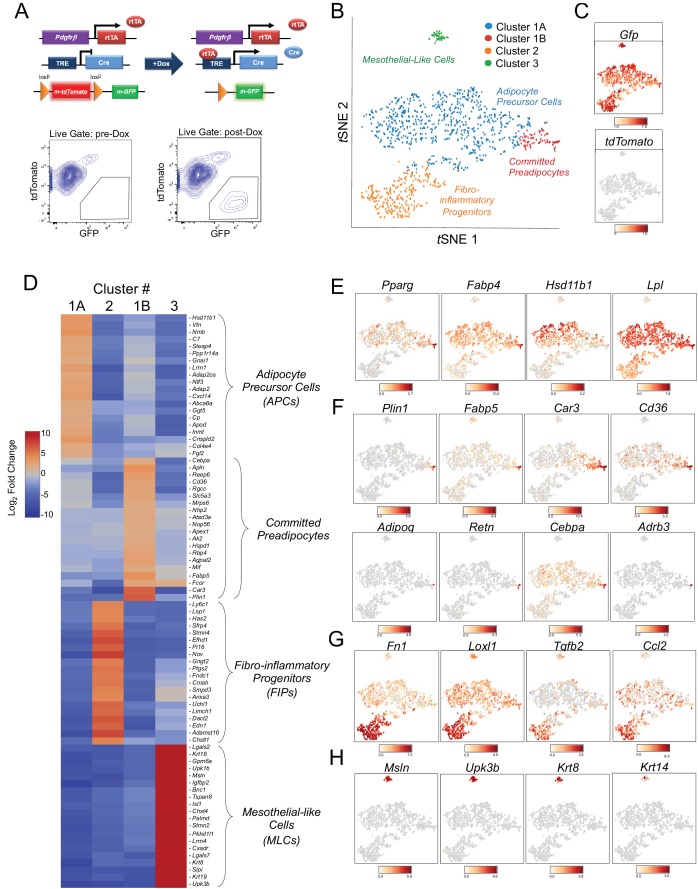
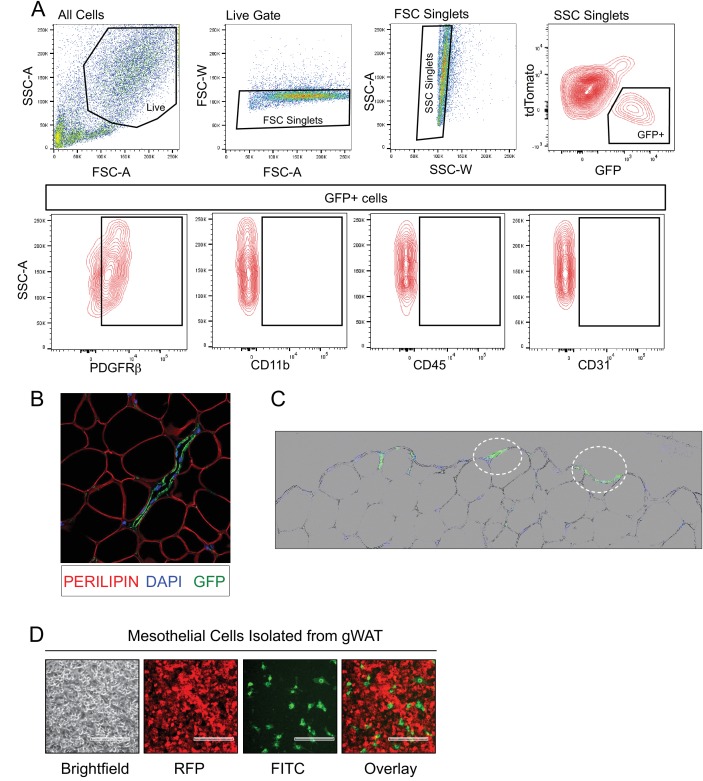
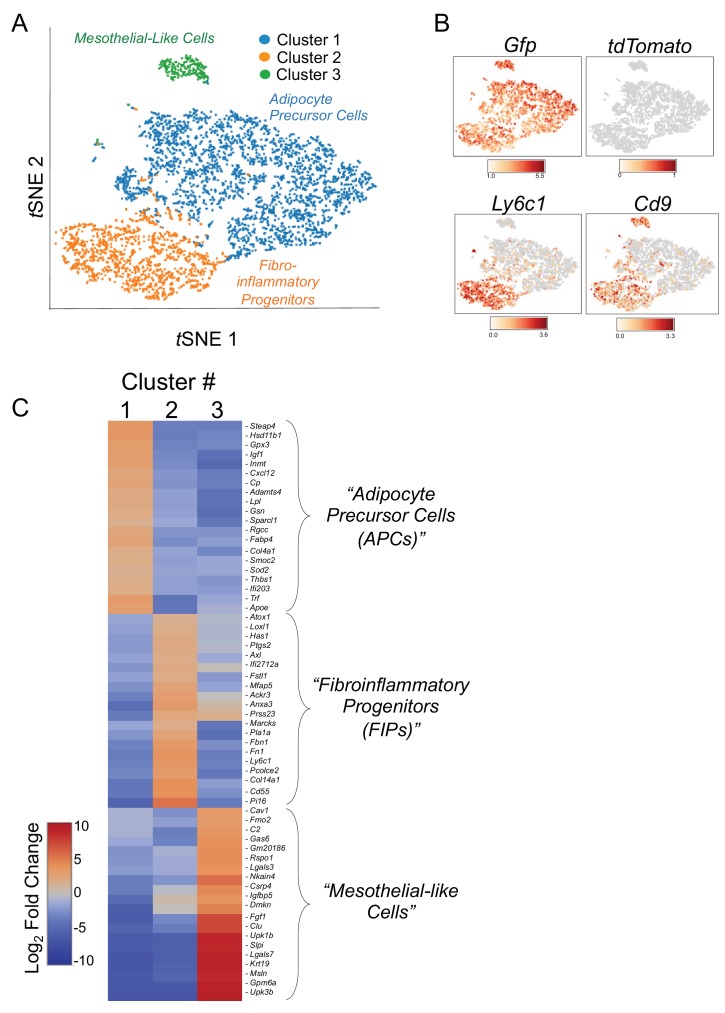
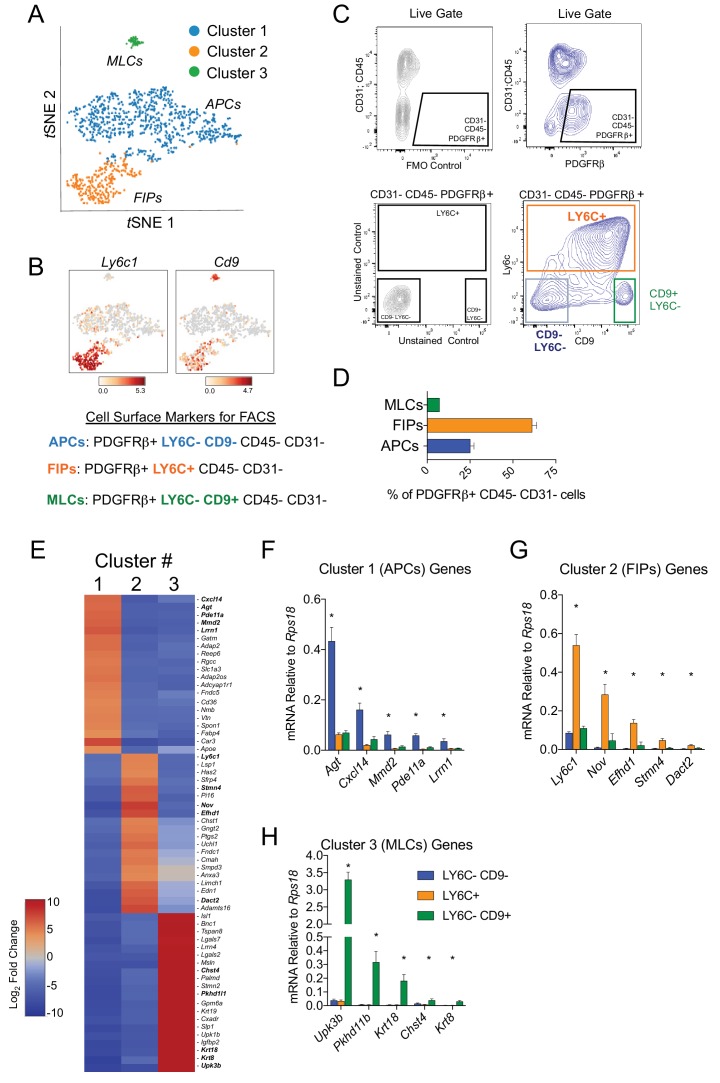
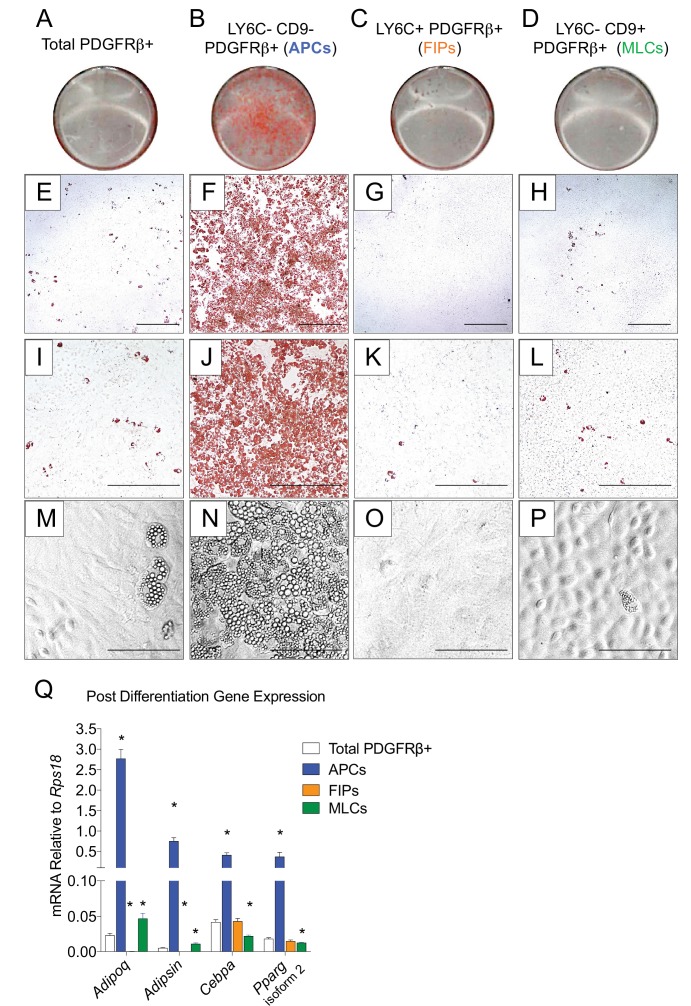
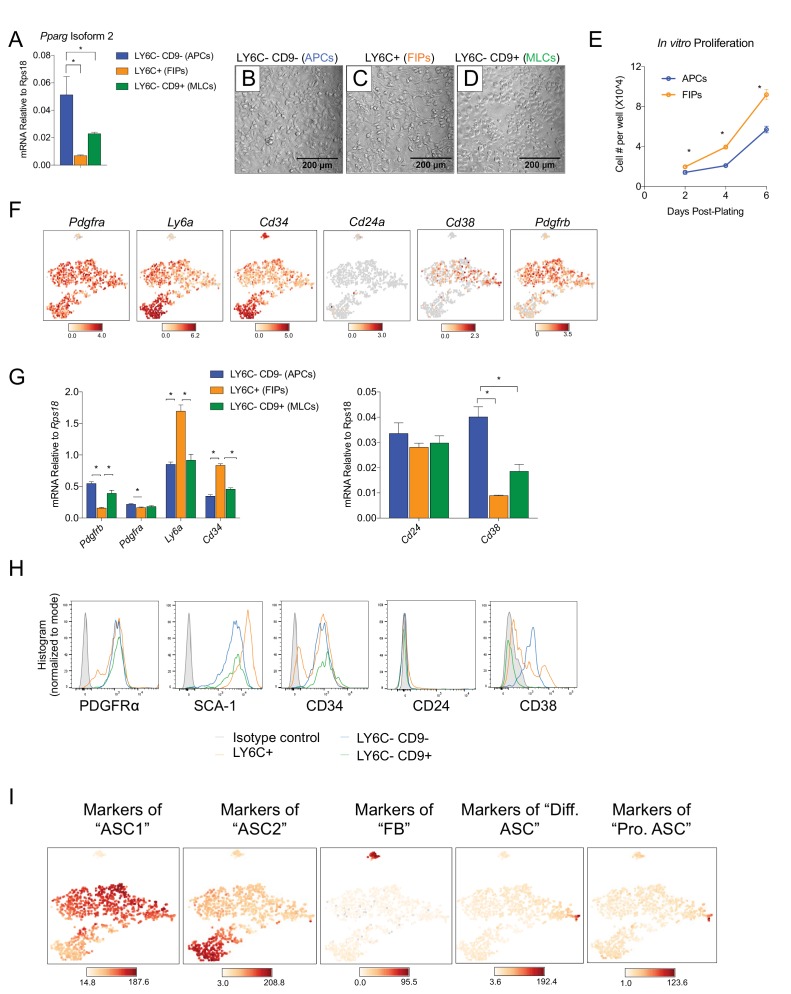
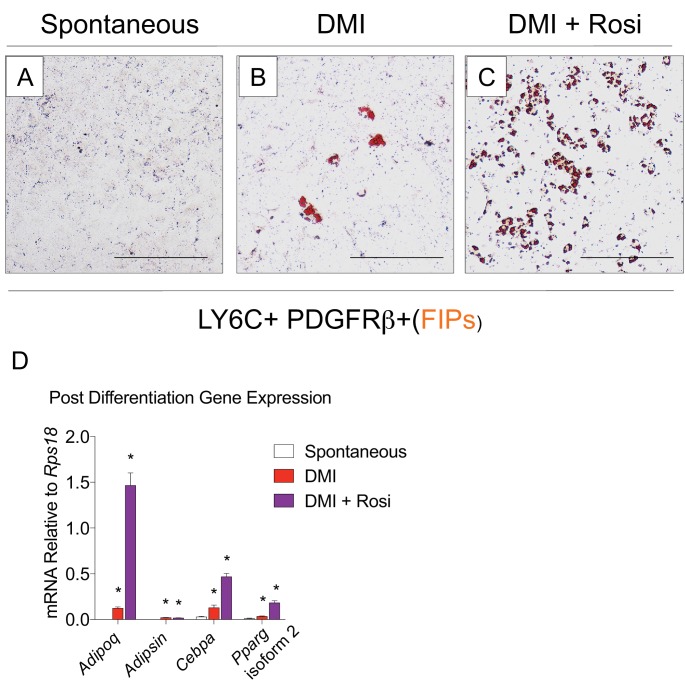
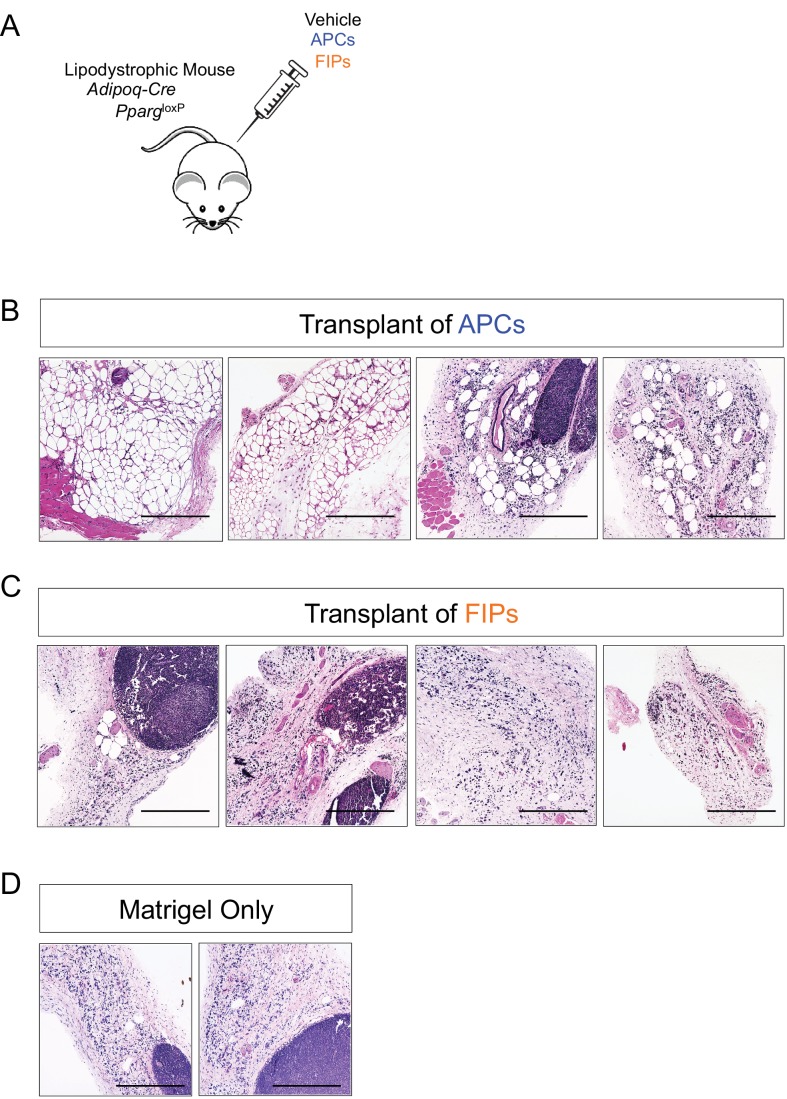
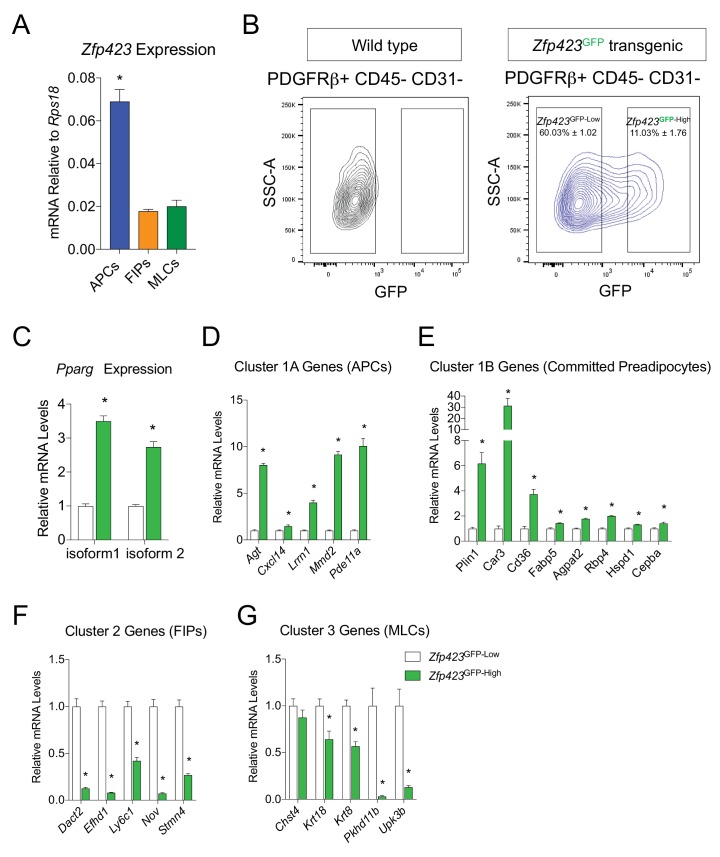
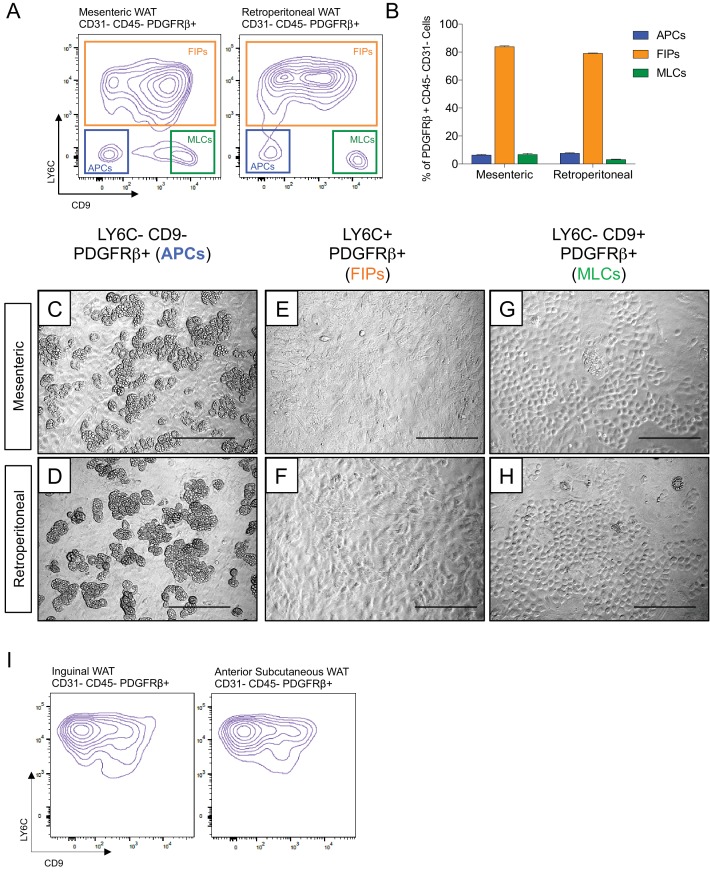
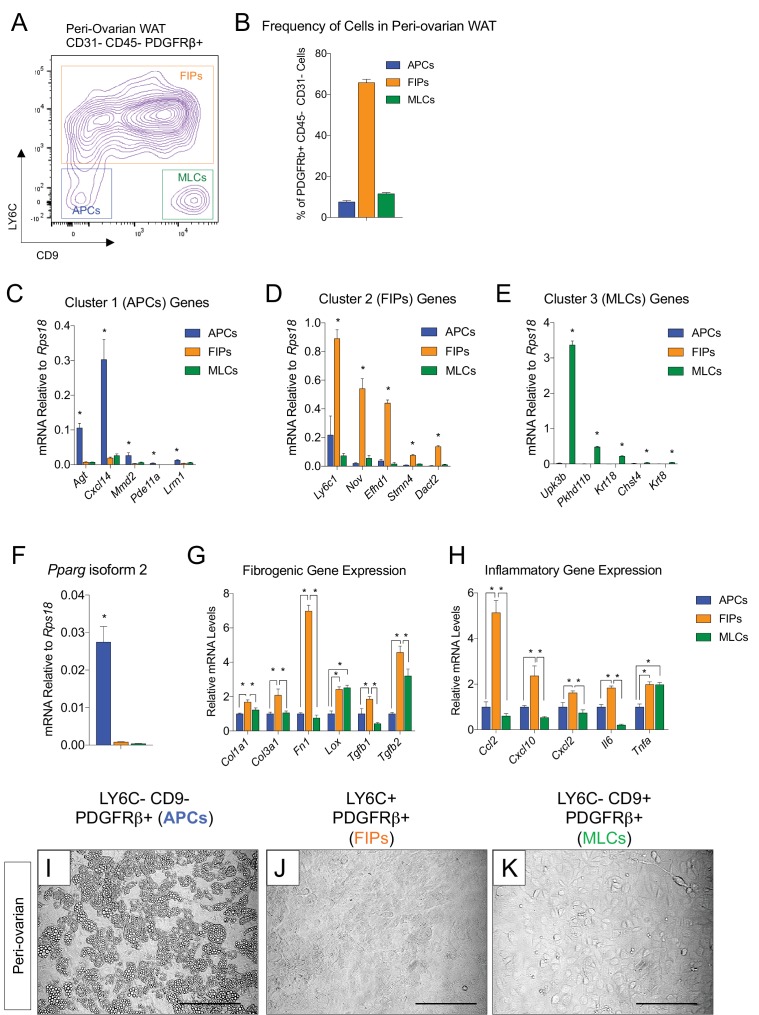
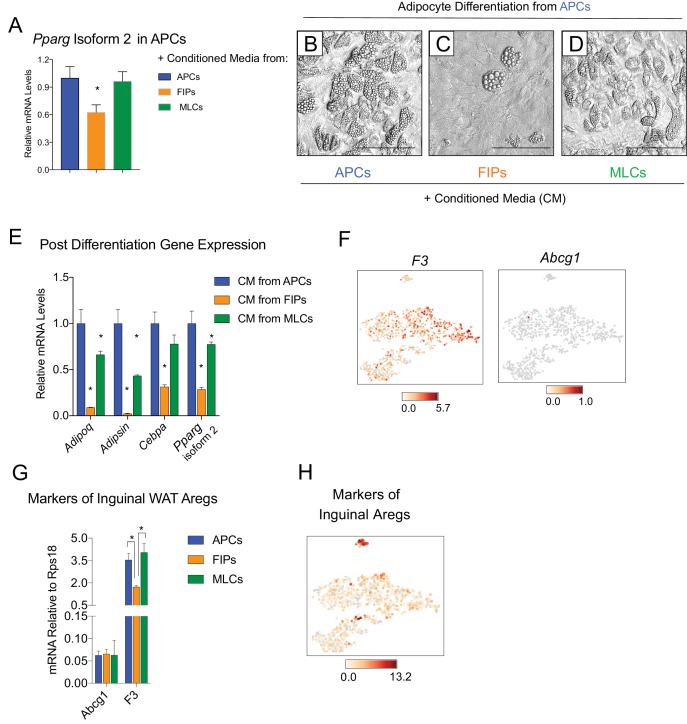
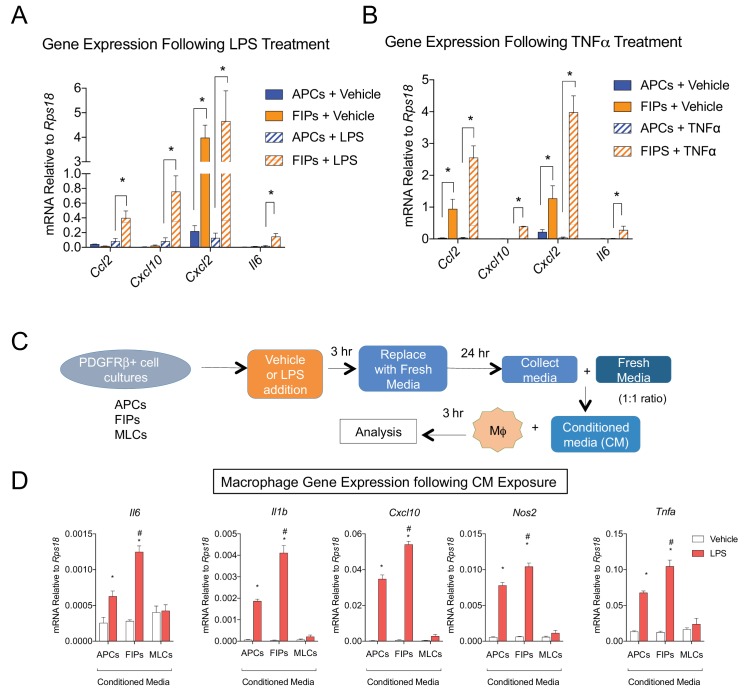
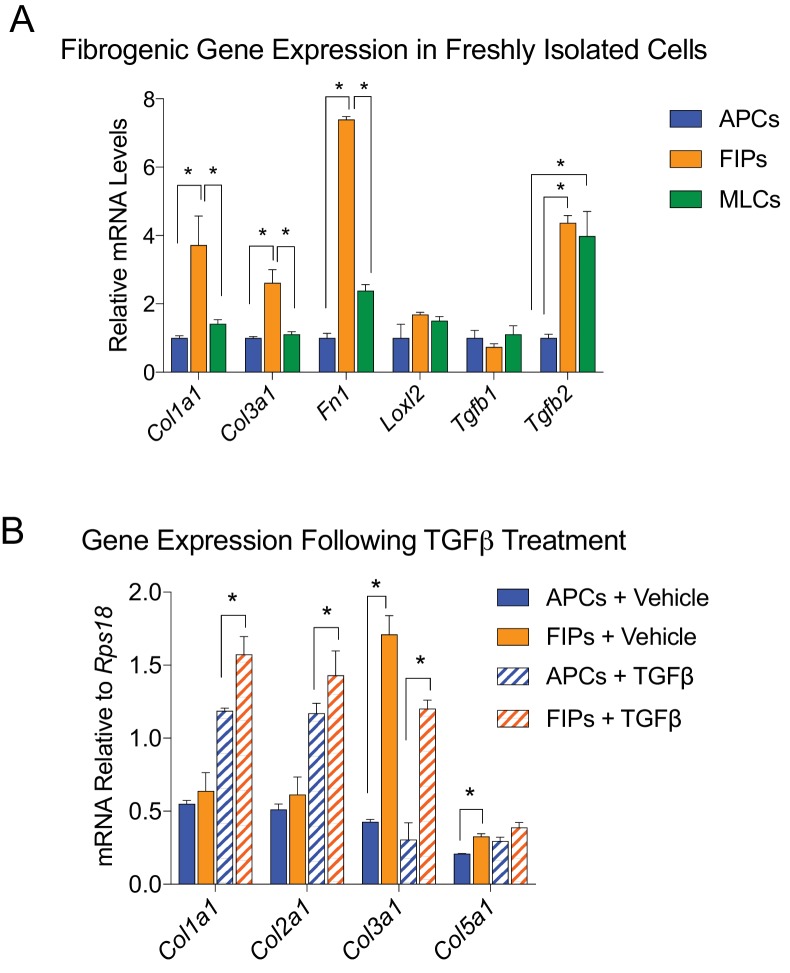
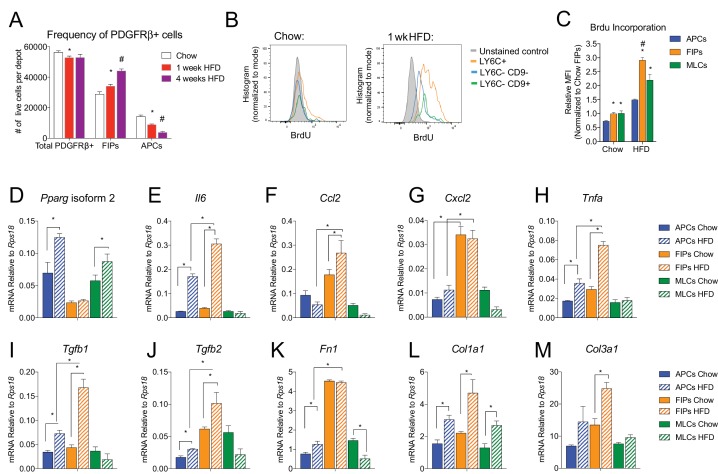
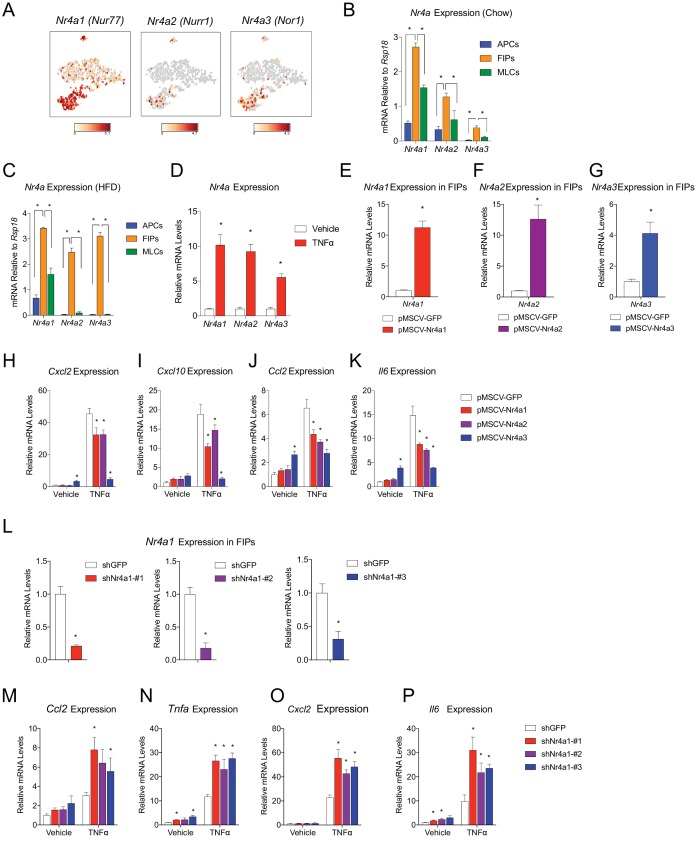
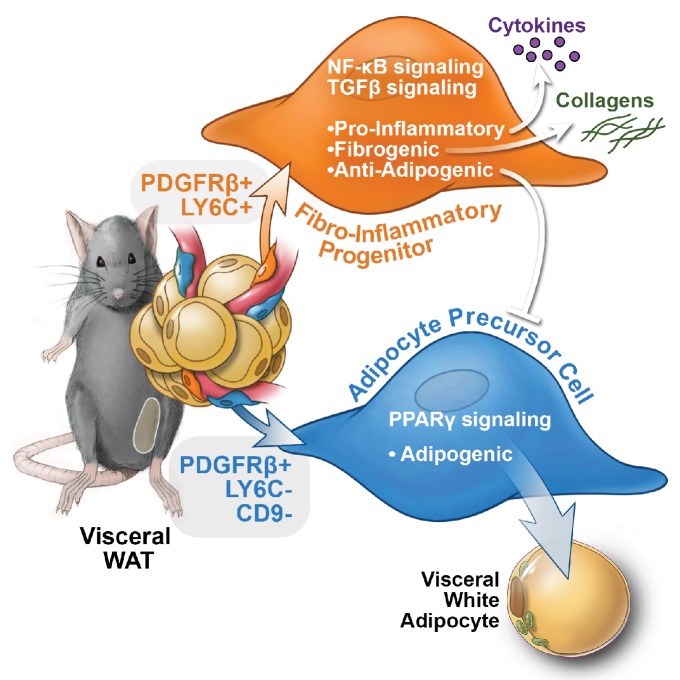
White adipose tissue (WAT) remodeling is dictated by coordinated interactions between adipocytes and resident stromal-vascular cells; however, the functional heterogeneity of adipose stromal cells has remained unresolved. We combined single-cell RNA-sequencing and FACS to identify and isolate functionally distinct subpopulations of PDGFRβ+ stromal cells within visceral WAT of adult mice. LY6C- CD9- PDGFRβ+ cells represent highly adipogenic visceral adipocyte precursor cells ('APCs'), whereas LY6C+ PDGFRβ+ cells represent fibro-inflammatory progenitors ('FIPs'). FIPs lack adipogenic capacity, display pro-fibrogenic/pro-inflammatory phenotypes, and can exert an anti-adipogenic effect on APCs. The pro-inflammatory phenotype of PDGFRβ+ cells is regulated, at least in part, by NR4A nuclear receptors. These data highlight the functional heterogeneity of visceral WAT perivascular cells, and provide insight into potential cell-cell interactions impacting adipogenesis and inflammation. These improved strategies to isolate FIPs and APCs from visceral WAT will facilitate the study of physiological WAT remodeling and mechanisms leading to metabolic dysfunction.

Editorial note: This article has been through an editorial process in which the authors decide how to respond to the issues raised during peer review. The Reviewing Editor's assessment is that all the issues have been addressed.

Keywords: adipogenesis; adipose tissue; fibrosis; human biology; inflammation; medicine; mouse; mural cells; obesity.


Conflict of interest statement

CH, BS, QZ, GH, MS, LV, AG, AM, DS, GH, RG No competing interests declared

Figures

Figure 1.
Figure 1.. Single-cell RNA sequencing reveals molecularly distinct Pdgfrb-expressing subpopulations in visceral adipose tissue.
(A) Schematic overview of the MuralChaser model: a ‘Tet-On’ system allowing for indelible labeling of Pdgfrb-expressing cells. In the absence of doxycycline (Dox), gonadal SVF cells are labeled membrane tdTomato+ and are devoid of membrane GFP expression. In the presence of Dox, rtTA activates Cre expression in Pdgfrb-expressing cells. Cre excises the loxP-flanked membrane tdTomato (mtdTomato) cassette and allows constitutive activation of membrane GFP (mGFP) reporter expression. The gating strategy shows prospective isolation of tdTomato- GFP+ cells from the stromal vascular fraction of gonadal WAT (gWAT). (B) t-distributed stochastic neighbor embedding (tSNE) plot of 1045 tdTomato- GFP+ cells isolated from pooled gWAT depots from five male MuralChaser mice. Equal numbers of cells were combined from five individual mice for single-cell RNA-sequencing. Clustering was generated using k-means = 4. See Figure 1—source data 1. (C) Distribution of Gfp and tdTomato expression within tSNE plot. Transcript counts represent Log2 of gene expression. (D) Heatmap of top 20 most differentially expressed genes defining the clusters indicated in (B). See Figure 1—source data 1. (E) Gene expression distribution of adipocyte/adipogenesis-associated genes. (F) Gene expression distribution of genes associated with terminal adipocyte differentiation. (G) Gene expression distribution of genes associated with fibrosis and inflammation. (H) Gene expression distribution of mesothelial cell markers.
Figure 1—figure supplement 1.
Figure 1—figure supplement 1.. GFP expression in gonadal WAT of MuralChaser mice.
(A) Representative FACS gating strategy for the isolation of mGFP+ cells from gonadal WAT of MuralChaser mice and representative plots indicating the expression of PDGFRβ expression in these cells. mGFP+ cells from MuralChaser mice are devoid of CD31, CD45, and CD11b expression. (B) 63x confocal image of sectioned gonadal WAT obtained from doxycycline-treated MuralChaser mice. Paraffin sections were stained with antibodies raised against GFP and PERILIPIN, and counterstained with DAPI. Note the presence of GFP+ cells along the vasculature. (C) Digital overlay of 20x brightfield and fluorescent images of sectioned gonadal WAT obtained from doxycycline-treated MuralChaser mice. Paraffin sections were stained with antibodies raised against GFP and counterstained with DAPI. Note the presence of GFP+ epithelial like cells (circled) along the outer later of the depot where the mesothelium resides. (D) Fluorescent images of live cultures of mesothelial cells isolated from gonadal WAT from doxycycline-treated male MuralChaser mice. mGFP expression is found in a small subset of the cobblestone mesothelial-like cells within the cultures. Scale bar = 200 μm.
Figure 1—figure supplement 2.
Figure 1—figure supplement 2.. tSNE plot of 4203 tdTomato- GFP+ cells isolated from gonadal WAT of MuralChaser mice.
(A) tSNE plot of 4203 tdTomato- GFP+ cells obtained from gonadal WAT of MuralChaser mice. (Median UMI count of 1873 per cell, mean reads per cell of 13,268, and median genes per cell of 908). (B) Distribution of Gfp, tdTomato, Ly6c1, and Cd9 expression within the identified clusters. (C) Heatmap of top 20 most differentially expressed genes defining the clusters indicated in (A).
Figure 2.
Figure 2.. Isolation of gonadal WAT PDGFRβ+ subpopulations by FACS.
(A) tSNE plot of cells from Figure 1B with k-means = 3 clustering. See Figure 2—source data 1. (B) Distribution of Ly6c1 and Cd9 expression within tSNE plot. Transcript counts represent Log2 of gene expression. (C) Fluorescence-activated cell sorting (FACS) gating strategy to isolate indicated PDGFRβ+ CD31 CD45- subpopulations from gWAT. (D) Frequency of APCs, FIPs, and MLCs in gonadal WAT isolated from lean male 8 week old C57BL/6 mice. Frequencies were quantified based on the gating strategy shown in (C). n = 6. (E) Heatmap of top 20 most differentially expressed genes that define the clusters depicted in (A). See Figure 2—source data 1. (F) mRNA levels of Cluster 1 genes in freshly isolated APCs (LY6C- CD9-), FIPs (LY6C+), and MLCs (LY6C- CD9-), obtained from gWAT of lean male 8 week old C57BL/6 mice. n = 4. (G) mRNA levels of Cluster 2 genes in same sorted populations shown in (F). n = 4. (H) mRNA levels of Cluster 3 genes in same sorted populations shown in (F). n = 4. * in all graphs denote p<0.05 by student’s t-test in comparisons to the other populations. Bars represent mean +SEM.
Figure 3.
Figure 3.. LY6C- CD9- PDGFRβ+ cells (APCs) are functional gonadal white adipocyte precursors.
(A) Photograph of Oil Red O (ORO) stained gWAT-derived PDGFRβ+ cells maintained for 8 days in growth media (2% FBS and ITS supplement). (B) Photograph of ORO stained LY6C- CD9- PDGFRβ+ cells maintained for 8 days in growth media. (C) Photograph of ORO stained LY6C+ PDGFRβ+ cells maintained for 8 days in growth media. (D) Photograph of ORO stained LY6C- CD9+ PDGFRβ+ cells maintained for 8 days in growth media. (E) Brightfield image of the culture shown in A. Scale bar = 400 μm. (F) Brightfield image of the culture shown in B. Scale bar = 400 μm. (G) Brightfield image of the culture shown in C. Scale bar = 400 μm. (H) Brightfield image of the culture shown in D. Scale bar = 400 μm. (I) Brightfield image of the culture shown in A. Scale bar = 200 μm. (J) Brightfield image of the culture shown in B. Scale bar = 200 μm. (K) Brightfield image of the culture shown in C. Scale bar = 200 μm. (L) Brightfield image of the culture shown in D. Scale bar = 200 μm. (M) Brightfield image of unstained PDGFRβ+ cells maintained for 8 days in growth media. Scale bar = 100 μm. (N) Brightfield image of unstained LY6C- CD9- PDGFRβ+ cells maintained for 8 days in growth media. Scale bar = 100 μm. (O) Brightfield image of unstained LY6C+ PDGFRβ+ cells maintained for 8 days in growth media. Scale bar = 100 μm. (P) Brightfield image of unstained LY6C- CD9+ PDGFRβ+ cells maintained for 8 days in growth media. Scale bar = 100 μm. (Q) mRNA levels of adipocyte-selective genes in total PDGFRβ+ cells, APCs, FIPs, and MLCs, after 8 days of culture in growth media. * denotes p<0.05 by student’s t-test in comparisons to total PDGFRβ+ cells. Bars represent mean +SEM. n = 4–7. All photographs/images are representative of multiple experiments/repetitions (See Supplementary file 1).
Figure 3—figure supplement 1.
Figure 3—figure supplement 1.. Expression of common adipocyte stem cell markers in APCs, FIPs, and MLCs, isolated from gonadal WAT of adult male mice.
(A) Pparg isoform two expression in freshly isolated APCs, FIPs, and MLCs from gWAT of 8 week old male mice. n = 4. (B) Representative brightfield image of APCs after 3 days of culture in growth media containing 2% FBS and ITS supplement. (C) Representative brightfield image of FIPs after 3 days of culture in growth media containing 2% FBS and ITS supplement. (D) Representative brightfield image of MLCs after 3 days of culture in growth media containing 2% FBS and ITS supplement. Note cobblestone morphology of mesothelial-like cells. (E) Numbers of cells/well of APCs and FIPs at 2, 4, and 6 days post-plating. n = 5. * denotes p<0.05 by student’s t-test. Bars represent mean +SEM. (F) Distribution of Pdgfra, Ly6a, Cd34, Cd24a, Cd38, and Pdgfrb expression within tSNE plot. (G) qPCR measurements of Pdgfra, Ly6a, Cd34, Cd24, Cd38, and Pdgfrb mRNA levels in APCs, FIPs, and MLCs, isolated from gonadal WAT of 8-week-old male mice. n = 4. * denotes p<0.05 by student’s t-test. Bars represent mean +SEM. (H) Representative histograms from flow cytometry analyses of PDGFRα, SCA-1, CD34, CD24, and CD38, expression in APCs, FIPs, and MLCs, isolated from gonadal WAT of 8-week-old male mice. (I) tSNE-plots highlighting the potential relationship between APCs, FIPs, and MLCs, and the SVF subpopulations identified by Burl et al. (2018). Lists of the top-50 most-enriched genes, each characterizing ASC1, ASC2, FB, Diff. ASC, and Pro. ASC, respectively, (from Burl et al.) were input into Cell Loupe Browser. Color intensities represent the sum of the Log2 expression values of the population gene lists within the single cell RNA-sequencing dataset of gWAT from Figure 1B. ASC1, adipocyte stem cells 1; ASC2, adipocyte stem cells 2; FB, fibroblasts; Diff. ASC, differentiating adipocyte stem cells; Pro. ASC, proliferating adipocyte stem cells.
Figure 3—figure supplement 2.
Figure 3—figure supplement 2.. FIPs undergo adipocyte differentiation in the presence of dexamethasone, IBMX, insulin, and rosiglitazone.
(A) Representative brightfield image of FIPs maintained at confluence for 8 days in growth media containing 2% FBS and ITS supplement. Scale bar = 200 µm fro A-C. (B) Representative brightfield image of FIPs 8 days after inducing adipocyte differentiation with dexamethasone, IMBX, and insulin (DMI). (C) Representative brightfield image of FIPs 8 days after inducing adipocyte differentiation with dexamethasone, IMBX, insulin, and rosiglitazone (Rosi). (D) mRNA levels of adipocyte-selective genes in cultures represented in A-C. * denotes p<0.05 by student’s t-test in comparisons to FIPs allowed to undergo spontaneous differentiation. Bars represent mean +SEM. n = 3.
Figure 3—figure supplement 3.
Figure 3—figure supplement 3.. Visceral APCs undergo adipocyte differentiation upon transplantation into lipodystrophic mice.
(A) Schematic of transplantation of APCs and FIPs for in vivo adipogenesis assay. 80,000 APCs or FIPs were injected subcutaneously into the remnant inguinal WAT depot of lipodystrophic mice (Adipoq-Cre, PpargloxP/loxP). Three weeks after transplant, the remnant inguinal WAT depots were harvested for histological analysis. (B) Brightfield image of the inguinal WAT depot from Adipoq-Cre, PpargloxP/loxP mice 3 days after transplant of 80,000 APCs. Scale bar = 400 μm. (C) Brightfield image of the inguinal WAT depot from Adipoq-Cre, PpargloxP/loxP mice 3 days after transplant of 80,000 FIPs. Scale bar = 400 μm. (D) Brightfield image of the inguinal WAT depot from Adipoq-Cre, PpargloxP/loxP mice 3 days after transplant of vehicle (Matrigel only). Scale bar = 400 μm.
Figure 3—figure supplement 4.
Figure 3—figure supplement 4.. Gonadal PDGFRβ+ Zfp423GFP-High cells enrich for markers of committed preadipocytes.
(A) mRNA levels of endogenous Zfp423 in APCs, FIPs, and MLCs, isolated from gonadal WAT of 8-week-old male Zfp423GFP mice. (B) Representative FACS gating strategy for the isolation of Zfp423GFP-Low and Zfp423GFP-High PDGFRβ+CD31 CD45- cells from gonadal WAT. (C) Pparg expression in Zfp423GFP-Low and Zfp423GFP-High cells isolated from gonadal WAT. (D) mRNA levels of Cluster 1A genes (APCs) in Zfp423GFP-Low and Zfp423GFP-High cells. (E) mRNA levels of Cluster 1B genes (Committed Preadipocytes) in Zfp423GFP-Low and Zfp423GFP-High cells. (F) mRNA levels of Cluster 2 genes (FIPs) in Zfp423GFP-Low and Zfp423GFP-High cells. (G) mRNA levels of Cluster 3 genes (MLCs) in Zfp423GFP-Low and Zfp423GFP-High cells. * in all graphs denote p<0.05 by student’s t-test. All bars represent mean +SEM. n = 4.
Figure 4.
Figure 4.. Functionally distinct stromal populations from visceral, but not subcutaneous, WAT depots can be revealed on the basis of LY6C and CD9 expression.
(A) Fluorescence-activated cell sorting (FACS) gating strategy to isolate indicated PDGFRβ+ CD31- CD45- subpopulations from mesenteric and retroperitoneal WAT. (B) Frequency of APCs, FIPs, and MLCs in mesenteric and retroperitoneal WAT isolated from lean male 8 week old C57BL/6 mice. Frequencies were quantified based on the gating strategy shown in (A). n = 6. Bars represent mean +SEM. (C) Brightfield image of LY6C- CD9- PDGFRβ+ (APCs) cells from mesenteric WAT maintained for 8 days in growth media. Scale bar = 200 μm. (D) Brightfield image of LY6C+ PDGFRβ+ (FIPs) cells from mesenteric WAT maintained for 8 days in growth media. Scale bar = 200 μm. (E) Brightfield image of LY6C- CD9+ PDGFRβ+ (MLCs) cells from mesenteric WAT maintained for 8 days in growth media. Scale bar = 200 μm. (F) Brightfield image of LY6C- CD9- PDGFRβ+ (APCs) cells from retroperitoneal WAT maintained for 8 days in growth media. Scale bar = 200 μm. (G) Brightfield image of LY6C+ PDGFRβ+ (FIPs) cells from retroperitoneal WAT maintained for 8 days in growth media. Scale bar = 200 μm. (H) Brightfield image of LY6C- CD9+ PDGFRβ+ (MLCs) cells from retroperitoneal WAT maintained for 8 days in growth media. Scale bar = 200 μm. (I) Flow cytometry plot of LY6C and CD9 expression in CD31- CD45- PDGFRβ+ cells isolated from inguinal WAT and anterior subcutaneous WAT.
Figure 4—figure supplement 1.
Figure 4—figure supplement 1.. APCs and FIPs can be isolated from gonadal WAT of female mice.
(A) Fluorescence-activated cell sorting (FACS) gating strategy to isolate indicated PDGFRβ+ CD31- CD45- subpopulations from peri-ovarian WAT. (B) Frequency of APCs, FIPs, and MLCs in peri-ovarian WAT isolated from lean female 8 week old C57BL/6 mice. Frequencies were quantified based on the gating strategy shown in (A). n = 6. Bars represent mean +SEM. (C) mRNA levels of Cluster 1 genes identified in Figure 2 in freshly isolated APCs (LY6C- CD9-), FIPs (LY6C+), and MLCs (LY6C- CD9-), obtained from peri-ovarian WAT of lean female 8 week old C57BL/6 mice. n = 4. * denotes p<0.05 by student’s t-test in comparisons to the other populations. Bars represent mean +SEM. (D) mRNA levels of Cluster 2 genes in same sorted populations shown in (C). n = 4. * denotes p<0.05 by student’s t-test in comparisons to the other populations. Bars represent mean +SEM. (E) mRNA levels of Cluster 3 genes in same sorted populations shown in (C). n = 4. * denotes p<0.05 by student’s t-test in comparisons to the other populations. Bars represent mean +SEM. (F) Pparg isoform two expression in freshly isolated APCs, FIPs, and MLCs from peri-ovarian WAT of 8 week old female mice. n = 4. * denotes p<0.05 by student’s t-test in comparisons to the other populations. Bars represent mean +SEM. (G) mRNA levels of indicated collagens and fibrosis-related genes in APCs, FIPs, and MLCs isolated from peri-ovarian WAT of 8-week-old female mice. n = 4. * denotes p<0.05 by student’s t-test. Bars represent mean +SEM. (H) mRNA levels of indicated inflammatory genes in APCs, FIPs, and MLCs isolated from peri-ovarian WAT of 8-week-old female mice. n = 4. * denotes p<0.05 by student’s t-test. Bars represent mean +SEM. (I) Brightfield image of LY6C- CD9- PDGFRβ+ (APCs) cells from peri-ovarian WAT maintained for 8 days in growth media. Scale bar = 200 μm. (J) Brightfield image of LY6C+ PDGFRβ+ (FIPs) cells from peri-ovarian WAT maintained for 8 days in growth media. Scale bar = 200 μm. (K) Brightfield image of LY6C- CD9+ PDGFRβ+ (MLCs) cells from peri-ovarian WAT maintained for 8 days in growth media. Scale bar = 200 μm.
Figure 5.
Figure 5.. FIPs inhibit adipocyte differentiation from APCs.
(A) Pparg isoform two expression in cultured APCs maintained for 3 days in conditioned media from either APCs, FIPs, or MLCs. n = 4. *denotes p<0.05 by student’s t-test in comparisons to data represented in blue bars. Bars represent mean +SEM. (B) Brightfield image of APCs after 8 days of culture in conditioned media from parallel cultures of APCs. Scale bar = 100 μm for B-D. (C) Brightfield image of APCs after 8 days of culture in conditioned media from parallel cultures of FIPs. (D) Brightfield image of APCs after 8 days of culture in conditioned media from parallel cultures of MLCs. (E) mRNA levels of adipocyte-selective genes within cultures shown in (B–D). n = 3. * denotes p<0.05 by student’s t-test in comparisons to data represented in blue bars. Bars represent mean +SEM. (F) Distribution of Abcg1 and F3 expression within tSNE plot from Figure 1B. (G) mRNA levels of Abcg1 and F3 in APCs, FIPs, and MLCs isolated from lean 8 week old male mice. * denotes p<0.05 by student’s t-test. Bars represent mean +SEM. (H) tSNE-plot highlighting the potential relationship between APCs, FIPs, and MLCs, and iguinal WAT Aregs identified by Schwalie et al. (Schwalie et al., 2018). The top-23 Areg-selective genes identified by Schwalie et al were input into Cell Loupe Browser. Color intensities represent the sum of the Log2 expression values of the Areg selective gene list within the single cell RNA-sequencing dataset of gWAT from Figure 1B.
Figure 6.
Figure 6.. LY6C+ PDGFRβ+ cells (FIPs) exhibit a functional pro-inflammatory phenotype.
(A) mRNA levels of indicated cytokines in cultures of APCs and FIPs treated with vehicle (PBS) or LPS (100 ng/ml) for 3 hr. * denotes p<0.05 by student’s t-test. Bars represent mean +SEM. n = 4. (B) mRNA levels of indicated cytokines in cultures of APCs and FIPs treated with vehicle (PBS) or TNFα (20 ng/ml) for 3 hr. * denotes p<0.05 by student’s t-test. Bars represent mean +SEM. n = 4. (C) Schematic depicting the treatment of bone marrow derived macrophages (MΦ) with conditioned media (CM) from LPS-treated APCs, FIPs and MLCs. (D) mRNA levels of select markers of activated macrophages in macrophage cultures exposed to conditioned media. n = 4. * denotes p<0.05 comparing vehicle vs. LPS. # denotes p<0.05 comparing LPS-treated FIPs vs. LPS-treated APCs. Bars represent mean +SEM.
Figure 6—figure supplement 1.
Figure 6—figure supplement 1.. LY6C+ PDGFRβ+ cells (FIPs) exhibit a fibrogenic phenotype.
(A) mRNA levels of indicated collagens and fibrosis-related genes in APCs, FIPs, and MLCs, isolated from gonadal WAT of 8-week-old male mice. (B) mRNA levels of indicated collagens in cultured APCs and FIPs treated with vehicle (PBS) or TGFβ (1 ng/ml) for 3 days. * in all graphs denote p<0.05 by student’s t-test. All bars represent mean +SEM. n = 4.
Figure 7.
Figure 7.. The frequencies and gene expression profiles of APCs and FIPs are differentially regulated in association with high-fat diet feeding.
(A) Frequency of total PDGFRβ+ cells, FIPs, and APCs in gonadal WAT isolated from chow-fed mice, mice fed high fat diet (HFD) for 1 week, or mice fed HFD for 4 weeks. n = 4. * denotes p<0.05 by student’s t-test in comparison to white bars. # denotes p<0.05 by student’s t-test in comparison to red or white bars. Bars represent mean +SEM. (B) Histograms depicting BrdU incorporation into APCs, FIPs, and MLCs after 1 week of chow or HFD feeding. (C) Relative median fluorescence intensity (MFI) corresponding to histograms shown in (B). n = 4. * denotes p<0.05 by student’s t-test in comparison to corresponding data from APCs. # denotes p<0.05 by student’s t-test in comparison to corresponding data from APCs and MLCs. (D) Pparg isoform two expression in freshly isolated APCs, FIPs, and MLCs, from gWAT of chow or 4 week HFD fed mice. n = 4. (E) Il6 expression in same cell populations shown in (D). (F) Ccl2 expression in same cell populations shown in (D). (G) Cxcl2 expression in same cell populations shown in (D). (H) Tnfa expression in same cell populations shown in (D). (I) Tgfb1 expression in same cell populations shown in (D). (J) Tgfb2 expression in same cell populations shown in (D). (K) Fn1 expression in same cell populations shown in (D). (L) Col1a1 expression in same cell populations shown in (D). (M) Col3a1 expression in same cell populations shown in (D). * in panels D-M denote p<0.05 by student’s t-test. All bars represent mean +SEM.
Figure 8.
Figure 8.. NR4A nuclear receptors regulate the pro-inflammatory phenotype of PDGFRβ+ cells.
(A) Distribution of Nr4a1, Nr4a2, and Nr4a3 expression, within tSNE plot depicted in Figure 1B. Transcript counts represent Log2 of gene expression. (B) Nr4a mRNA levels in freshly isolated APCs, FIPs, and MLCs, isolated from the gonadal WAT of lean chow-fed male mice. n = 4. (C) Nr4a mRNA levels in freshly isolated APCs, FIPs, and MLCs, isolated from the gonadal WAT of male mice following 4 weeks of high-fat diet (HFD) feeding. n = 4. (D) Relative mRNA levels of Nr4a family members in cultures of FIPs treated with vehicle (PBS) or TNFα (20 ng/ml) for 3 hr. n = 4. * denotes p<0.05 by student’s t-test. n = 4. (E) Relative mRNA levels of Nr4a1 in FIPs 3 days following transduction with retrovirus expressing either Gfp or Nr4a1. n = 4. (F) Relative mRNA levels of Nr4a2 in FIPs 3 days following transduction with retrovirus expressing either Gfp or Nr4a2. n = 4. (G) Relative mRNA levels of Nr4a3 in FIPs 3 days following transduction with retrovirus expressing either Gfp or Nr4a3. n = 4. (H) Cxcl2 expression in FIPs 3 days following transduction with indicated retroviruses and treated with vehicle (PBS) or TNFα (20 ng/ml) for 4 hr. n = 4. (I) Cxcl10 expression in same cultures shown in (H). (J) Ccl2 expression in same cultures shown in (H). (K) Il6 expression in same cultures shown in (H). (L) Relative mRNA levels of Nr4a1 in FIPs following transduction with retrovirus expressing shRNA targeting Gfp (shGFP) (control) or retroviruses individually expressing distinct shRNAs targeting unique regions of Nr4a1 mRNA (shNr4a1 #1–3). n = 4. (M) Ccl2 expression in FIPs following transduction with indicated retroviruses and treatment with vehicle (PBS) or TNFα (20 ng/ml) for 3 hr. n = 4. (N) Tnfa expression in same cultures shown in (C). (O) Cxcl2 expression in same cultures shown in (C). (P) Il6 expression in same cultures shown in (C). * in panels E-P denote p<0.05 by student’s t-test in comparison to corresponding treatments of control cells (pMSCV-GFP or shGFP). Bars in all graphs represent mean +SEM.
Figure 9.
Figure 9.. Functional heterogeneity of PDGFRβ+ perivascular cells in visceral adipose tissue of mice.
The pool of PDGFRβ+ cells in visceral WAT of mice is molecularly and functionally heterogeneous. LY6C- CD9- PDGFRβ+ cells represent visceral adipocyte precursor cells (APCs), whereas LY6C+ PDGFRβ+ cells represent fibro-inflammatory progenitors (FIPs). FIPs are fibrogenic, pro-inflammatory, and inhibit adipocyte differentiation from APCs.

Similar articles

Cited by

References

    1. Ambrosi TH, Scialdone A, Graja A, Gohlke S, Jank AM, Bocian C, Woelk L, Fan H, Logan DW, Schürmann A, Saraiva LR, Schulz TJ. Adipocyte accumulation in the bone marrow during obesity and aging impairs stem Cell-Based hematopoietic and bone regeneration. Cell Stem Cell. 2017;20:771–784. doi: 10.1016/j.stem.2017.02.009. - DOI - PMC - PubMed
    1. Armulik A, Genové G, Betsholtz C. Pericytes: developmental, physiological, and pathological perspectives, problems, and promises. Developmental Cell. 2011;21:193–215. doi: 10.1016/j.devcel.2011.07.001. - DOI - PubMed
    1. Berry R, Rodeheffer MS. Characterization of the adipocyte cellular lineage in vivo. Nature Cell Biology. 2013;15:302–308. doi: 10.1038/ncb2696. - DOI - PMC - PubMed
    1. Burl RB, Ramseyer VD, Rondini EA, Pique-Regi R, Lee YH, Granneman JG. Deconstructing adipogenesis induced by β3-Adrenergic receptor activation with Single-Cell expression profiling. Cell Metabolism. 2018;28:300–309. doi: 10.1016/j.cmet.2018.05.025. - DOI - PMC - PubMed
    1. Carrière A, Jeanson Y, Côté JA, Dromard C, Galinier A, Menzel S, Barreau C, Dupuis-Coronas S, Arnaud E, Girousse A, Cuminetti V, Paupert J, Cousin B, Sengenes C, Koch-Nolte F, Tchernof A, Casteilla L. Identification of the ectoenzyme CD38 as a marker of committed preadipocytes. International Journal of Obesity. 2017;41:1539–1546. doi: 10.1038/ijo.2017.140. - DOI - PubMed

Publication types

MeSH terms