. 2018 Oct 1;76(7):fty073.
doi: 10.1093/femspd/fty073.

Hyperencapsulated mucoid pneumococcal isolates from patients with cystic fibrosis have increased biofilm density and persistence in vivo

Affiliations

Hyperencapsulated mucoid pneumococcal isolates from patients with cystic fibrosis have increased biofilm density and persistence in vivo

Evida A Dennis et al. Pathog Dis. .

Abstract

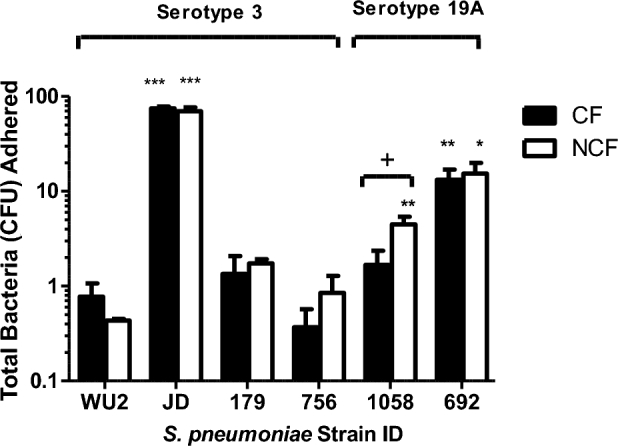
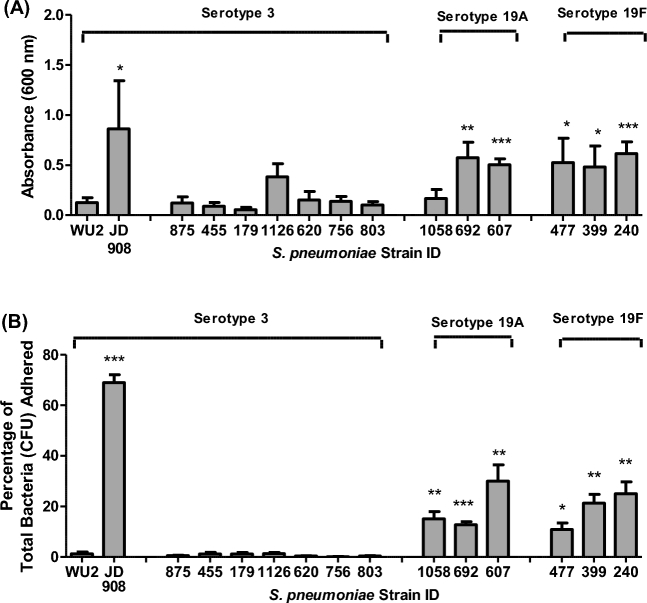
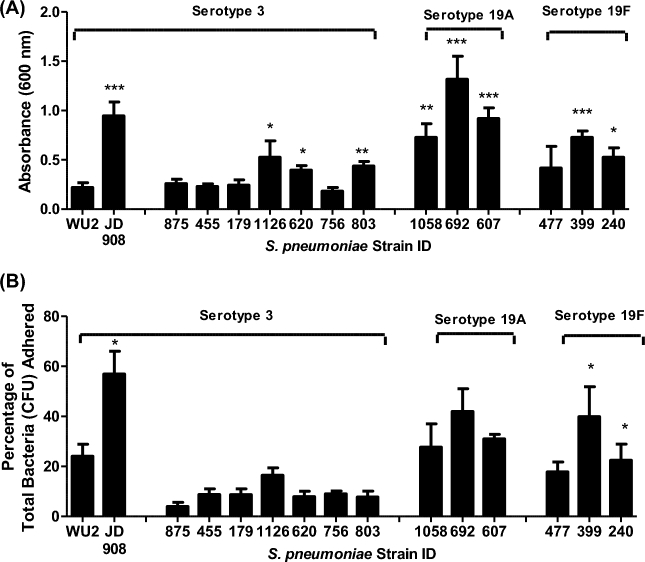
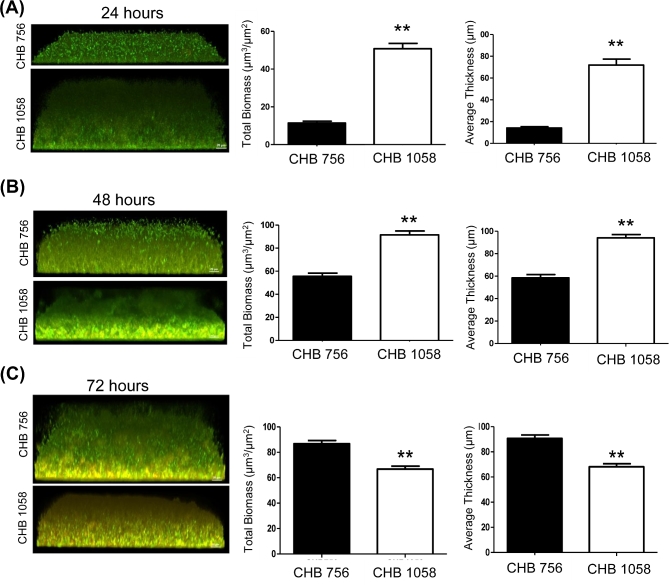
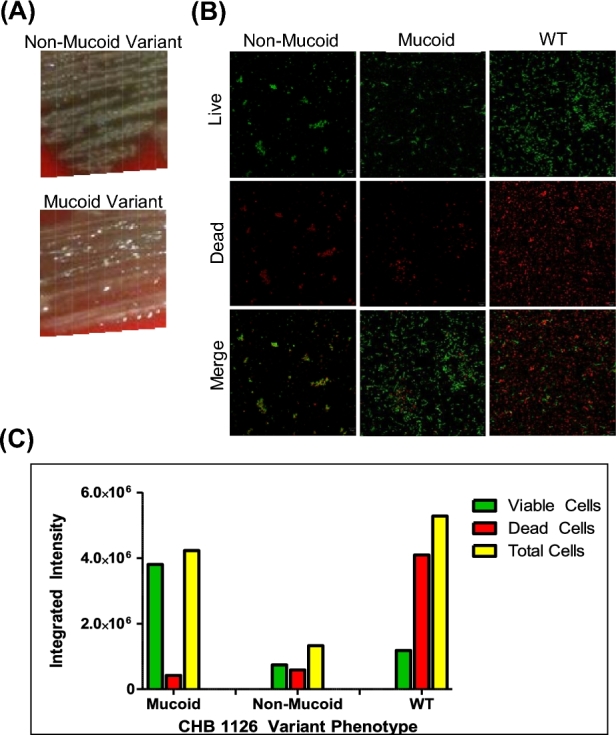
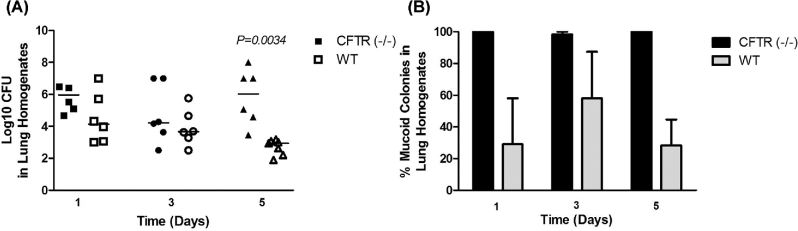
Mucoid bacteria, predominately Pseudomonas aeruginosa, are commonly associated with decline in pulmonary function in children with cystic fibrosis (CF), and are thought to persist at least in part due to a greater propensity toward forming biofilms. We isolated a higher frequency of mucoid Streptococcus pneumoniae (Sp) expressing high levels of capsular polysaccharides from sputa from children with CF, compared to those without CF. We compared biofilm formation and maturation by mucoid and non-mucoid isolates of Sp collected from children with and without CF. Non-mucoid Sp serotype 19A and 19F isolates had significantly higher levels of biofilm initiation and adherence to CF epithelial cells than did serotype 3 isolates. However, strains expressing high levels of capsule had significantly greater biofilm maturation, as evidenced by increased density and thickness in static and continuous flow assays via confocal microscopy. Finally, using a serotype 3 Sp strain, we showed that highly encapsulated mucoid phase variants predominate during late adherence and better colonize CFTR-/- as compared to wild-type mice in respiratory infection studies. These findings indicate that overexpression of capsule can enhance the development of mature pneumococcal biofilms in vitro, and may contribute to pneumococcal colonization in CF lung disease.


Figures

Figure 1.
Figure 1.
Adherence of S. pneumoniae to primary lung epithelial cells. Early attachment of individual mucoid and non-mucoid isolates of S. pneumoniae was measured to CF primary epithelial cells (black bars) and NCF primary epithelial cells (white bars) to assess initial bacterial adherence to biological surfaces. Percent bacteria attached to epithelial cells in 6-well plates were calculated in comparison to the total number of attached bacteria plus unattached bacteria that were recovered in media wash for each sample after 4 h incubations by dividing attached CFUs by total CFUs. All experiments were performed in duplicate and repeated independently at least once. Bars represent the group means + SEM of samples from all assays. Statistical analyses were performed using a two-tailed Student's t-test. Comparisons are either strain vs. WU2 (A single asterisk denotes P ≤ 0.05, double asterisks denotes P ≤ 0.01, triple asterisks denotes P ≤ 0.001) or adherence to CF vs. NCF cells. (A single plus sign denotes P ≤ 0.05).
Figure 2.
Figure 2.
Initial adherence of S. pneumoniae serotypes 3, 19A and 19F to polystyrene wells. Early attachment of serotype 3, 19A and 19F S. pneumoniae isolates to polystyrene wells was measured by (A) staining adhered cells with crystal violet to measure differences in biofilm biomass after 4 h incubations or by (B) quantifying the CFUs that remained attached to 24-well polystyrene plates and the CFUs that were recovered in THY wash after 4 h incubations and calculating the percentage adhered by dividing attached CFUs by total CFUs. Each sample used in both assays was tested in duplicate wells and all assays were repeated at least once. Bars represent the group means + SEM of samples from all assays. Statistical analysis was performed using a two-tailed Student's t-test. Comparisons are vs. WU2. (A single asterisk denotes P ≤ 0.05, double asterisks denote P ≤ 0.01 and triple asterisks denote P ≤ 0.001).
Figure 3.
Figure 3.
Adherence of S. pneumoniae serotypes 3, 19A and 19F to polystyrene wells. Late attachment of serotype 3 and serotypes 19A and 19F S. pneumoniae isolates was measured by (A) staining adhered cells with crystal violet to measure differences in biofilm biomass after 4 h incubations or by (B) quantifying the CFUs that remained attached to 24-well polystyrene plates and the CFUs that were recovered in THY wash after 4 h incubations. Percentage of total bacteria adhered was determined by dividing attached CFUs by total CFUs. Each sample used in both assays was tested in duplicate wells and all assays were repeated at least once. Bars represent the group means + SEM of samples from all assays. Statistical analysis was performed using a two-tailed Student's t-test. Comparisons are vs. WU2. (A single asterisk denotes P ≤ 0.05, double asterisks denote P ≤ 0.01 and triple asterisks denote P ≤ 0.001).
Figure 4.
Figure 4.
Mature biofilm formation of serotypes 3 and serotype 19A S. pneumoniae isolates. Mature biofilms of mucoid type 3 (CHB756) and non-mucoid type 19A (CHB1058) S. pneumoniae were evaluated by confocal microscopy using a continuous media flow biofilm chambers. Biofilm formation was evaluated at 24 h (A), 48 h (B) and 72 h (C) to compare biofilm viability and density. The green is staining is viable cells, the red is staining dead cells and yellow indicates co-localization of the two. Integrated Intensity of red and green fluorescent staining was measured by COMSTAT software.
Figure 5.
Figure 5.
Biofilm formation by serotype 3 S. pneumoniae isolate CHB1126. Confocal microscopy with BacLight staining was employed after 72 h to compare biofilm viability and robustness of mucoid, non-mucoid and WT/mixed variants of serotype 3 CHB 1126 Sp. Morphology of non-mucoid and mucoid variants of CHB 1126 on blood agar (A). The green is staining is viable cells, the red is staining dead cells and yellow indicates co-localization of the two (B). Integrated intensity of red and green fluorescent staining was measured by Metamorph software (C).
Figure 6.
Figure 6.
The effect of mucoidy on serotype 3 colonization and residence in CF mouse lungs. CFTR–/– mice (black dots) and WT-mice (white dots) were infected with 1 × 105 CFU of mucoid serotype 3 isolate CHB1126 (n = 6; A). The percentage of mucoid colonies and non-MCVs was calculated from lung homogenates (B). The horizontal lines indicate the median for each group. CFTR–/– mice and WT-mice were directly compared for each strain using the two-tailed T test. Experiments were repeated at least twice. P-values ≥ 0.05 are not shown.

References

    1. Adamou JE, Wizemann TM, Barren P et al. . Adherence of Streptococcuspneumoniae to human bronchial epithelial cells (BEAS-2B). Infect Immun 1998;66:820–2. - PMC - PubMed
    1. Allegrucci M, Sauer K. Characterization of colony morphology variants isolated from Streptococcus pneumoniae biofilms. J Bacteriol 2007;189:2030–8. - PMC - PubMed
    1. Allegrucci M, Hu FZ, Shen K et al. . Phenotypic characterization of Streptococcuspneumoniae biofilm development. J Bacteriol 2006;188:2325–35. - PMC - PubMed
    1. Briles DE, Novak L, Hotomi M et al. . Nasal colonization with Streptococcuspneumoniae includes subpopulations of surface and invasive pneumococci. Infect Immun 2005;73:6945–51. - PMC - PubMed
    1. Briles DE, Nahm M, Schroer K et al. . Antiphosphocholine antibodies found in normal mouse serum are protective against intravenous infection with type 3 Streptococcuspneumoniae. J Exp Med 1981;153:694–705. - PMC - PubMed

Publication types

Substances

LinkOut - more resources