

Sleep deprivation enhances inter-stimulus interval effect on vigilant attention performance
- PMID: 30265364
- PMCID: PMC6289239
- DOI: 10.1093/sleep/zsy189
Sleep deprivation enhances inter-stimulus interval effect on vigilant attention performance
Abstract
Study objective: Sleep deprivation significantly reduces the ability to maintain a consistent alertness level and impairs vigilant attention. Previous studies have shown that longer inter-stimulus interval (ISI) are associated with faster reaction times (RTs) on the Psychomotor Vigilance Test (PVT). However, whether and how sleep deprivation interacts with this ISI effect remains unclear.
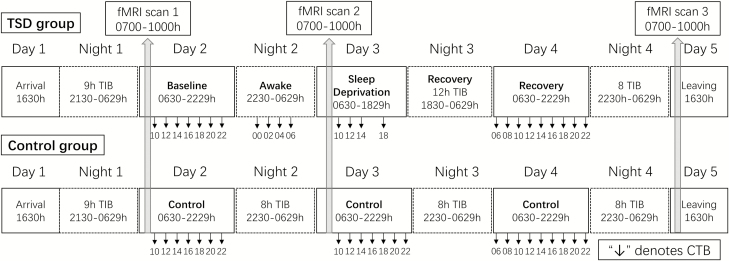
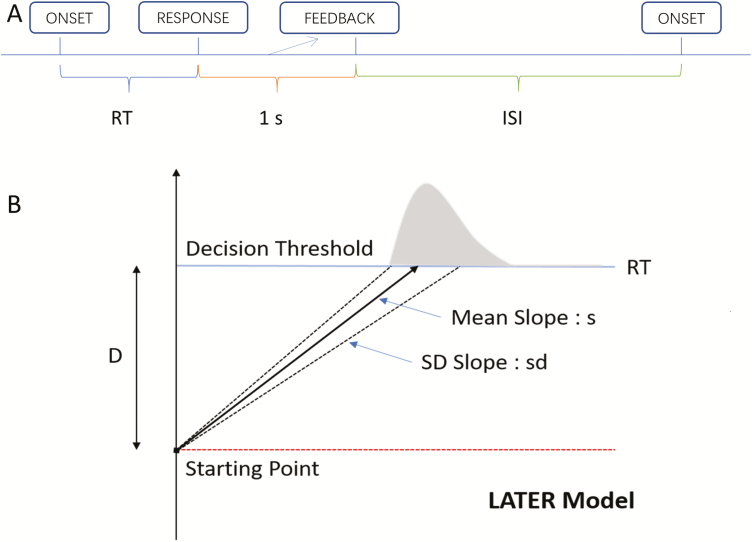
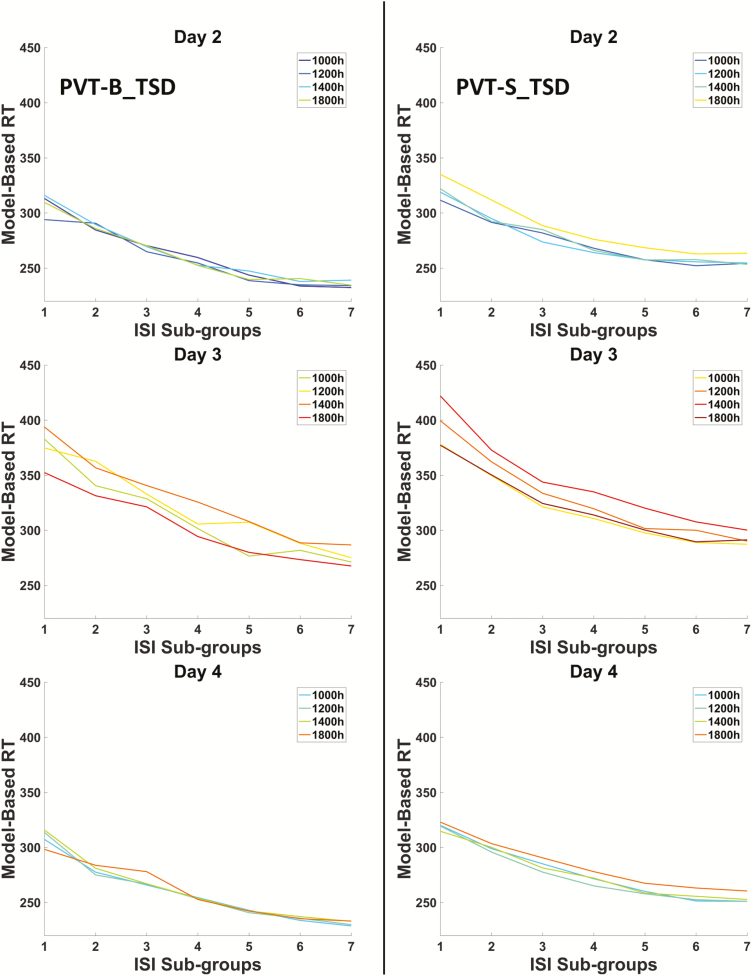
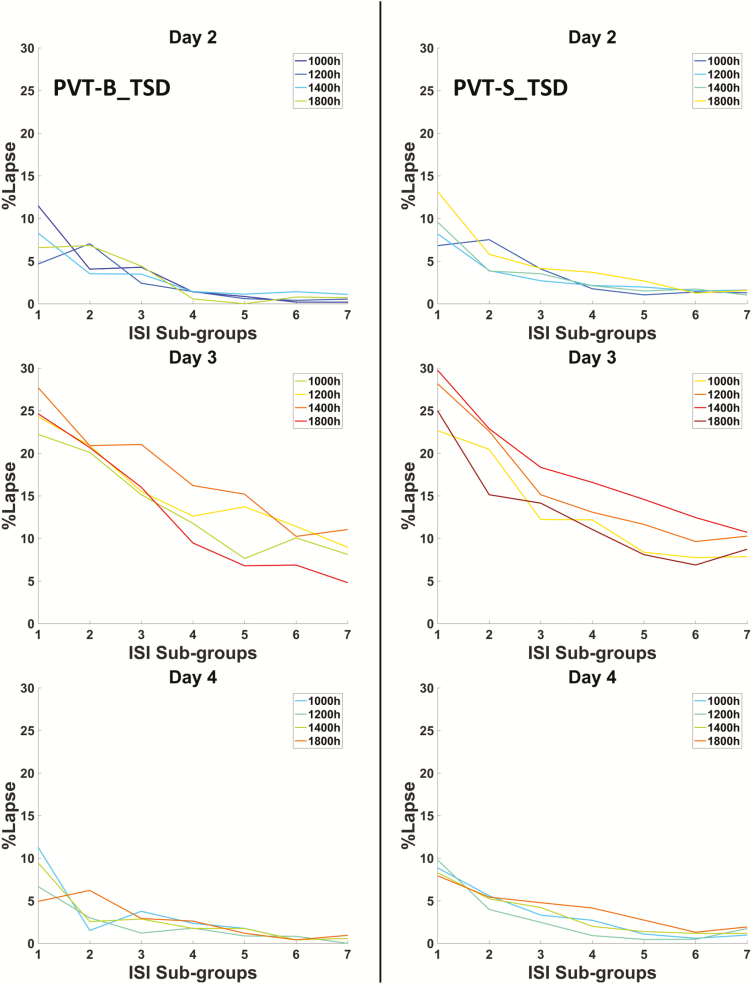
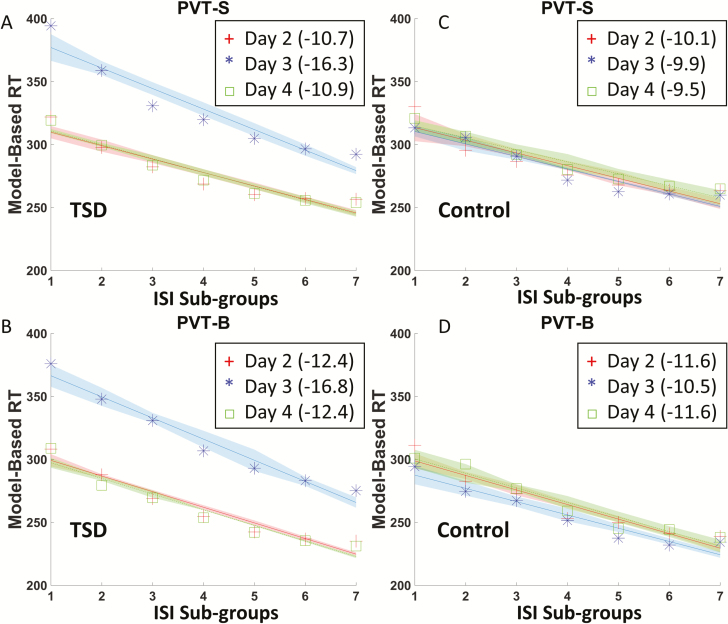
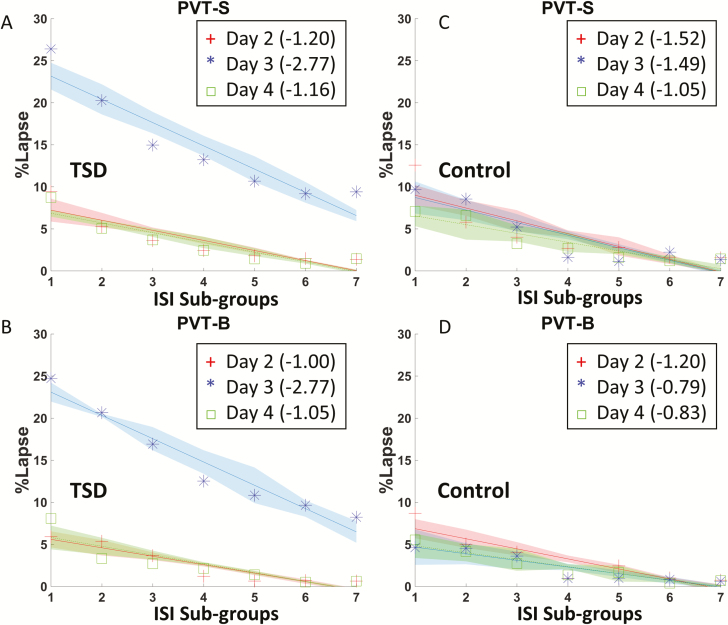
Methods: N = 70 healthy adults (age range 20-50 years, 41 males) participated in a 5-day and 4-night in-laboratory controlled sleep deprivation study, including N = 54 in the experimental group with one night of total sleep deprivation and N = 16 in the control group without sleep loss. All participants completed a neurobehavioral test battery every 2 hours while awake, including a 10-minute standard PVT (PVT-S, N = 1626) and a 3-minute brief PVT (PVT-B, N = 1622). The linear approach to threshold with ergodic rate (LATER) model was used to fit the RT data.
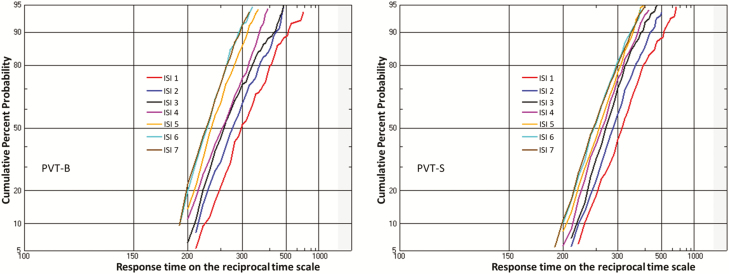
Results: RT decreased significantly with longer ISI on the PVT-S and PVT-B. Increased ISI effect was found for both PVT-S and PVT-B during sleep deprivation compared to baseline or recovery sleep in the experimental group, whereas no differences in the ISI effect were found in the control group. The LATER model fitting indicated that changes in perceptual sensitivity rather than threshold adjustment may underlie the ISI effect.
Conclusions: Both standard and brief PVT showed a similar ISI effect on vigilant attention performance. Sleep deprivation increased the ISI effect on both PVT-S and PVT-B, which may be due to impaired temporal resolution and time estimation after sleep loss.
Figures


Similar articles
-
An adaptive-duration version of the PVT accurately tracks changes in psychomotor vigilance induced by sleep restriction.Sleep. 2012 Feb 1;35(2):193-202. doi: 10.5665/sleep.1620. Sleep. 2012. PMID: 22294809 Free PMC article. Clinical Trial.
-
Neurobehavioral dynamics following chronic sleep restriction: dose-response effects of one night for recovery.Sleep. 2010 Aug;33(8):1013-26. doi: 10.1093/sleep/33.8.1013. Sleep. 2010. PMID: 20815182 Free PMC article. Clinical Trial.
-
Classifying attentional vulnerability to total sleep deprivation using baseline features of Psychomotor Vigilance Test performance.Sci Rep. 2019 Aug 20;9(1):12102. doi: 10.1038/s41598-019-48280-4. Sci Rep. 2019. PMID: 31431644 Free PMC article.
-
Sleep deprivation and vigilant attention.Ann N Y Acad Sci. 2008;1129:305-22. doi: 10.1196/annals.1417.002. Ann N Y Acad Sci. 2008. PMID: 18591490 Review.
-
A local, bottom-up perspective on sleep deprivation and neurobehavioral performance.Curr Top Med Chem. 2011;11(19):2414-22. doi: 10.2174/156802611797470286. Curr Top Med Chem. 2011. PMID: 21906023 Free PMC article. Review.
Cited by
-
A single bout of passive exercise mitigates a mental fatigue-induced inhibitory control deficit.Exp Brain Res. 2023 Jul;241(7):1835-1845. doi: 10.1007/s00221-023-06640-7. Epub 2023 May 31. Exp Brain Res. 2023. PMID: 37256338
-
Pupillary fluctuation amplitude preceding target presentation is linked to the variable foreperiod effect on reaction time in Psychomotor Vigilance Tasks.PLoS One. 2022 Oct 20;17(10):e0276205. doi: 10.1371/journal.pone.0276205. eCollection 2022. PLoS One. 2022. PMID: 36264952 Free PMC article.
-
Abnormal dynamic functional connectivity after sleep deprivation from temporal variability perspective.Hum Brain Mapp. 2022 Aug 15;43(12):3824-3839. doi: 10.1002/hbm.25886. Epub 2022 May 7. Hum Brain Mapp. 2022. PMID: 35524680 Free PMC article.
-
Test-Retest Reliability of Resting Brain Small-World Network Properties across Different Data Processing and Modeling Strategies.Brain Sci. 2023 May 19;13(5):825. doi: 10.3390/brainsci13050825. Brain Sci. 2023. PMID: 37239297 Free PMC article.
-
Pupillary fluctuation amplitude before target presentation reflects short-term vigilance level in Psychomotor Vigilance Tasks.PLoS One. 2021 Sep 17;16(9):e0256953. doi: 10.1371/journal.pone.0256953. eCollection 2021. PLoS One. 2021. PMID: 34534237 Free PMC article.
References
-
- Hublin C, et al. . Insufficient sleep–a population-based study in adults. Sleep. 2001;24(4):392–400. - PubMed
-
- Dinges DF. An overview of sleepiness and accidents. J Sleep Res. 1995;4(S2):4–14. - PubMed
-
- Leger D. The cost of sleep-related accidents: a report for the National Commission on Sleep Disorders Research. Sleep. 1994;17(1):84–93. - PubMed
Publication types
MeSH terms
Grants and funding
LinkOut - more resources
Full Text Sources
Other Literature Sources
