Space and Time: The Hippocampus as a Sequence Generator
- PMID: 30266146
- PMCID: PMC6166479
- DOI: 10.1016/j.tics.2018.07.006
Space and Time: The Hippocampus as a Sequence Generator
Abstract
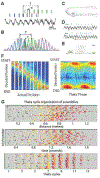
Neural computations are often compared to instrument-measured distance or duration, and such relationships are interpreted by a human observer. However, neural circuits do not depend on human-made instruments but perform computations relative to an internally defined rate-of-change. While neuronal correlations with external measures, such as distance or duration, can be observed in spike rates or other measures of neuronal activity, what matters for the brain is how such activity patterns are utilized by downstream neural observers. We suggest that hippocampal operations can be described by the sequential activity of neuronal assemblies and their internally defined rate of change without resorting to the concept of space or time.
Keywords: lateral septum; phase coding; place cells; theta oscillation; time cells.
Copyright © 2018 Elsevier Ltd. All rights reserved.
Figures


Similar articles
-
Theta rhythm and the encoding and retrieval of space and time.Neuroimage. 2014 Jan 15;85 Pt 2(0 2):656-66. doi: 10.1016/j.neuroimage.2013.06.022. Epub 2013 Jun 14. Neuroimage. 2014. PMID: 23774394 Free PMC article. Review.
-
Reversed theta sequences of hippocampal cell assemblies during backward travel.Nat Neurosci. 2014 May;17(5):719-24. doi: 10.1038/nn.3698. Epub 2014 Mar 25. Nat Neurosci. 2014. PMID: 24667574
-
Temporal encoding of place sequences by hippocampal cell assemblies.Neuron. 2006 Apr 6;50(1):145-57. doi: 10.1016/j.neuron.2006.02.023. Neuron. 2006. PMID: 16600862
-
Hippocampal theta oscillations are slower in humans than in rodents: implications for models of spatial navigation and memory.Philos Trans R Soc Lond B Biol Sci. 2013 Dec 23;369(1635):20130304. doi: 10.1098/rstb.2013.0304. Print 2014 Feb 5. Philos Trans R Soc Lond B Biol Sci. 2013. PMID: 24366145 Free PMC article. Review.
-
Memory, navigation and theta rhythm in the hippocampal-entorhinal system.Nat Neurosci. 2013 Feb;16(2):130-8. doi: 10.1038/nn.3304. Epub 2013 Jan 28. Nat Neurosci. 2013. PMID: 23354386 Free PMC article. Review.
Cited by
-
Phase precession in the human hippocampus and entorhinal cortex.Cell. 2021 Jun 10;184(12):3242-3255.e10. doi: 10.1016/j.cell.2021.04.017. Epub 2021 May 11. Cell. 2021. PMID: 33979655 Free PMC article.
-
Entorhinal mismatch: A model of self-supervised learning in the hippocampus.iScience. 2021 Mar 26;24(4):102364. doi: 10.1016/j.isci.2021.102364. eCollection 2021 Apr 23. iScience. 2021. PMID: 33997671 Free PMC article.
-
The hippocampus contributes to retroactive stimulus associations during trace fear conditioning.iScience. 2024 Jan 26;27(3):109035. doi: 10.1016/j.isci.2024.109035. eCollection 2024 Mar 15. iScience. 2024. PMID: 38375237 Free PMC article.
-
Proximal CA1 20-40 Hz power dynamics reflect trial-specific information processing supporting nonspatial sequence memory.Elife. 2022 May 9;11:e55528. doi: 10.7554/eLife.55528. Elife. 2022. PMID: 35532116 Free PMC article.
-
Minute-scale periodicity of neuronal firing in the human entorhinal cortex.Cell Rep. 2023 Nov 28;42(11):113271. doi: 10.1016/j.celrep.2023.113271. Epub 2023 Oct 31. Cell Rep. 2023. PMID: 37906591 Free PMC article.
References
-
- Tulving E (1985) Elements of episodic memory, Clarendon.
-
- Borges JL (1994) Ficciones, Grove Press.
-
- Rovelli C (2018) Reality is not what it seems : the journey to quantum gravity.
Publication types
MeSH terms
Grants and funding
LinkOut - more resources
Full Text Sources
Other Literature Sources

