. 2018 Oct:36:376-389.
doi: 10.1016/j.ebiom.2018.09.024. Epub 2018 Sep 26.

Glucocorticoid deficiency causes transcriptional and post-transcriptional reprogramming of glutamine metabolism

Affiliations

Glucocorticoid deficiency causes transcriptional and post-transcriptional reprogramming of glutamine metabolism

Meltem Weger et al. EBioMedicine. 2018 Oct.

Abstract

Background: Deficient glucocorticoid biosynthesis leading to adrenal insufficiency is life-threatening and is associated with significant co-morbidities. The affected pathways underlying the pathophysiology of co-morbidities due to glucocorticoid deficiency remain poorly understood and require further investigation.

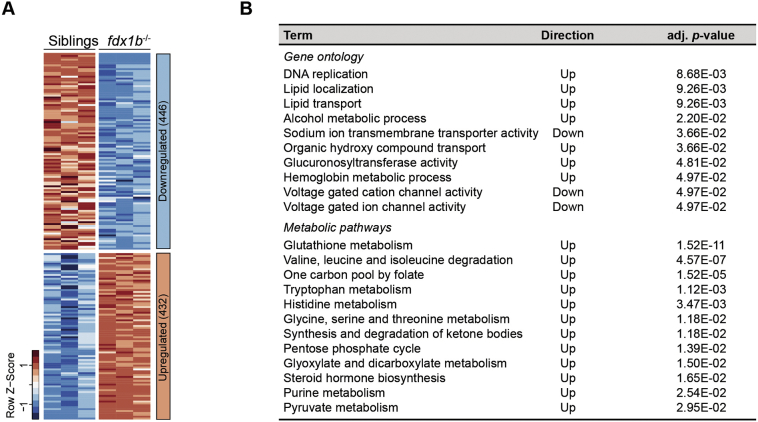
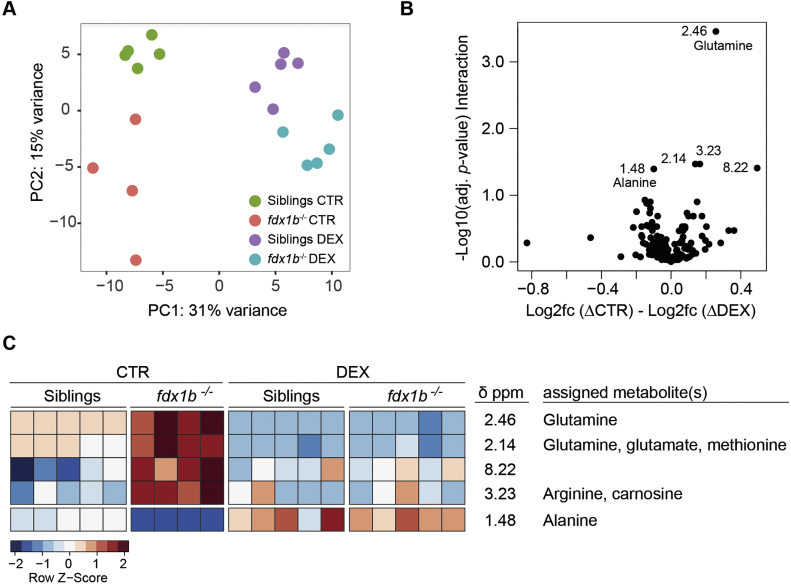
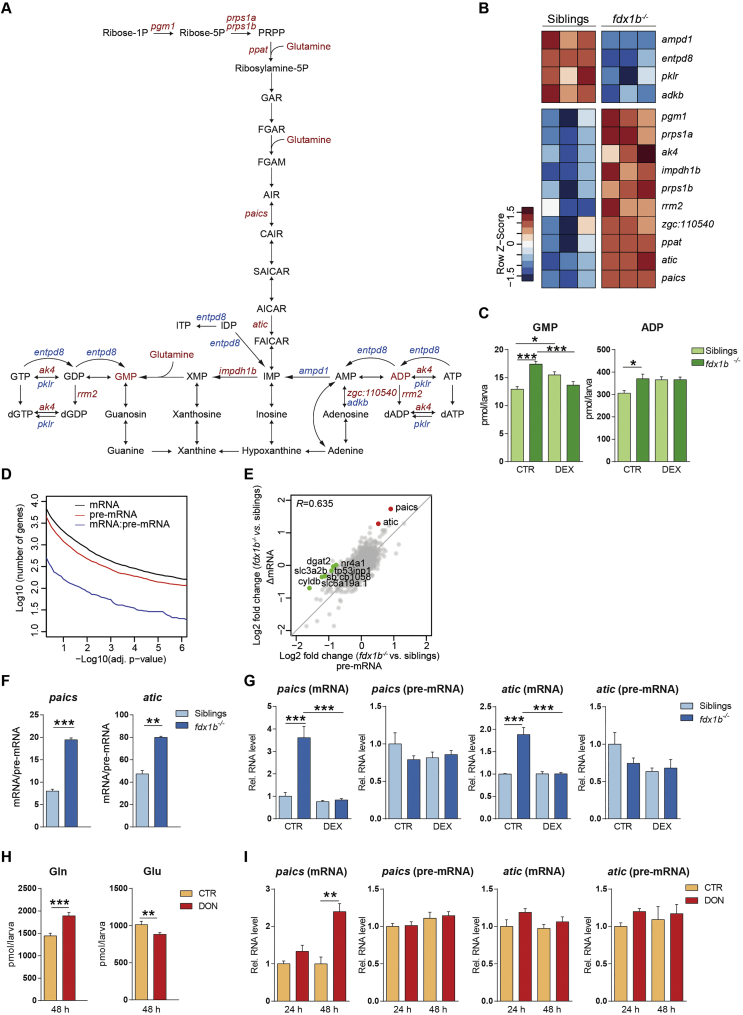
Methods: To explore the pathophysiological processes related to glucocorticoid deficiency, we have performed global transcriptional, post-transcriptional and metabolic profiling of a cortisol-deficient zebrafish mutant with a disrupted ferredoxin (fdx1b) system.

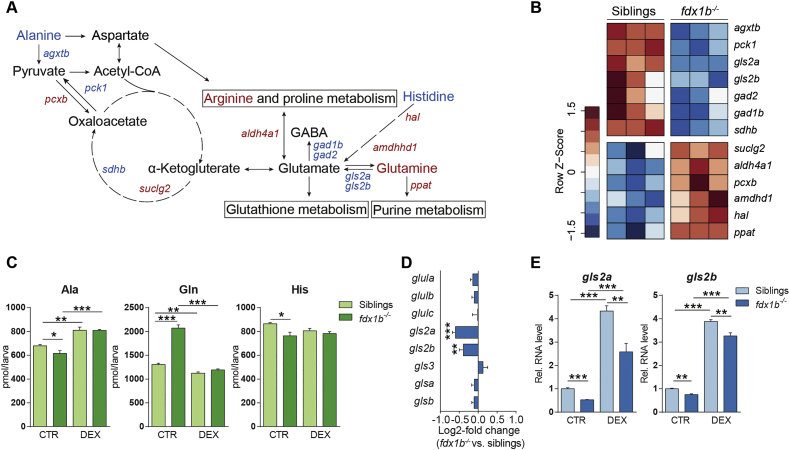
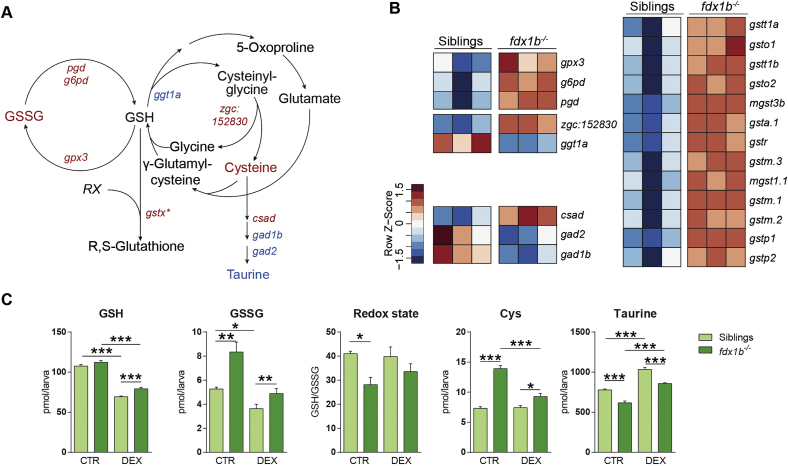
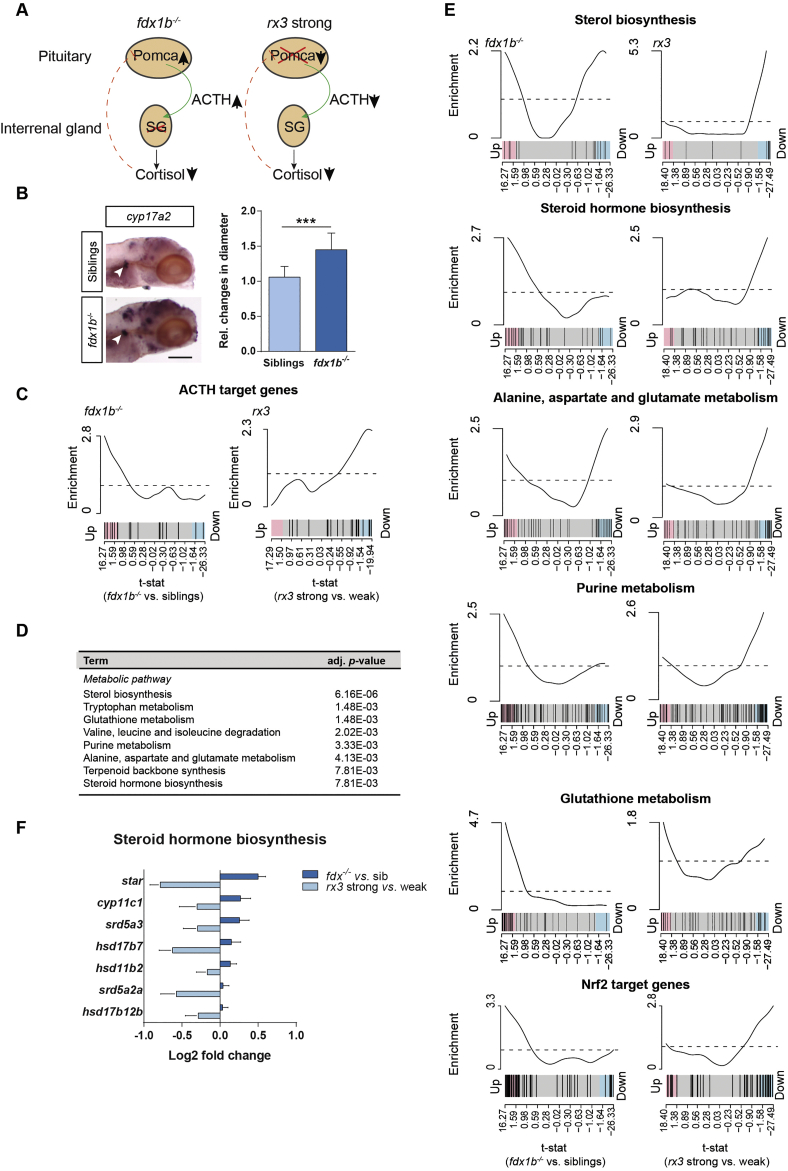
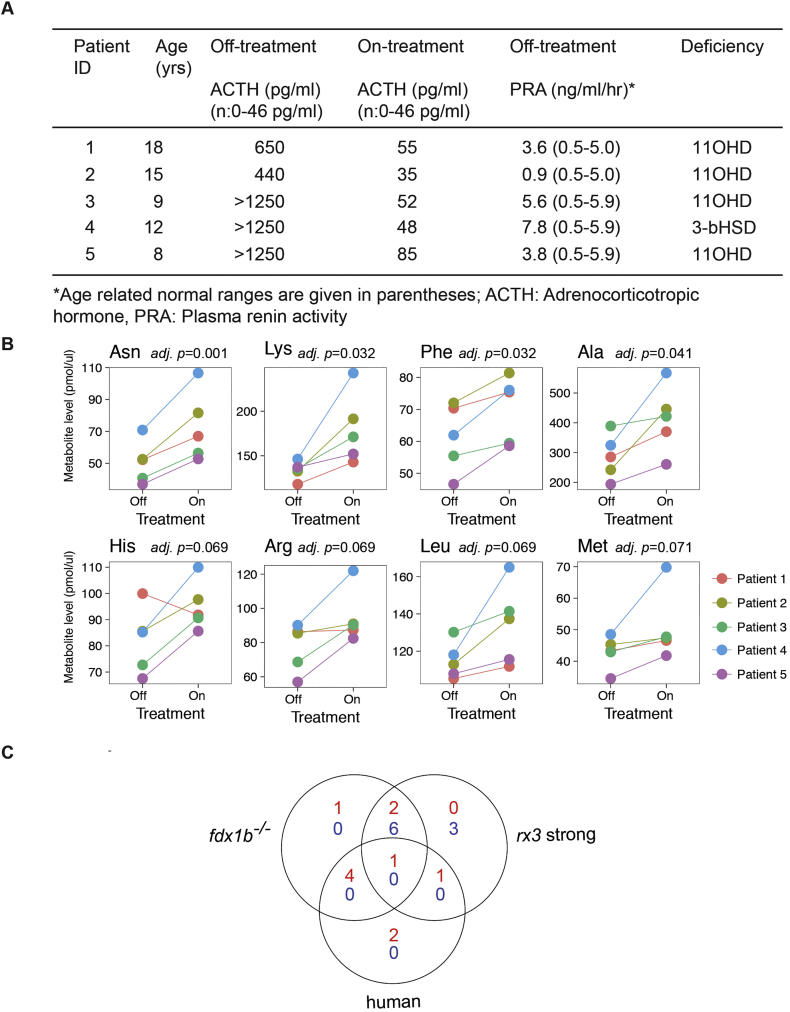
Findings: fdx1b−/− mutants show pervasive reprogramming of metabolism, in particular of glutamine-dependent pathways such as glutathione metabolism, and exhibit changes of oxidative stress markers. The glucocorticoid-dependent post-transcriptional regulation of key enzymes involved in de novo purine synthesis was also affected in this mutant. Moreover, fdx1b−/− mutants exhibit crucial features of primary adrenal insufficiency, and mirror metabolic changes detected in primary adrenal insufficiency patients.

Interpretation: Our study provides a detailed map of metabolic changes induced by glucocorticoid deficiency as a consequence of a disrupted ferredoxin system in an animal model of adrenal insufficiency. This improved pathophysiological understanding of global glucocorticoid deficiency informs on more targeted translational studies in humans suffering from conditions associated with glucocorticoid deficiency.

Fund: Marie Curie Intra-European Fellowships for Career Development, HGF-programme BIFTM, Deutsche Forschungsgemeinschaft, BBSRC.

Keywords: Adrenal insufficiency; Ferredoxin; Oxidative stress; Purine metabolism; Zebrafish.


Figures

Fig. 1
Fig. 1
fdx1b−/− mutants show an extensive transcriptional reprogramming of energy and biomolecule generating metabolic pathways. (A) Heatmap of normalized mRNA expression levels of genes in fdx1b−/− mutant larvae and wild-type siblings. Red, high expression; blue, low expression. From in total 878 differentially expressed genes, 446 genes were down-regulated, and 432 genes were up-regulated in fdx1b−/− mutant larvae. (B) Gene set enrichment analysis of differentially expressed genes (fdx1b−/−vs. wild-type sibling larvae). Direction indicates whether the up- or down-regulated genes in fdx1b−/− mutants are enriched for the indicated term.
Fig. 2
Fig. 2
Untargeted 1H NMR spectroscopy analysis reveals changes in the metabolome of fdx1−/− mutant larvae. (A) Principal component analysis (PCA) score plots of the 1H NMR spectra of fdx1b−/− mutant and wild-type sibling larvae treated with dexamethasone (DEX) or vehicle as control (CTR). (B) Volcano plot represents the difference in fold change for each peak between fdx1b−/− and wild-type sibling larvae under DEX and CTR treatment. Significant peaks are labeled. (C) Heatmap of peaks with a significant interaction. Red = high expression; blue = low expression. The assigned metabolites including glutamine and alanine are altered in fdx1b−/− mutant larvae under basal conditions, but not upon DEX treatment.
Fig. 3
Fig. 3
fdx1b−/− mutant larvae exhibit alterations in gene expression related to alanine, aspartate and glutamate metabolism and in glutamine-family amino acids. (A) Schematic represents “alanine, aspartate and glutamate metabolism”, and glutamine-family amino acids. Altered metabolites and genes in fdx1b−/− larvae are indicated in red for up-regulation and blue for down-regulation. (B) Heatmap showing differentially expressed genes of alanine, aspartate and glutamate metabolism in fdx1b−/− mutant larvae. (C) HPLC-based measurements of metabolite levels of alanine (Ala), glutamine (Gln) and histidine (His) in fdx1b−/− mutant larvae and wild-type siblings in the in the absence (CTR) or presence of dexamethasone (DEX). (D) Fold change of glutamate metabolism genes of fdx1b−/−vs. wild-type sibling larvae. (E) qRT-PCR analysis of the zebrafish gls2a and gls2b in fdx1b−/− mutant larvae and wild-type siblings (120 hpf) in the absence (CTR) or presence of dexamethasone (DEX).
Fig. 4
Fig. 4
Dysregulations in glutathione metabolism and markers of oxidative stress in fdx1b−/− mutant larvae are only partially caused by glucocorticoid-deficiency. (A) Schematic illustrates “glutathione metabolism”. Metabolites and genes of this pathway altered in fdx1b−/− larvae are marked in red for up-regulation and blue for down-regulation. (B) Heatmap showing differentially expressed genes of glutathione metabolism in fdx1b−/− mutant larvae. (C) Metabolite levels of cysteine (Cys), reduced (GSH) and oxidized (GSSG) glutathione, taurine and the GSH/GSSG ratio as a measure of oxidative stress in fdx1b−/− mutant and wild-type sibling larvae in the absence (CTR) or presence of dexamethasone (DEX).
Fig. 5
Fig. 5
Glucocorticoids regulate de novo purine synthesis at a post-transcriptional level. (A) Schematic of the “purine metabolism” pathway. Metabolites and genes of this pathway altered in fdx1b−/− mutant larvae are marked in red for up-regulation and blue for down-regulation. (B) Heatmap showing differentially expressed genes of purine metabolism in fdx1b−/− mutant larvae. (C) Metabolite levels of guanosine monophosphate (GMP) and adenosine diphosphate (ADP) in fdx1b−/− mutant and wild-type sibling larvae (120 hpf) in the absence (CTR) or presence of dexamethasone (DEX). (D) Number of differentially expressed genes in function of the adjusted p-value grouped by the different levels at which they were assessed. mRNA (black), pre-mRNA (red), and genes that are differentially affected between mRNA and pre-mRNA (blue). (E) Comparison of pre-mRNA and mRNA expression changes in fdx1b−/− mutant larvae. R indicates Pearson correlation. Significantly deregulated genes at the level of ∆exon-∆intron are labeled green. Predominantly post-transcriptional (∆exon>∆intron) altered genes are shown in red. (F) mRNA half-life approximation of paics and atic in fdx1b−/− mutant and wild-type sibling larvae. (G) qRT-PCR analysis assessing mRNA and pre-mRNA levels of paics and atic in fdx1b−/− mutant and wild-type sibling larvae (120 hpf) in the absence (CTR) or presence of dexamethasone (DEX). (H, I) Glutamine (Gln) and glutamate (Glu) levels (H) and transcript levels of paics and atic (I) in wild-type larvae treated with the glutaminase inhibitor 6-Diazo-5-oxo-L-nor-Leucine (DON) or vehicle as a control (CTR).
Fig. 6
Fig. 6
fdx1b−/− mutant larvae exhibit hallmarks of primary adrenal insufficiency and differ from rx3 strong mutant larvae reminiscent to secondary adrenal insufficiency. (A) Schematic shows the different alterations in the pituitary and interrenal gland axis of fdx1b−/− and rx3 strong mutant larvae. Abbreviations: Pomca, pro-opiomelanocortin; ACTH, adrenocorticotropin; SG, steroidogenesis. (B) Whole-mount in situ hybridization of cyp17a2 to visualize the interrenal gland (arrow) in fdx1b−/− mutant larvae (n = 17) and wild-type siblings (n = 11) at 120 hpf stage. Bar plot shows the relative (rel.) changes in the diameter of the interrenal gland size. (C) Barcode plots for ACTH target genes in fdx1−/− mutant larvae (left) and rx3 strong mutant larvae (right). The two mutant types show opposing directions in the gene set enrichment (p-value = 1.7 E−04) for gene set enrichment analysis. (D) Gene set enrichment analysis of differentially expressed genes showing different regulation between fdx1b−/− and rx3 strong. (E) Barcode plots for metabolic pathways and Nrf2 target genes in fdx1b−/− mutant larvae (left) and rx3 strong mutant larvae (right) in comparison to the corresponding control (wild-type siblings or rx3 weak). (F) Fold changes of differentially expressed genes in steroid hormone biosynthesis between mutant larvae and their corresponding controls. The data for the rx3 mutants is a reanalysis from our previously published data set [74]. Scale bar = 110 μm. *, p < .05, **, p < .01, ***, p < .001.
Fig. 7
Fig. 7
Amino acid changes in plasma of patients with primary adrenal insufficiency overlap with changes observed in fdx1b−/− mutant larvae. (A) Hormonal features of patients with primary adrenal insufficiency on hydrocortisone treatment and after 48 h interruption of therapy. (B) Levels of the amino acids asparagine (Asn), lysine (Lys), phenylalanine (Phe), alanine (Ala), histidine (His), arginine (Arg), leucine (Leu), and methionine (Met) in human patient plasma in On and Off treatment conditions. (C) Venn diagram showing the altered amino acids in human patients with primary insufficiency, fdx1b−/− and rx3 strong mutants between untreated and treated conditions. More amino acids are altered between human and fdx1b−/− mutants (p = .02; assessed by hypergeometric testing) than between human and rx3 strong mutants (p = .18). The data for the rx3 mutants is a reanalysis from our previously published data set [74].

Comment in

Similar articles

Cited by

References

    1. Alam M.M., Okazaki K., Nguyen L.T.T., Ota N., Kitamura H., Murakami S. Glucocorticoid receptor signaling represses the antioxidant response by inhibiting histone acetylation mediated by the transcriptional activator NRF2. J Biol Chem. 2017;292:7519–7530. - PMC - PubMed
    1. Altman B.J., Stine Z.E., Dang C.V. From Krebs to clinic: glutamine metabolism to cancer therapy. Nat Rev Cancer. 2016;16:749. - PubMed
    1. Alwashih M.A., Watson D.G., Andrew R., Stimson R.H., Alossaimi M., Blackburn G. Plasma metabolomic profile varies with glucocorticoid dose in patients with congenital adrenal hyperplasia. Sci Rep. 2017;7(17092) - PMC - PubMed
    1. Atger F., Gobet C., Marquis J., Martin E., Wang J., Weger B. Circadian and feeding rhythms differentially affect rhythmic mRNA transcription and translation in mouse liver. Proc Natl Acad Sci U S A. 2015;112:E6579–E6588. - PMC - PubMed
    1. Bancos I., Hahner S., Tomlinson J., Arlt W. Diagnosis and management of adrenal insufficiency. Lancet Diabetes Endocrinol. 2015;3:216–226. - PubMed