. 2018 Oct:36:304-315.
doi: 10.1016/j.ebiom.2018.09.027. Epub 2018 Sep 25.

Activation of mTORC1 signaling in gastric X/A-like cells induces spontaneous pancreatic fibrosis and derangement of glucose metabolism by reducing ghrelin production

Affiliations

Activation of mTORC1 signaling in gastric X/A-like cells induces spontaneous pancreatic fibrosis and derangement of glucose metabolism by reducing ghrelin production

Ruili Yu et al. EBioMedicine. 2018 Oct.

Abstract

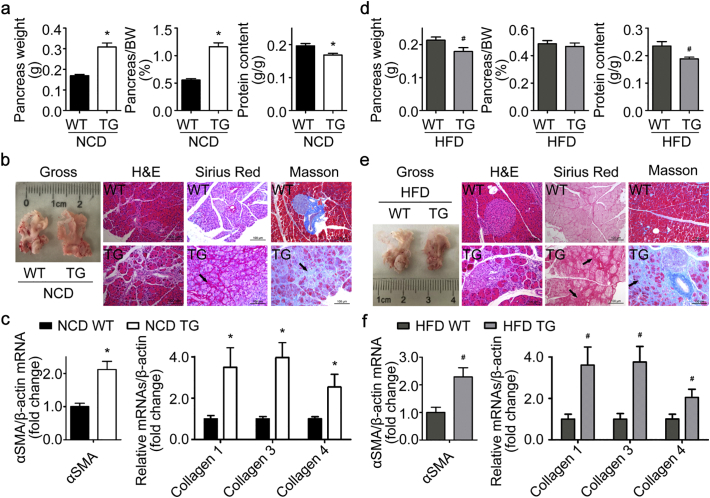
Background: Pancreatic fibrosis is a pathophysiological process associated with excessive deposition of extracellular matrix in pancreas, leading to reduced insulin secretion and derangement of glucose metabolism. X/A-like cells, a group of unique endocrine cells in gastric oxyntic mucosa, produce and secret ghrelin to influence energy balance. Whether gastric X/A-like cells affect pancreatic fibrosis and subsequent glucose homeostasis remains unclear.

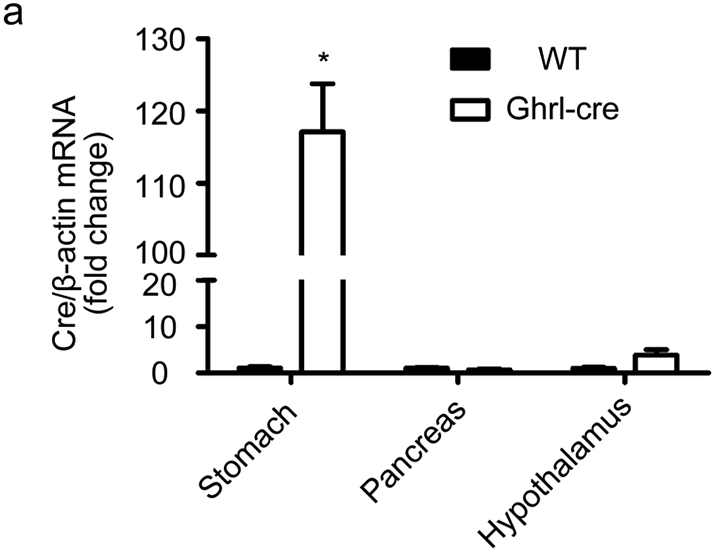
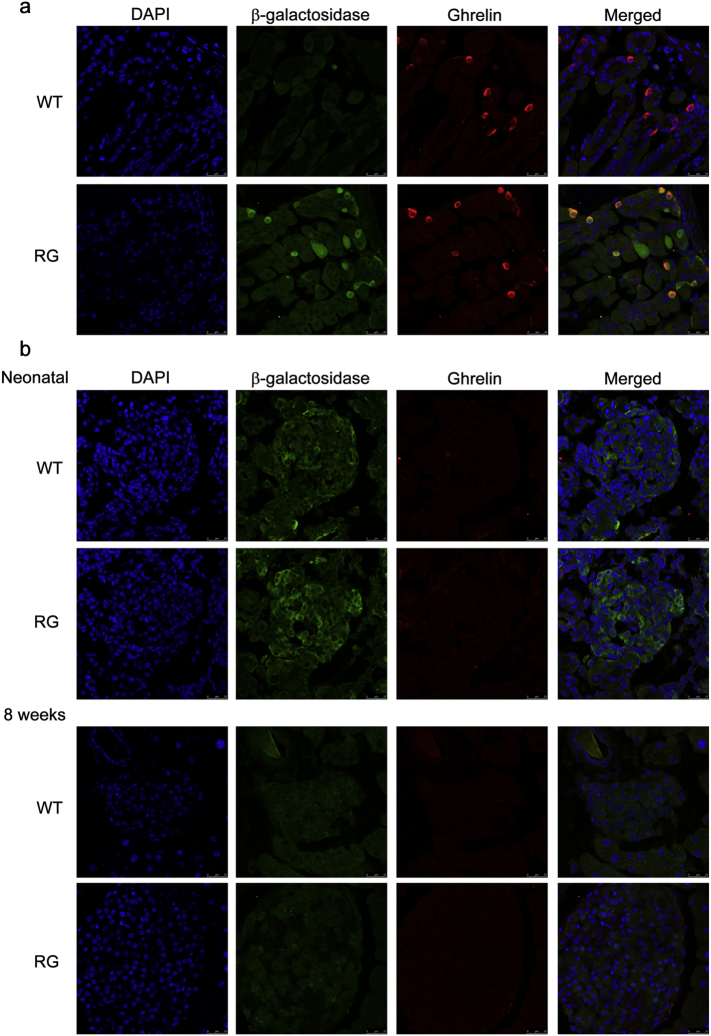
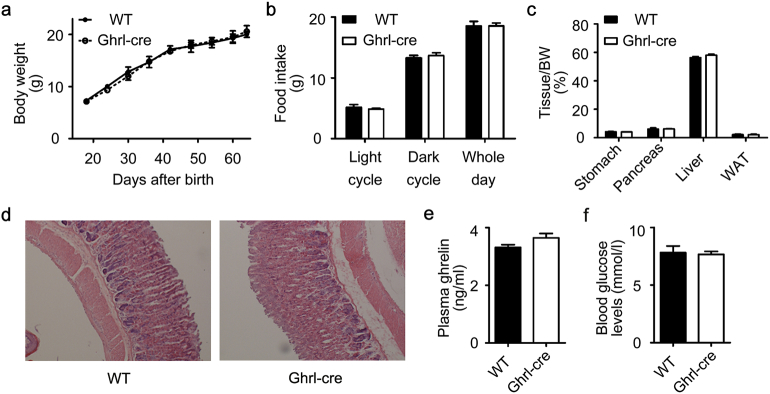
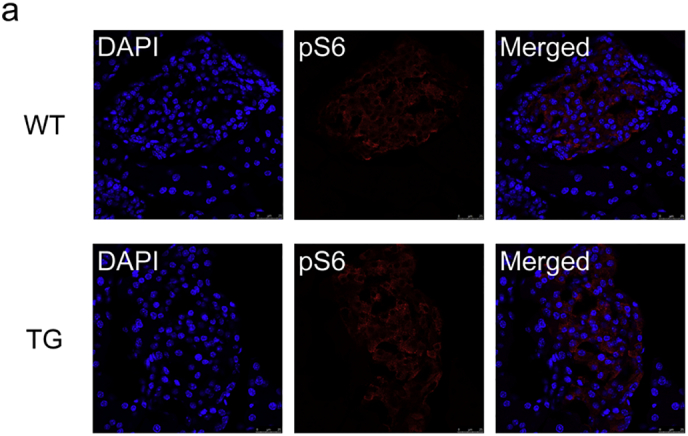
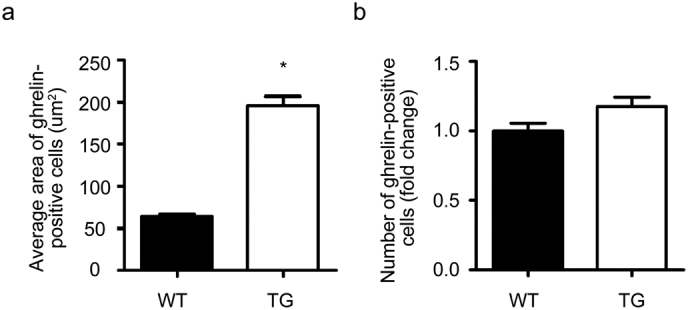
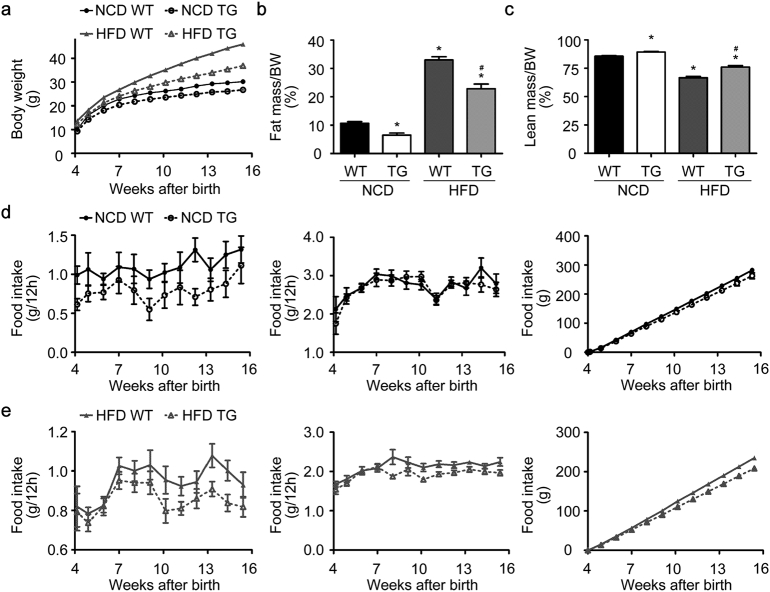
Methods: We established a Ghrl-cre transgene in which the cre enzyme is expressed in X/A-like cells under the control of ghrelin-promoter. TSC1flox/flox mice were bred with Ghrl-cre mice to generate Ghrl-TSC1-/- (TG) mice, within which mTORC1 signaling was activated in X/A-like cells. Pancreatic fibrosis and insulin secretion were analyzed in the TG mice.

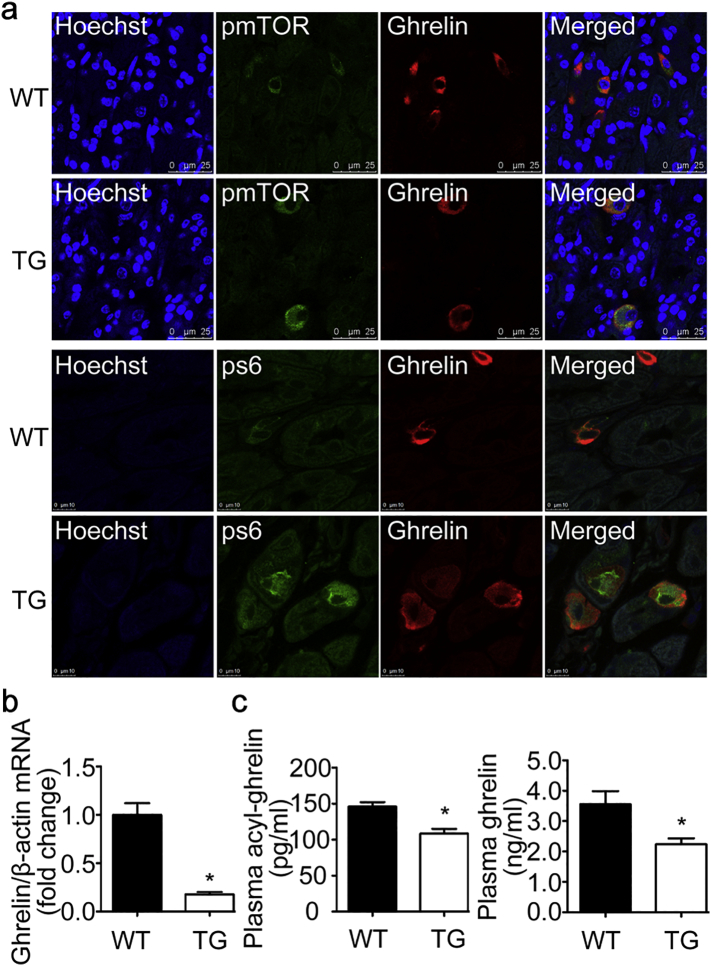
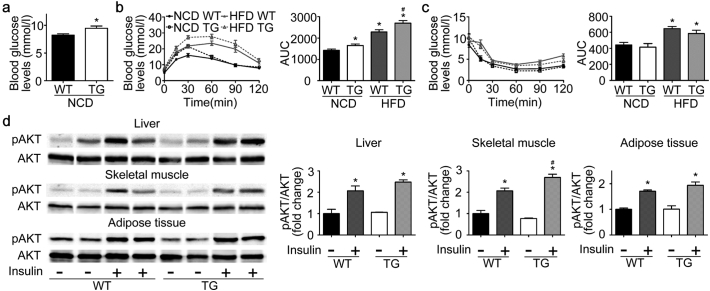
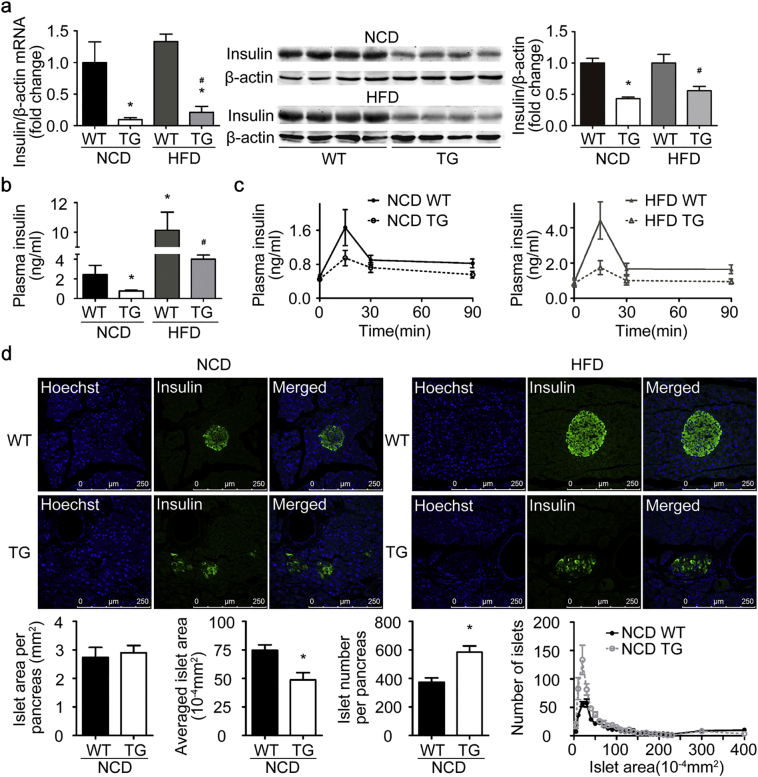
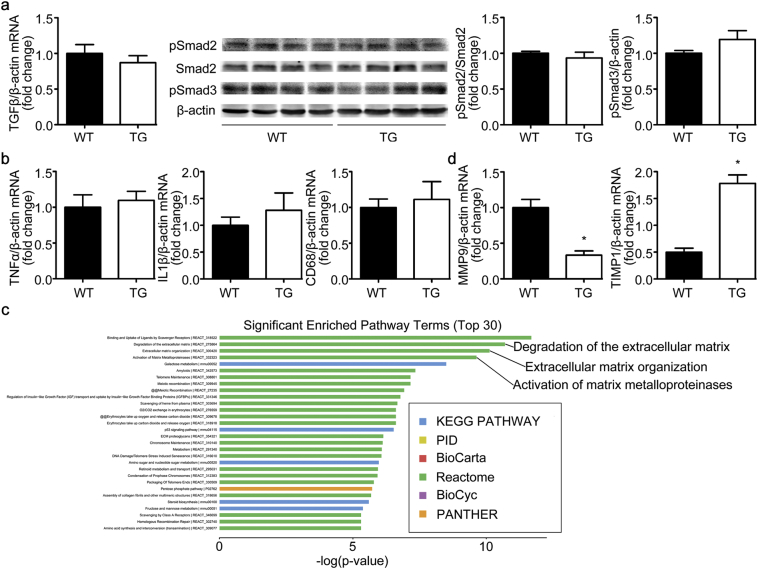
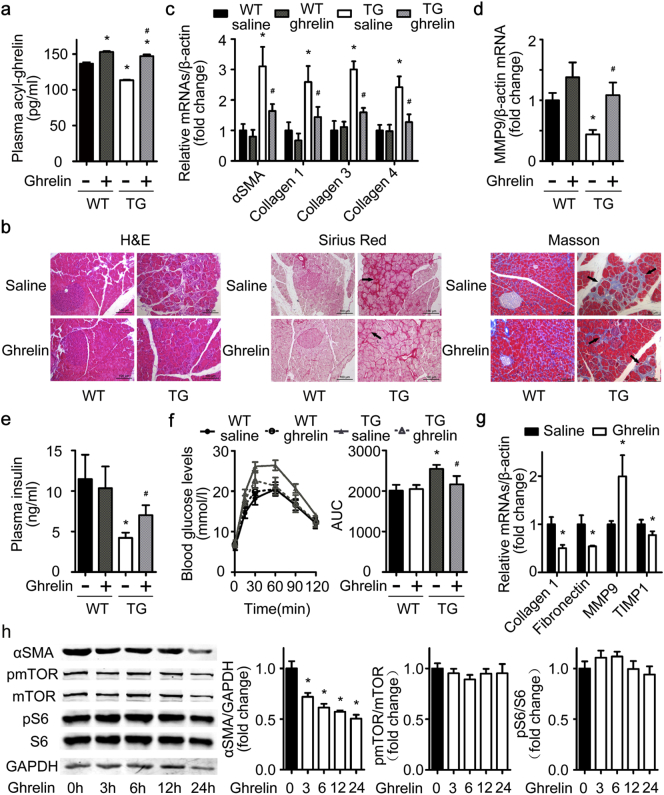
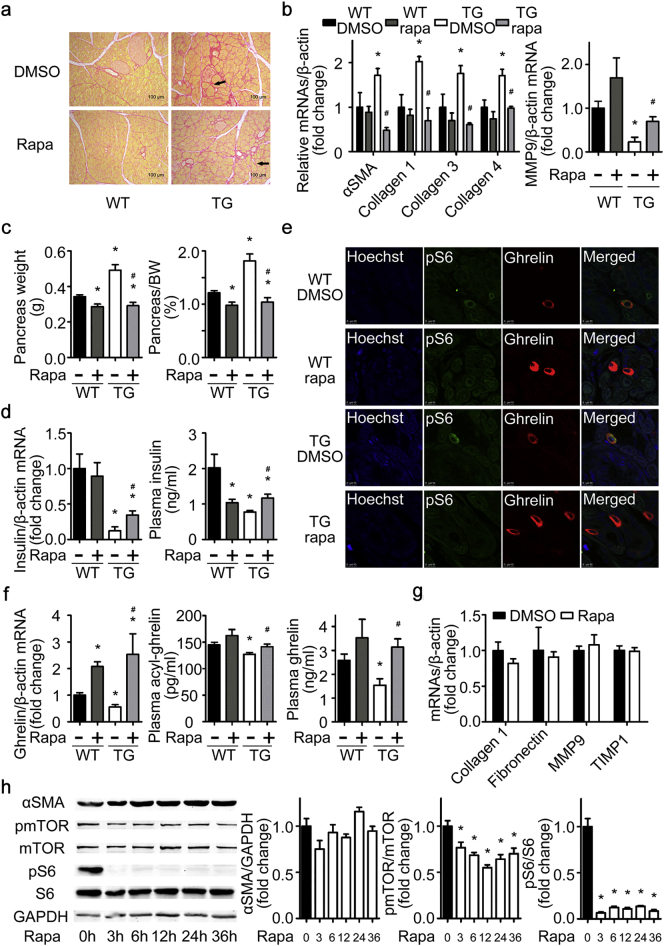
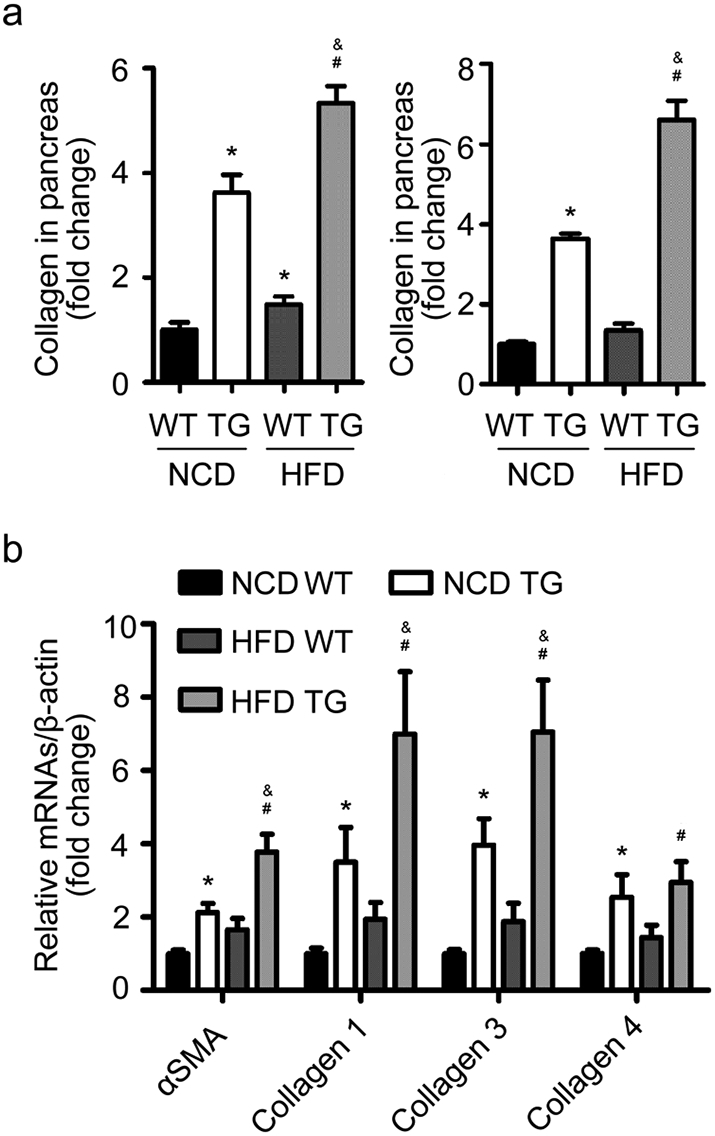
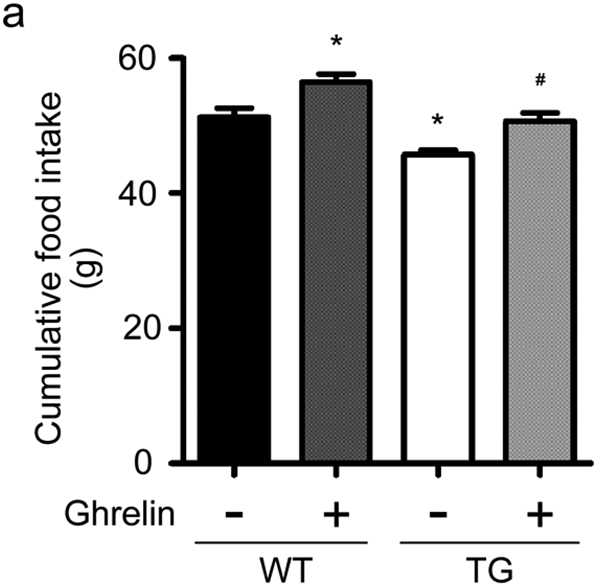
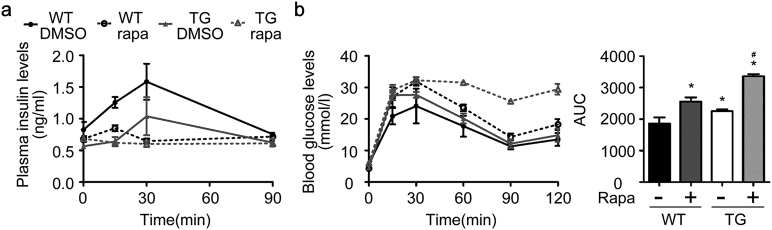
Findings: Activation of mTORC1 signaling by deletion of TSC1 gene in gastric X/A-like cells induced spontaneous pancreatic fibrosis. This alteration was associated with reduced insulin expression and secretion, as well as impaired glucose metabolism. Activation of mTORC1 signaling in gastric X/A-like cells reduced gastric and circulating ghrelin levels. Exogenous ghrelin reversed pancreatic fibrosis and glucose intolerance induced by activation of mTORC1 signaling in these cells. Rapamycin, an inhibitor of mTOR, reversed the decrease of ghrelin levels and pancreatic fibrosis.

Interpretation: Activation of mTORC1 signaling in gastric X/A-like cells induces spontaneous pancreatic fibrosis and subsequently impairs glucose homeostasis via suppression of ghrelin.

Keywords: Fibrosis; Ghrelin; Glucose metabolism; Matrix metalloproteinases; Pancreatic islets.


Figures

Fig. 1
Fig. 1
Ghrl-TSC1−/− mice. Ghrl-TSC1−/− transgenic mice were generated by cross-breeding Ghrl-cre transgenes with TSC1flox/flox mice. Validated Ghrl-TSC1−/− mice and wild-type littermates were fed with normal chow diet (NCD) for 16 weeks. Data was presented as mean ± SEM. *P < 0.05 vs. WT. n = 11. a. Validation of mTORC1 activation in X/A-like cells. mTORC1 activity was measured by phosphorylation of mTOR and S6 using immunofluorescent staining. X/A-like cells were identified by ghrelin immunoreactivity. Shown is the co-localization of pmTOR or pS6 (green) with ghrelin (red) in mouse stomach. Nuclei were stained with Hoechst dye (blue). b. mRNA levels of gastric ghrelin analyzed by RT-qPCR. β-actin was used as internal control. c. Plasma levels of acyl-ghrelin and total ghrelin.
Fig. 2
Fig. 2
Spontaneous pancreatic fibrosis in Ghrl-TSC1−/− mice. Four-week-old Ghrl-TSC1−/− mice and wild-type littermates were fed with normal chow diet (NCD) or 60% high fat diet (HFD) for 12 weeks. Results were expressed as mean ± SEM. *P < 0.05 vs. NCD WT. #P < 0.05 vs. HFD WT. n = 11 for NCD or 12 for HFD. a. d. Pancreas weights and protein contents in pancreas of mice fed with NCD (a) or HFD (d). b. e. Morphology of pancreas in mice fed with NCD (b) or HFD (e). Shown were gross morphology, H&E, Sirius Red, and Masson staining of pancreas. Arrows identify the representative bands of fibrosis. c. f. mRNA levels of relative genes in pancreas of mice fed with NCD (c) or HFD (f) analyzed by RT-qPCR. β-actin was used as internal control.
Fig. 3
Fig. 3
Impaired glucose metabolism in Ghrl-TSC1−/− mice. Four-week-old Ghrl-TSC1−/− mice and wild-type littermates were fed with normal chow diet (NCD) or 60% high fat diet (HFD) for 12 weeks. Data was expressed as mean ± SEM. *P < 0.05 vs. WT NCD or WT saline. #P < 0.05 vs. WT HFD or WT insulin. n = 11 for NCD or 12 for HFD. a. Basal glucose levels in blood. b. Glucose tolerance test and the area under curve. c. Insulin tolerance test and the area under curve. d. Levels of pAKT and AKT in liver, skeletal muscle, and adipose tissue. Shown were representative western blots from HFD-induced obese mice received intraperitoneal injection of insulin (1 U/kg) or saline for 15 min. β-actin was used as loading control. Signal intensity was quantified using Image J software.
Fig. 4
Fig. 4
Decreased insulin expression and secretion in Ghrl-TSC1−/− mice. Four-week-old Ghrl-TSC1−/− mice and wild-type littermates were fed with normal chow diet (NCD) or 60% high fat diet (HFD) for 12 weeks. Data was expressed as mean ± SEM. *P < 0.05 vs. NCD WT. #P < 0.05 vs. HFD WT. n = 11–12 unless indicated otherwise. β-actin was used as internal control. a. Levels of insulin mRNA and protein. b. Basal plasma levels of insulin. c. Plasma insulin levels during oral glucose tolerance test. n = 8. d. Insulin immunoreactivity (green) in mouse pancreas. And nuclei were stained with Hoechst dye (blue). Islet area and number were measured and calculated. Sections were obtained at 100-um intervals from each pancreas. All sections of each pancreas were stained with H&E and observed with a Leica microscope. The islet area, islet number, and average size of islets were determined using the Image J software.
Fig. 5
Fig. 5
Analysis of fibrosis-related genes in pancreas. Ghrl-TSC1−/− mice and wild-type littermates were fed with normal chow (NCD) for 16 weeks. Pancreatic total RNA and protein were extracted. mRNA was analyzed by RT-qPCR. Proteins were analyzed by western blots. β-actin was used as internal control. Data was expressed as mean ± SEM. *P < 0.05 vs. WT. n = 11. a. Expression of TGFβ and its downstream molecules in pancreas. b. mRNA levels of inflammatory cytokine genes. c. Significant enriched pathways analyzed by RNAseq. d. Validation of MMP9 and TIMP1 expression in pancreas.
Fig. 6
Fig. 6
Reversal effects of exogenous ghrelin. Four-week-old Ghrl-TSC1−/− mice and wild-type littermates were fed with 60% high fat diet (HFD) for 12 weeks. Acyl-ghrelin or saline was continuously infused (11 nmol·kg−1·d−1) for 2 weeks. Data was expressed as mean ± SEM. β-actin was used as internal control. a. Plasma acyl-ghrelin levels. b. H&E, Sirius Red staining, and Masson staining of pancreas. Arrows identify the representative bands of fibrosis. c. mRNA levels of fibrosis-relative genes in pancreas. d. Expression of MMP9 in pancreas. e. Basal plasma insulin levels. *P < 0.05 vs. WT saline. #P < 0.05 vs. TG saline. n = 9–11. f. Glucose tolerance test and the area under curve. *P < 0.05 vs. WT saline. #P < 0.05 vs. TG saline. n = 9–11. g. Direct effect of ghrelin on pancreatic stellate cells. Cultured human pancreatic stellate cells were treated with acyl-ghrelin (10−8 mol/l) or saline for 6 h. mRNA levels of collagen I, fibronectin, MMP9, and TIMP1 were analyzed by RT-qPCR. Experiments were repeated for three times. *P < 0.05 vs. Saline. h. Cultured human pancreatic stellate cells were treated with acyl-ghrelin (10−8 mol/l) or saline for time indicated. Shown were the representative western blots. Antibodies against αSMA, pmTOR, mTOR, pS6, and S6 were used. GAPDH was used as loading controls. Signal intensity was quantified and normalized with GAPDH. Experiments were repeated for three times. *P < 0.05 vs. Ghrelin 0 h.
Fig. 7
Fig. 7
Reversal effects of rapamycin. Ghrl-TSC1−/− mice and wild-type littermates fed with normal chow diet (NCD) for 16 weeks were used. Rapamycin (1 mg·kg−1·d−1) or DMSO was intraperitoneally injected for 2 weeks. a. Sirius Red staining of pancreas. Arrows identify the representative bands of fibrosis. b. mRNA levels of fibrosis-relative genes normalized to β-actin. c. Pancreas weights. d. Levels of insulin mRNA in pancreas and plasma insulin. e. Co-localization of pS6 (green) with ghrelin (red) in mouse stomach. Nuclei were stained with Hoechst dye (blue). f. Ghrelin mRNA in stomach, and plasma levels of acyl-ghrelin and total ghrelin. n = 8–12. *P < 0.05 vs. WT DMSO. #P < 0.05 vs. TG DMSO. g. Effects of rapamycin on pancreatic stellate cells. Cultured human pancreatic stellate cells were treated with rapamycin (1 nmol/l) or DMSO for 12 h. mRNA levels of collagen I, fibronectin, MMP9, and TIMP1 were analyzed by RT-qPCR. β-actin was used as internal control. Experiments were repeated for three times. h. Cultured human pancreatic stellate cells were treated with rapamycin (1 nmol/l) or DMSO for time indicated. αSMA, pmTOR, mTOR, pS6, and S6 were examined by western blots. GAPDH was used as internal control. Experiments were repeated for three times. *P> < 0.05 vs. Rapa 0 h.
Fig. S1
Fig. S1
High levels of cre gene in the stomach Twelve-week-old Ghrl-cre mice and wild-type littermates (WT) were fed with normal chow diet. (a) Levels of cre mRNA in stomach, pancreas, and hypothalamus detected by RT-qPCR. β-actin was used as internal control. Data was presented as mean ± SEM. *P < 0.05 vs. WT. n = 3.
Fig. S2
Fig. S2
Validation of Ghrl-cre transgenic mice To generate ROSA-Ghrl-cre (RG) transgene, Ghrl-cre mice were bred with Gt(Rosa)26Sortmlsor/J mice which carry the β-galactosidase reporter gene. ROSA-Ghrl-cre (RG) mice and wild-type (WT) littermates were sacrificed at twelve week-old or ages indicated. The stomach and pancreas were sectioned and stained for β-galactosidase (green) and ghrelin (red). Nuclei were stained with DAPI (blue). n = 12 and 15 for wild-type littermates and transgene, respectively. Cre enzyme in stomach (a) and pancreas (b) was detected using a specific antibody against β-galactosidase.
Fig. S3
Fig. S3
No significant phenotype of Ghrl-cre transgenic mice Ghrl-cre mice and wild-type littermates (WT) were fed with normal chow diet (NCD) for 2 months. (a) Body weight. (b) Food intake. (c) Stomach, pancreas, liver, and WAT weight expressed as percentage of body weight. (d) Gastric H&E staining. (e) Plasma ghrelin. (f) Basal glucose levels in blood. n = 7.
Fig. S4
Fig. S4
No alteration in mTORC1 activity in pancreatic islets of Ghrl-TSC1−/− mice Ghrl-TSC1−/− (TG) mice and wild-type (WT) littermates were fed with normal chow diet (NCD) for 16 weeks. mTORC1 activity in pancreatic islets was measured by phosphorylation of S6 (green) using immunofluorescent staining. Nuclei were stained with DAPI dye (blue). n = 6.
Fig. S5
Fig. S5
Hypertrophy of gastric X/A-like cells in Ghrl-TSC1−/− mice Gastric sections were stained with mouse antibody against ghrelin and detected by fluorescence. Image of ghrelin-positive cells were captured from five random views of each section and analyzed for average area (a) and the number (b) of ghrelin-positive cells. n = 11. *P < 0.05 vs WT.
Fig. S6
Fig. S6
More severe pancreatic fibrosis in Ghrl-TSC1−/− mice fed with HFD Four-week-old Ghrl-TSC1−/− mice (TG) and wild-type littermates (WT) were fed with normal chow diet (NCD) or 60% high fat diet (HFD) for 12 weeks. Results were expressed as mean ± SEM. *P < 0.05 vs. NCD WT. #P < 0.05 vs. HFD WT. &P < 0.05 vs. NCD TG. n = 11 for NCD or 12 for HFD. (a) Pancreatic collagen were detected by Sirius Red (left) and Masson staining (right), and determined using the Image J software. (b) mRNA levels of genes related to fibrosis in pancreas were analyzed by RT-qPCR. β-actin was used as internal control.
Fig. S7
Fig. S7
Effects of mTORC1 activation in gastric X/A-like cells on body weight and food intake Four-week-old Ghrl-TSC1−/− mice and wild-type littermates were fed with normal chow diet (NCD) or 60% high fat diet (HFD) for 12 weeks. (a) Body weight. (b) Fat mass measured by MRI and expressed as percentage of body weight. (c) Lean mass measured by MRI and expressed as percentage of body weight. *P < 0.05 vs. NCD WT. #P < 0.05 vs. HFD WT. n = 11–12. (d) Food intake in Ghrl-TSC1−/− mice and wild-type littermates fed with normal chow diet (NCD). n = 11. (e) Food intake in Ghrl-TSC1−/− mice and wild-type littermates fed with 60% high fat diet (HFD). n = 12.
Fig. S8
Fig. S8
Reversal of reduced food intake in Ghrl-TSC1−/− mice by exogenous ghrelin Four-week-old Ghrl-TSC1−/− mice (TG) and wild-type littermates (WT) were fed with 60% high fat diet (HFD) for 12 weeks. Acyl-ghrelin (11 nmol·kg−1·d−1) or saline was continuously infused for 2 weeks. Food intake (a) were measured daily during infusion. *P < 0.05 vs. WT saline. #P < 0.05 vs. TG saline. n = 9–11.
Fig. S9
Fig. S9
Effects of rapamycin on glucose metabolism Ghrl-TSC1−/− mice and wild-type littermates fed with normal chow diet (NCD) for 16 weeks were intraperitoneally injected with rapamycin (1 mg·kg−1·d−1) or DMSO for 2 weeks. Dynamic plasma insulin (a) and glucose levels (b) were measured during oral glucose tolerance test. AUC: area under curve. n = 8–12. *P < 0.05 vs. WT DMSO. #P < 0.05 vs. TG DMSO.

Similar articles

Cited by

References

    1. Rockey D.C., Bell P.D., Hill J.A. Fibrosis--a common pathway to organ injury and failure. N Engl J Med. 2015;372(12):1138–1149. - PubMed
    1. Zeisberg M., Kalluri R. Cellular mechanisms of tissue fibrosis. 1. Common and organ-specific mechanisms associated with tissue fibrosis. Am J Physiol Cell Physiol. 2013;304(3):216–225. - PMC - PubMed
    1. Tran T.C., Van'T Hof G., Kazemier G. Pancreatic fibrosis correlates with exocrine pancreatic insufficiency after pancreatoduodenectomy. Dig Surg. 2008;25(4):311–318. - PubMed
    1. Kopelman H., Corey M., Gaskin K., Durie P., Weizman Z., Forstner G. Impaired chloride secretion, as well as bicarbonate secretion, underlies the fluid secretory defect in the cystic fibrosis pancreas. Gastroenterology. 1988;95(2):349–355. - PubMed
    1. Kopelman H., Durie P., Gaskin K., Weizman Z., Forstner G. Pancreatic fluid secretion and protein hyperconcentration in cystic fibrosis. N Engl J Med. 1985;312(6):329–334. - PubMed

MeSH terms

LinkOut - more resources