

Measuring human capital: a systematic analysis of 195 countries and territories, 1990-2016
- PMID: 30266414
- PMCID: PMC7845481
- DOI: 10.1016/S0140-6736(18)31941-X
Measuring human capital: a systematic analysis of 195 countries and territories, 1990-2016
Abstract
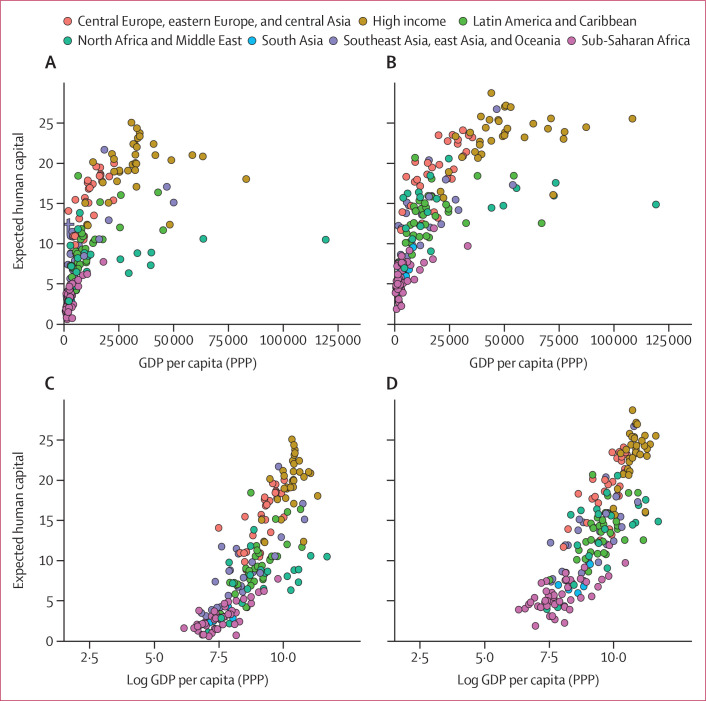
Background: Human capital is recognised as the level of education and health in a population and is considered an important determinant of economic growth. The World Bank has called for measurement and annual reporting of human capital to track and motivate investments in health and education and enhance productivity. We aim to provide a new comprehensive measure of human capital across countries globally.
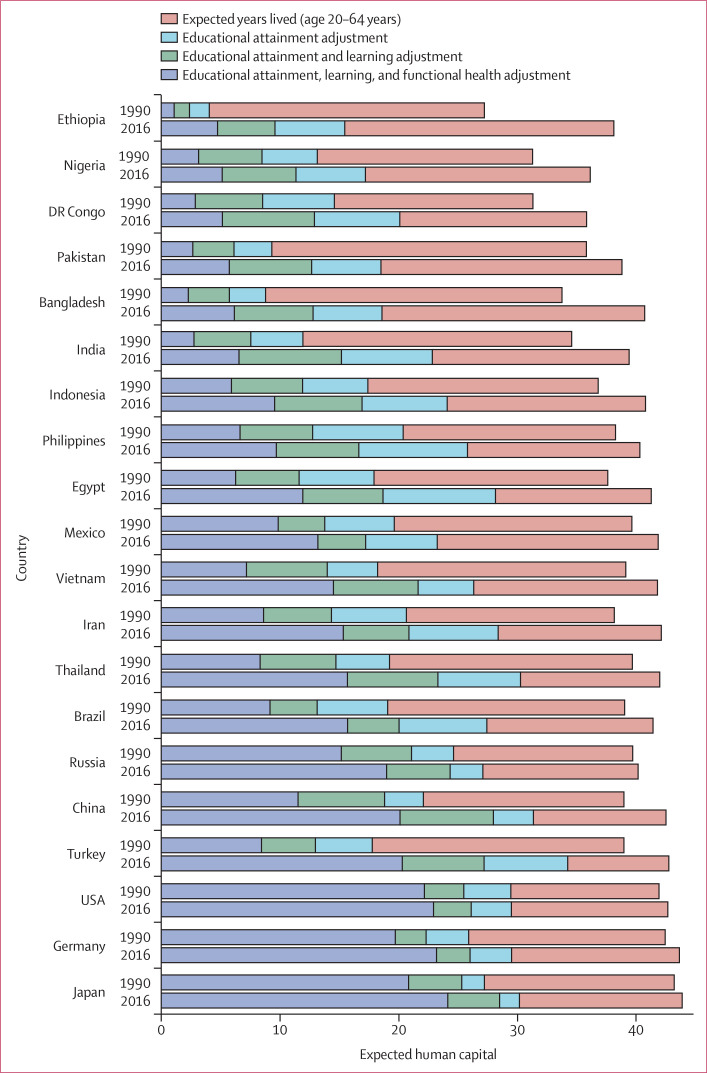
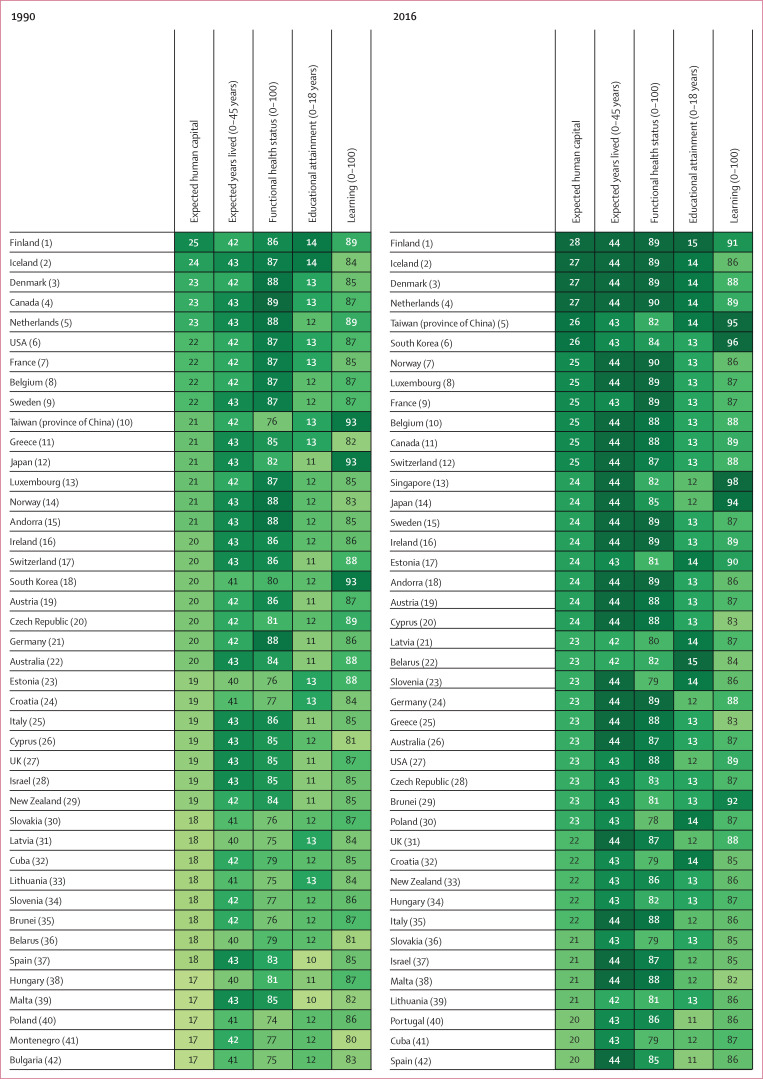
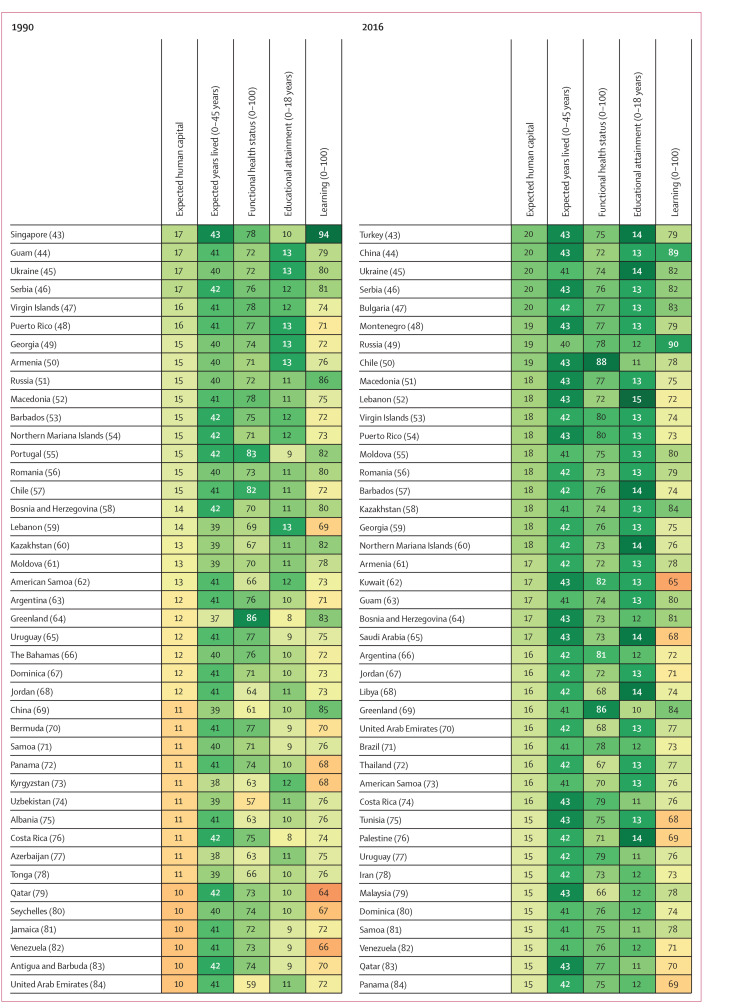
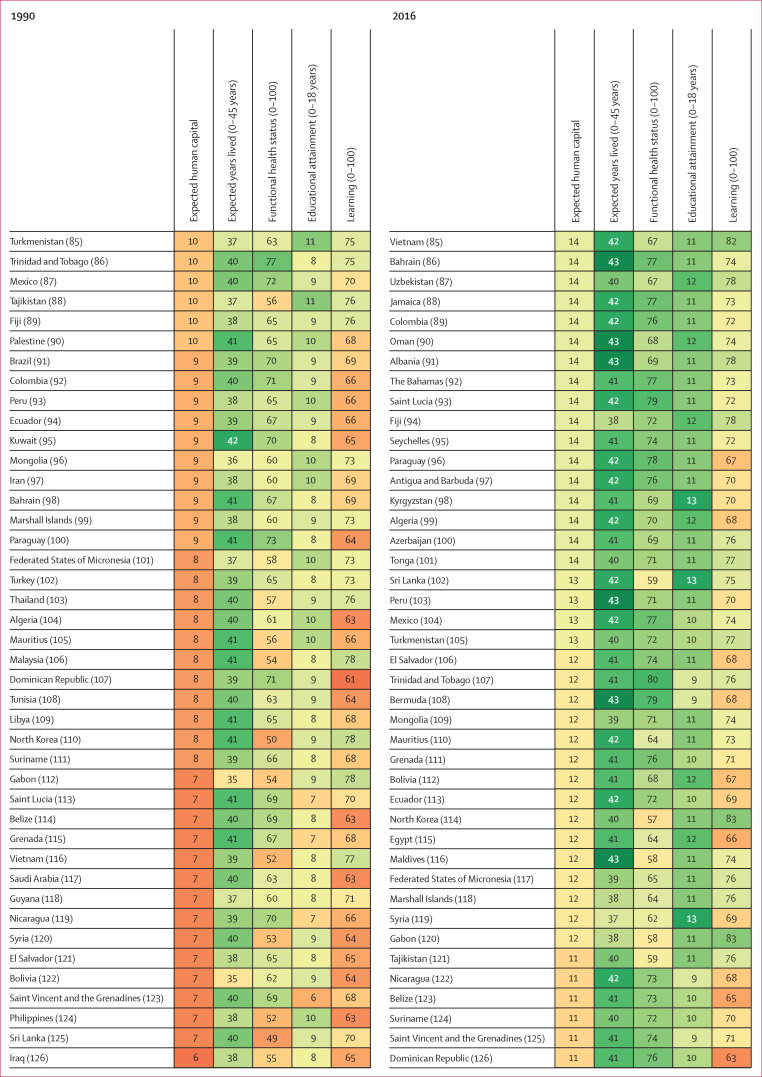
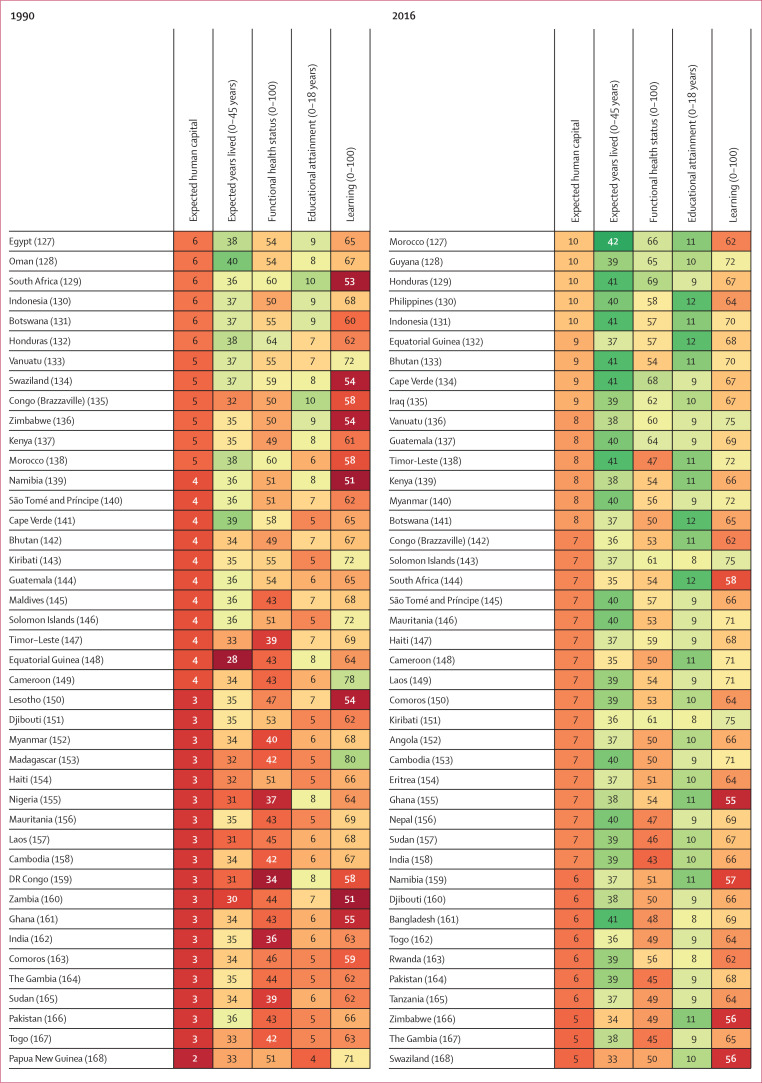
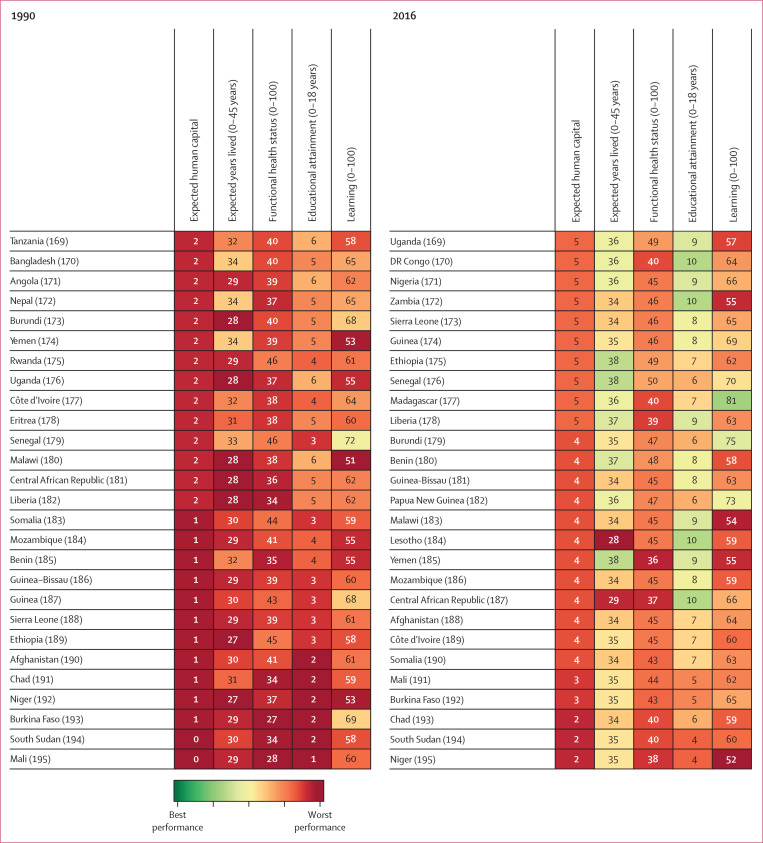
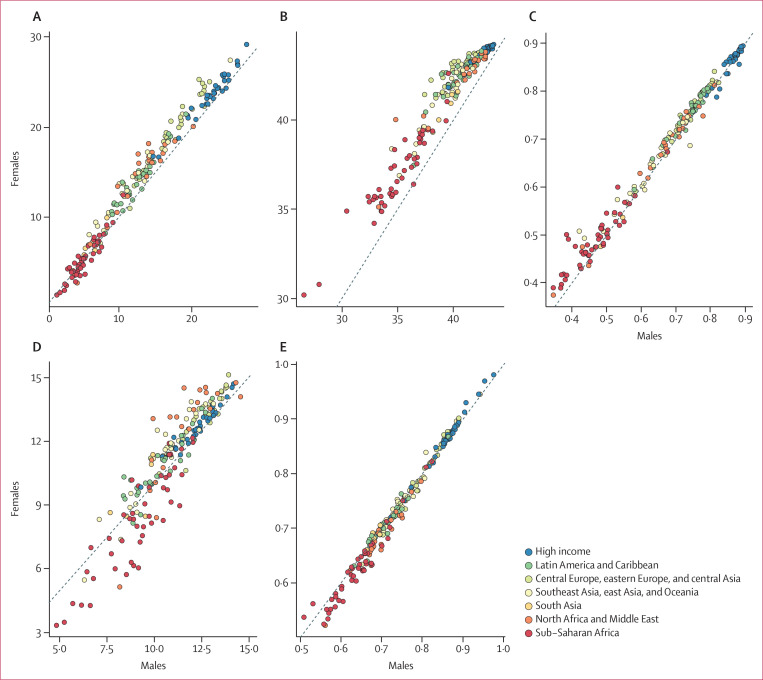
Methods: We generated a period measure of expected human capital, defined for each birth cohort as the expected years lived from age 20 to 64 years and adjusted for educational attainment, learning or education quality, and functional health status using rates specific to each time period, age, and sex for 195 countries from 1990 to 2016. We estimated educational attainment using 2522 censuses and household surveys; we based learning estimates on 1894 tests among school-aged children; and we based functional health status on the prevalence of seven health conditions, which were taken from the Global Burden of Diseases, Injuries, and Risk Factors Study 2016 (GBD 2016). Mortality rates specific to location, age, and sex were also taken from GBD 2016.
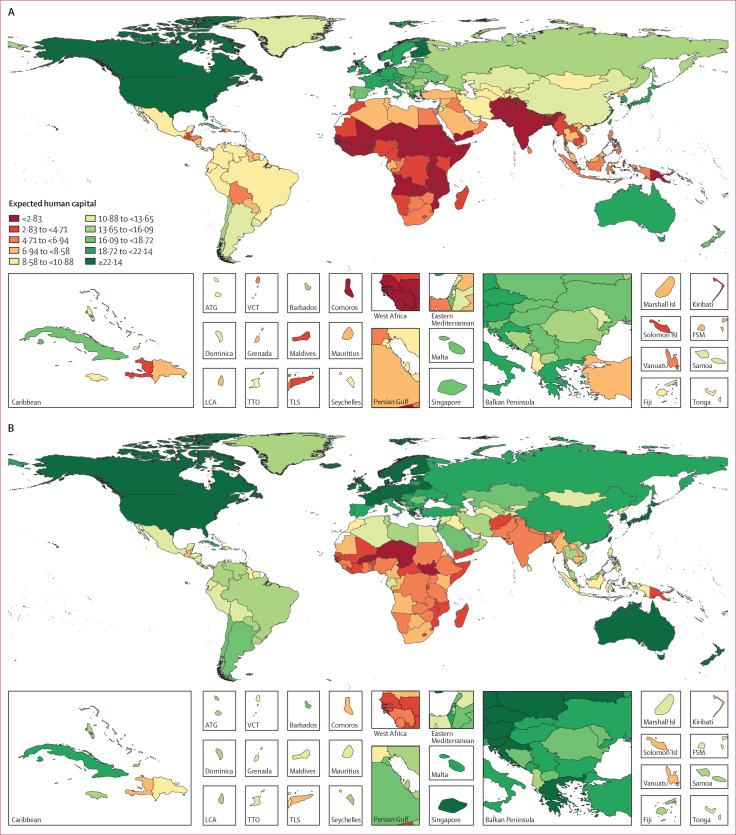
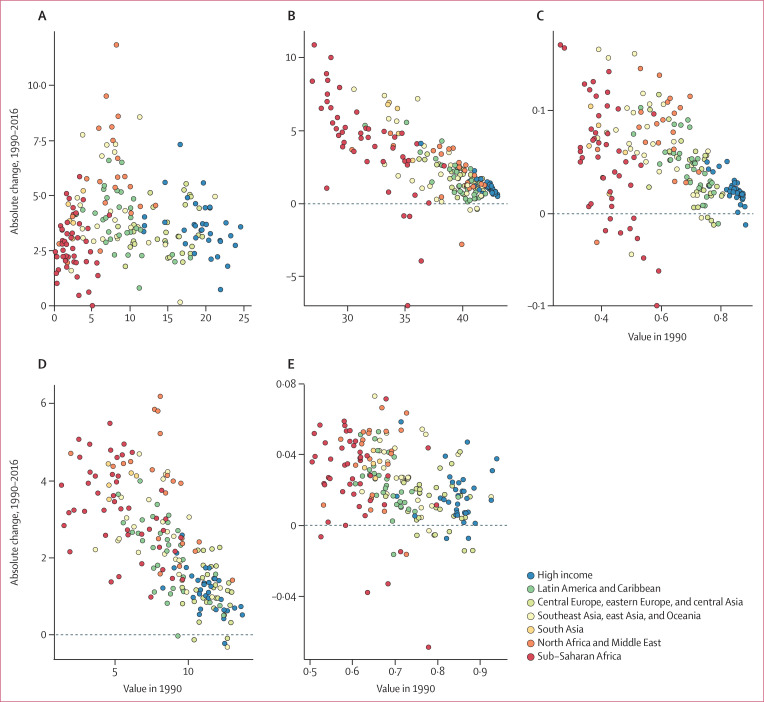
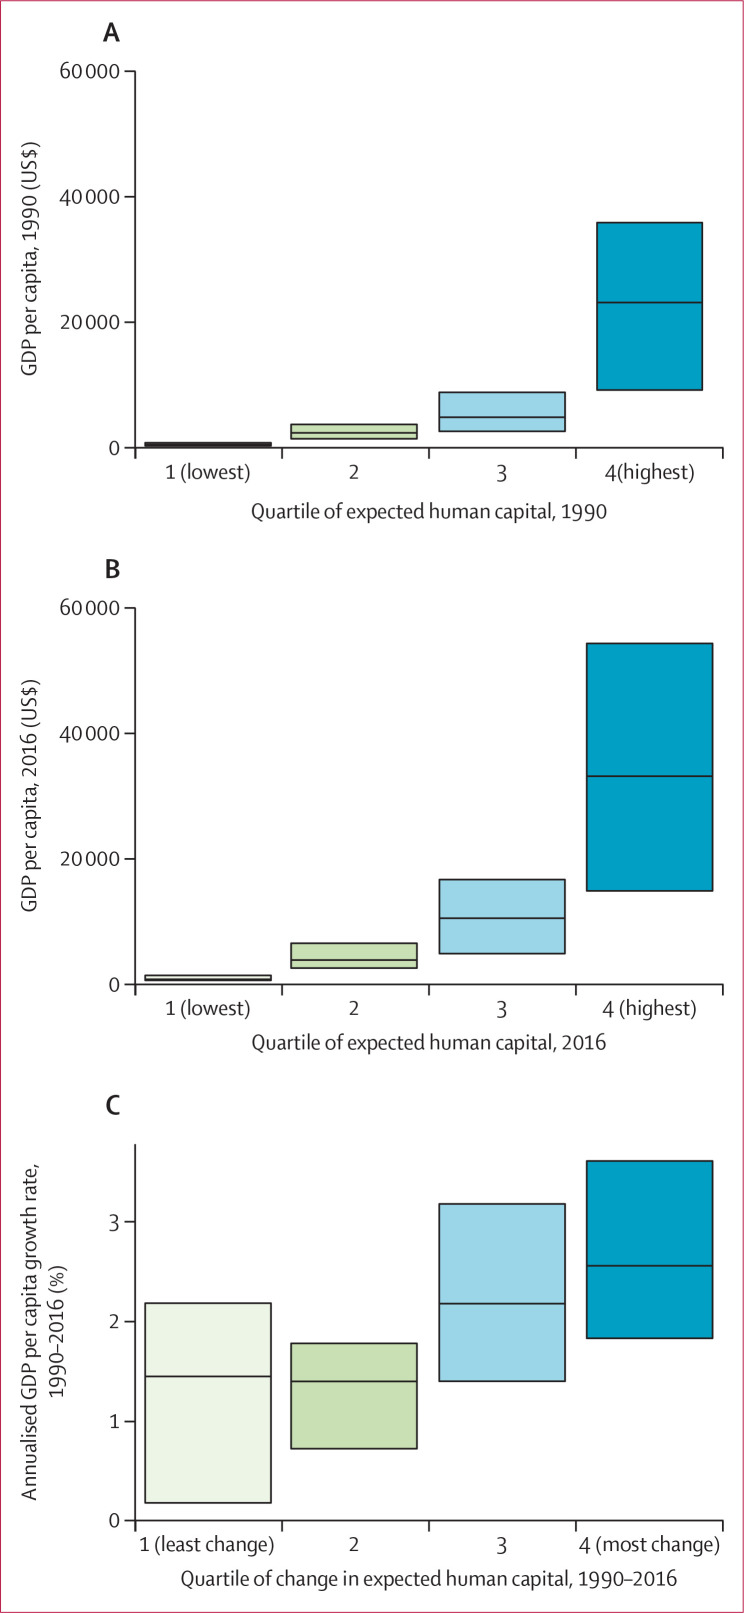
Findings: In 2016, Finland had the highest level of expected human capital of 28·4 health, education, and learning-adjusted expected years lived between age 20 and 64 years (95% uncertainty interval 27·5-29·2); Niger had the lowest expected human capital of less than 1·6 years (0·98-2·6). In 2016, 44 countries had already achieved more than 20 years of expected human capital; 68 countries had expected human capital of less than 10 years. Of 195 countries, the ten most populous countries in 2016 for expected human capital were ranked: China at 44, India at 158, USA at 27, Indonesia at 131, Brazil at 71, Pakistan at 164, Nigeria at 171, Bangladesh at 161, Russia at 49, and Mexico at 104. Assessment of change in expected human capital from 1990 to 2016 shows marked variation from less than 2 years of progress in 18 countries to more than 5 years of progress in 35 countries. Larger improvements in expected human capital appear to be associated with faster economic growth. The top quartile of countries in terms of absolute change in human capital from 1990 to 2016 had a median annualised growth in gross domestic product of 2·60% (IQR 1·85-3·69) compared with 1·45% (0·18-2·19) for countries in the bottom quartile.
Interpretation: Countries vary widely in the rate of human capital formation. Monitoring the production of human capital can facilitate a mechanism to hold governments and donors accountable for investments in health and education.
Funding: Institute for Health Metrics and Evaluation.
Copyright © 2018 The Author(s). Published by Elsevier Ltd. This is an Open Access article under the CC BY 4.0 license. Published by Elsevier Ltd.. All rights reserved.
Figures
References
-
- Becker GS. Human capital. Chicago, IL: University of Chicago Press, 1964.
-
- Schultz TW. Investment in human capital. Am Econ Rev 1961; 51: 1–17.
-
- Benhabib J, Spiegal MM.. The role of human capital in economic development evidence from aggregate cross-country data. J Monet Econ 1994; 34: 143–73.
-
- World Bank. Countries commit to strong action on human capital to drive economic growth. October 20, 2017. http://www.worldbank.org/en/news/feature/2017/10/20/countries-commit-to-... (accessed May 8, 2018).
-
- Kim JY. The human capital gap. Foreign Aff 2018; 92–102.
MeSH terms
LinkOut - more resources
Full Text Sources
Other Literature Sources
Medical
