. 2019 Feb;17(2):508-520.
doi: 10.1158/1541-7786.MCR-18-0557. Epub 2018 Sep 28.

RNA-Binding Protein HuR Regulates Both Mutant and Wild-Type IDH1 in IDH1-Mutated Cancer

Affiliations

RNA-Binding Protein HuR Regulates Both Mutant and Wild-Type IDH1 in IDH1-Mutated Cancer

Mahsa Zarei et al. Mol Cancer Res. 2019 Feb.

Abstract

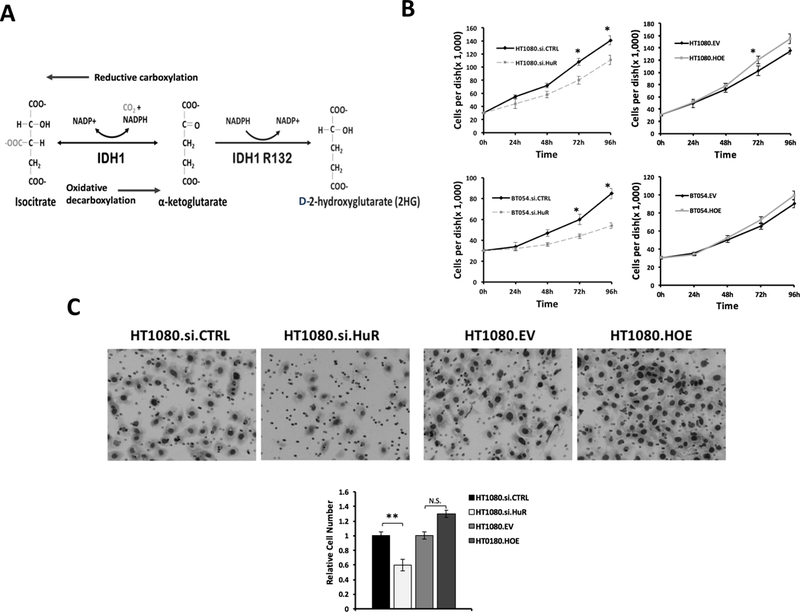
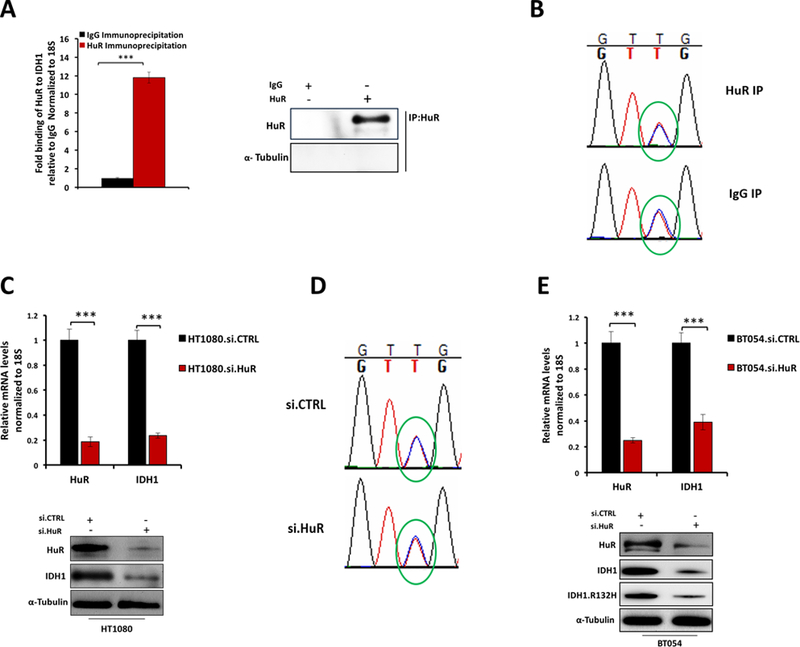
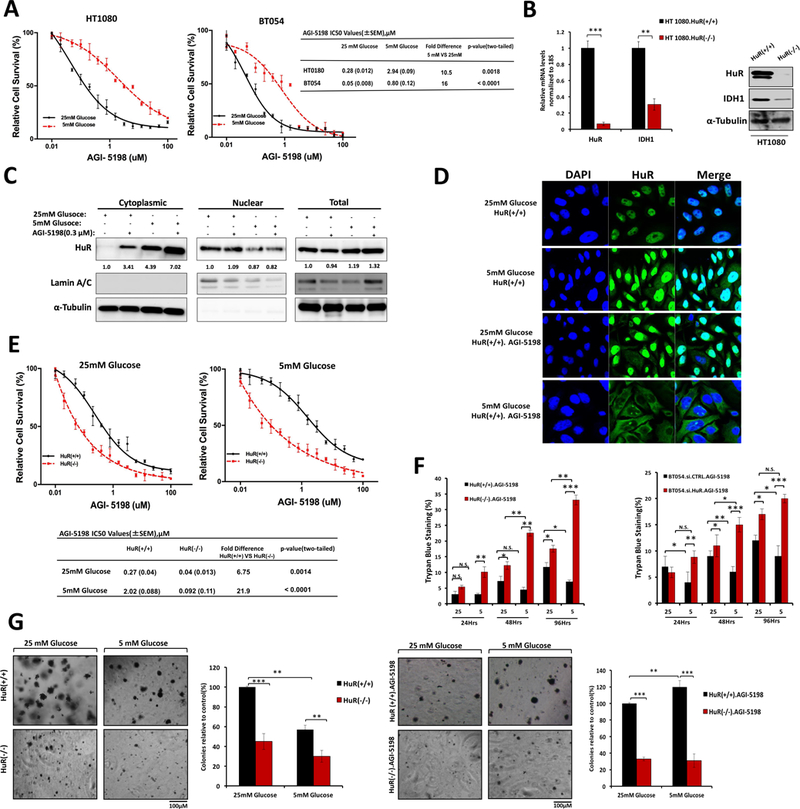
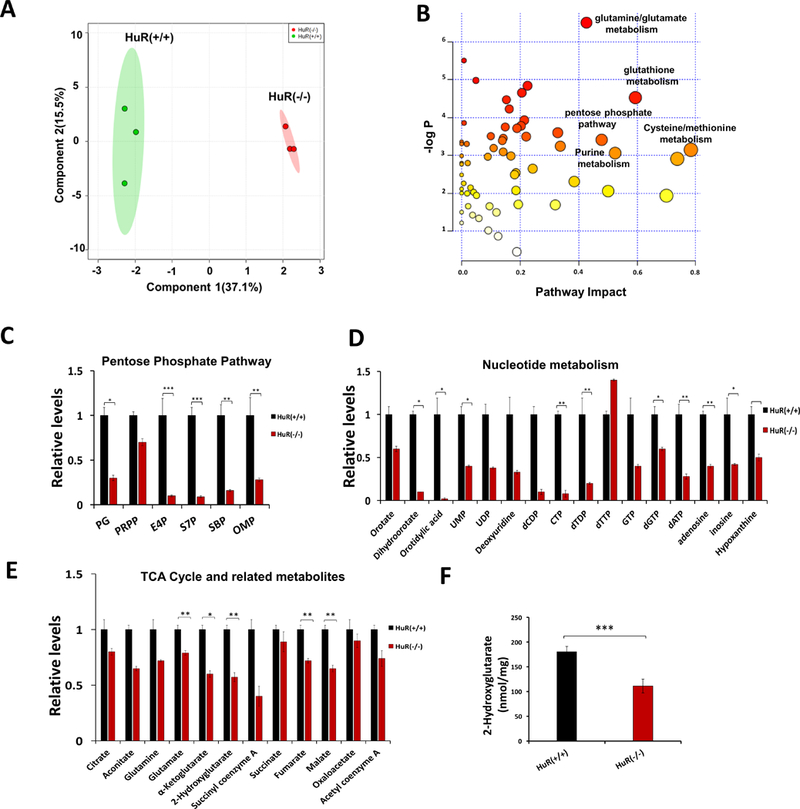
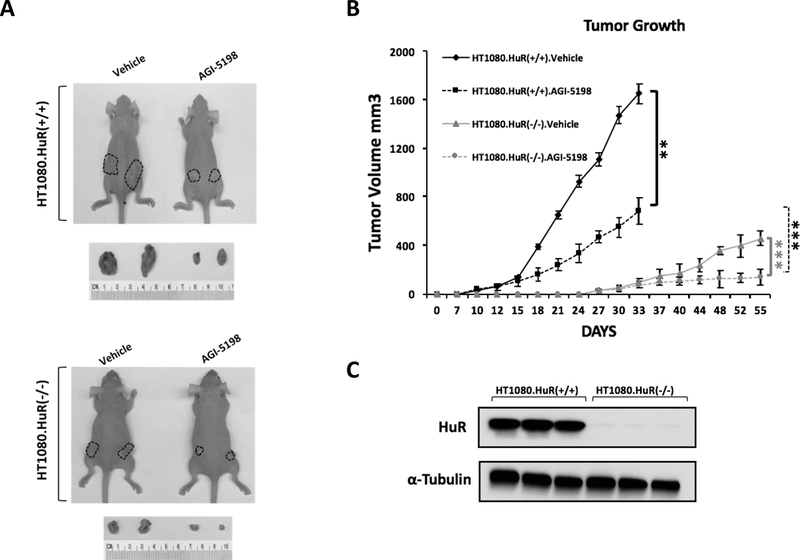
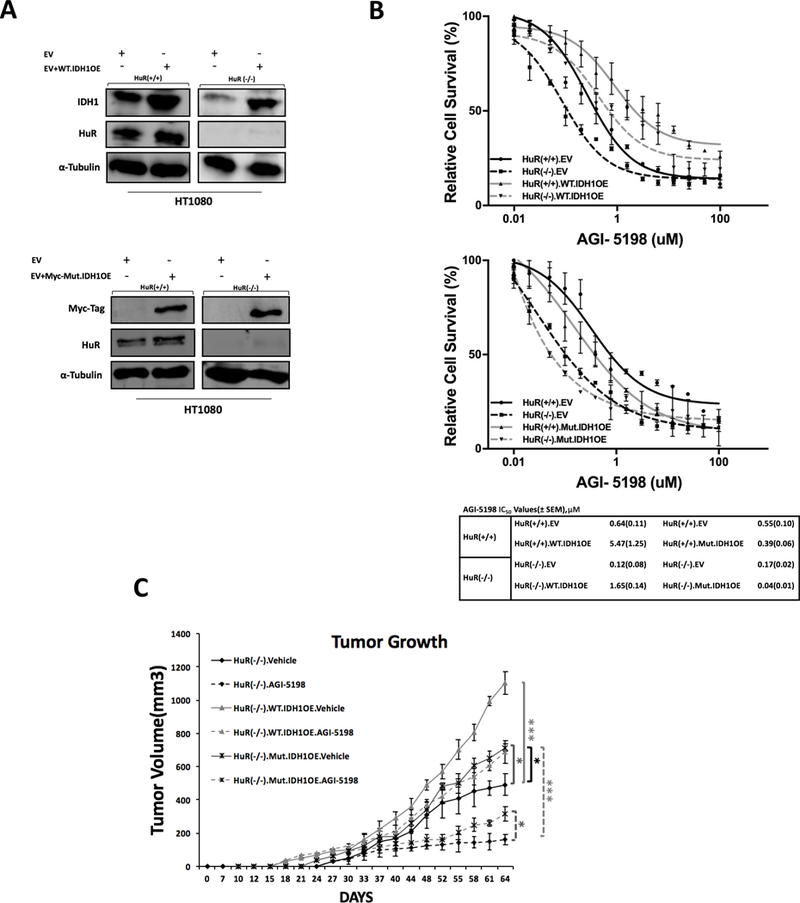
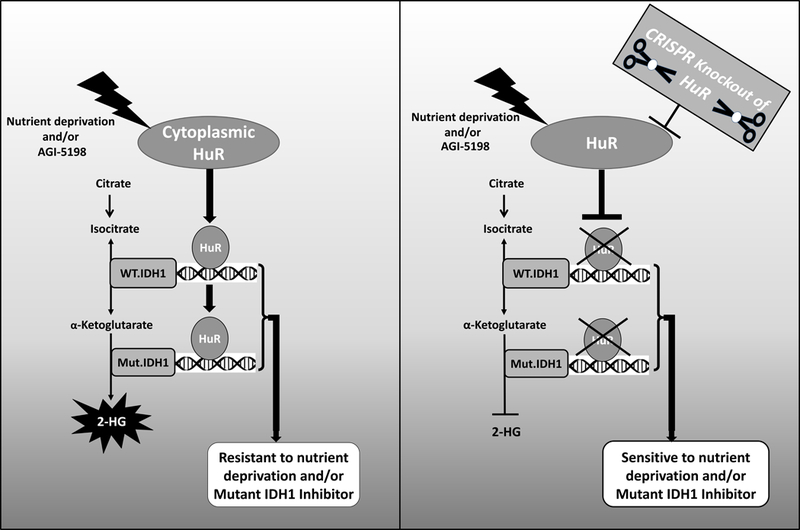
Isocitrate dehydrogenase 1 (IDH1) is the most commonly mutated metabolic enzyme in human malignancy. A heterozygous genetic alteration, arginine 132, promotes the conversion of α-ketoglutarate to D-2-hydroxyglutarate (2-HG). Although pharmacologic inhibitors of mutant IDH1 are promising, resistance mechanisms to targeted therapy are not understood. Additionally, the role of wild-type IDH1 (WT.IDH1) in cancer requires further study. Recently, it was observed that the regulatory RNA-binding protein, HuR (ELAVL1), protects nutrient-deprived cancer cells without IDH1 mutations, by stabilizing WT.IDH1 transcripts. In the present study, a similar regulatory effect on both mutant (Mut.IDH1) and WT.IDH1 transcripts in heterozygous IDH1-mutant tumors is observed. In ribonucleoprotein immunoprecipitation assays of IDH1-mutant cell lines, wild-type and mutant IDH1 mRNAs each bound to HuR. Both isoforms were profoundly downregulated at the mRNA and protein levels after genetic suppression of HuR (siRNAs or CRISPR deletion) in HT1080 (R132C IDH1 mutation) and BT054 cells (R132H). Proliferation and invasion were adversely affected after HuR suppression and metabolomic studies revealed a reduction in Pentose Phosphate Pathway metabolites, nucleotide precursors, and 2-HG levels. HuR-deficient cells were especially sensitive to stress, including low glucose conditions or a mutant IDH1 inhibitor (AGI-5198). IDH1-mutant cancer cells were rescued by WT.IDH1 overexpression to a greater extent than Mut.IDH1 overexpression under these conditions. This study reveals the importance of HuR's regulation of both mutant and wild-type IDH1 in tumors harboring a heterozygous IDH1 mutation with implications for therapy. IMPLICATIONS: This study highlights the HuR-IDH1 (mutant and wild-type IDH1) regulatory axis as a critical, actionable therapeutic target in IDH1-mutated cancer, and incomplete blockade of the entire HuR-IDH1 survival axis would likely diminish the efficacy of drugs that selectively target only the mutant isoenzyme.


Conflict of interest statement

Disclosure of Potential Conflicts of Interest: The authors have no conflicts of interest to disclose.

Figures

Figure 1:
Figure 1:. HuR is required for cell proliferation and invasion in IDH1 mutated cancer cells.
A, Schematic of the WT.IDH1 and Mut.IDH1 catalytic reaction. B, Cell growth (PicoGreen, dsDNA content) of HT1080 and BT054 after HuR knockdown (si.HuR) or overexpression (HOE) compared with control (si.CTRL or EV) for indicated time points. Each data point represents the mean of 5 independent experiments ± standard error of the mean (SEM). *, p < 0.05. C, Representative images of Matrigel invasion assays performed in HT1080 cells after HuR silencing (si.HuR) or overexpression (HOE). Cells that invaded through the Matrigel and onto the basal surface of transwell inserts were stained and photographed at 20X magnification. Quantification of cell number is represented by the bar graph. Data are presented as mean -fold change in invaded cells relative to si.CTRL or EV. Each bar represents the mean of 3 independent experiments ± SEM. N.S. non-significant; **, p < 0.005.
Figure 2:
Figure 2:. HuR inhibition down-regulates both wild type and mutant IDH1 expression.
A, mRNP-IP assay and qPCR for IDH1 of mRNAs bound to HuR protein, relative to IgG in HT1080 cells. Results were represented as means of three independent experiments ± SEM. B, Chromatograms show allelic ratios of wild type and mutant IDH1 by semi-quantitiative Sanger sequencing (overlapping red and blue peaks are circled) for HuR RNP-IP relative to IgG control. C, HT1080 cells were transfected with siRNAs against HuR (or control siRNA) and IDH1 mRNA expression was measured by qPCR (Top panel), Representative immunoblots are provided for HuR and IDH1 from HT1080 cell lysates 72 h following transfection with siRNA oligos. ***, p < 0.001. D, Chromatograms show allelic ratios of wild type and mutant IDH1 by semi-quantitiative Sanger sequencing (overlapping red and blue peaks are circled) after HuR silencing relative to si.CTRL. E, Representative qPCR analysis of HuR and IDH1 mRNA expression 48 h after transfection with si.CTRL or si.HuR in BT054 cells. (Top panel), Representative immunoblots for HuR, IDH1 and IDH1.R132H of BT054 cell lysates 72 h following transfection with siRNA oligos. ***, p < 0.001.
Figure 3:
Figure 3:. HuR inhibition sensitizes IDH1 mutant cells to a mutant IDH1 inhibitor, AGI-5198.
A, Cell viability (PicoGreen DNA quantitation) of Mut.IDH1 cell lines treated at the indicated doses of AGI-5198. IC50 values are provided. B, Representative qPCR analysis of HuR and IDH1 mRNA expression in HT1080.HuR(+/+) and HT1080.HuR(−/−) cells (HuR-knockout by CRISPR gene editing); representative immunoblots for HuR and IDH1 of HT1080.HuR(+/+) and HT1080.HuR(−/−) whole cell lysates, **P ≤ 0.01 and ***P ≤ 0.001. C, Immunoblot analysis of fractionated lysates from HT1080.HuR(+/+) cells upon glucose withdrawal, AGI-5198 treatment (0.3 μM), and a combination of both conditions for 24 hours. Lamin A/C and α-Tubulin were used as controls to determine the integrity of nuclear and cytosolic lysates respectively. D, Immunofluorescence demonstrates HuR subcellular localization to the cytoplasm (green cytoplasmic signal) in HT1080 cells upon glucose withdrawal, AGI-5198 treatment, and a combination of both conditions for 24 hours. Magnification 40×. E, Drug sensitivity measured by PicoGreen DNA quantitation, in HT1080 cells under the indicated culture conditions, and with varying doses of AGI-5198. IC50 values are provided. F, Trypan blue staining in HT1080 and BT054 cells after HuR silencing or CRISPR gene editing, cultured under high or low glucose conditions, with or without AGI-5198 treatment (0.3 μM). G, Long-term cell survival assessed by colony formation in soft agar. HT1080 cells were cultured under the indicated conditions. AGI-5198 was dosed at 0.3 μM for 4 weeks, as indicated. Each data point represents the mean ± SEM of three independent experiments. N.S. non-significant; * p < 0.05; ** p < 0.01; *** p < 0.001.
Figure 4:
Figure 4:. HuR inhibition induces metabolic alterations in mutant IDH1 cancer cells.
A, PLS-DA (partial least squares discriminant analysis) plot of metabolites generated from LC-MS/MS performed on HT1080.HuR(+/+) and HT1080.HuR(−/−) cells. B, Pathway enrichment analysis of metabolites from HT1080.HuR(+/+) and HT1080.HuR(−/−) cells. C, Relative levels of Pentose Phosphate Pathway metabolites from HT1080.HuR(+/+) and HT1080.HuR(−/−) cells. D, Relative levels of nucleotide metabolites from HT1080.HuR(+/+) and HT1080.HuR(−/−) cells. E, Relative levels of the Tricarboxylic acid cycle metabolites, including 2-HG (Hydroxyglutarate), from HT1080.HuR(+/+) and HT1080.HuR(−/−) cells, as measured by LC-MS/MS. F, 2-HG levels in HT1080.HuR(+/+) or HT1080.HuR(−/−) cells, as measured by a colorimetry-based method. Values represented are mean ± SEM. * p ≤ 0.05, ** p ≤ 0.01 and *** p ≤ 0.001.
Figure 5:
Figure 5:. HuR inhibition combined with mutant IDH1 inhibition by AGI-5198 suppresses tumor growth in vivo.
A, Mice were treated with vehicle or AGI-5198. Representative images of excised tumors of HT1080.HuR(+/+) and HT1080.HuR(−/−)(HuR-knockout by CRISPR gene editing) at the termination of the experiment (top panel, day 33; bottom panel, day 55). B, Tumor growth curves of HT1080.HuR(+/+) and HT1080.HuR(−/−) xenografts. Mice were treated with vehicle or AGI-5198. Each data point represents the mean ± SEM (n=8 per group). C, Representative immunoblots depict validation of HuR inhibition in HT1080.HuR(−/−) xenografts compared to HT1080.HuR(+/+) xenografts. Each data point represents the mean ± SEM of three independent experiments. ** p < 0.01; *** p < 0.001.
Figure 6:
Figure 6:. The ability of wild type and mutant IDH1 overexpression to rescue HT1080 cells treated with AGI-5198, in vitro and in vivo.
A, Immunoblots depict WT.IDH1 or Mut.IDH1 overexpression in HT1080.HuR(+/+) or HuR(−/−) knockout cell lines. B, PicoGreen drug sensitivity assays in HT1080 cells treated with AGI-5198. WT.IDH1 (top panel) or Mut.IDH1 (bottom panel) were stably overexpressed (or empty vector) in HT1080.HuR(−/−) and HT1080.HuR(+/+) cells. IC50 values are provided in table. C, Xenograft growth of HT1080.HuR(−/−) cells with stable overexpression of WT.IDH1 or MT.IDH1, treated with vehicle or AGI-5198. Each data point represents the mean ± SEM (n=8 per group). * p ≤ 0.05, ** p < 0.01; *** p < 0.001.
Figure 7:
Figure 7:
Schematic showing how HuR regulates resistance to glucose withdrawal and pharmacologic IDH1 inhibition through post-transcriptional regulation of both wild type and mutant IDH1 transcripts. The impact of HuR expression and targeting on resistance and susceptibility to these stressors is illustrated.

Similar articles

Cited by

References

    1. Siegel R, Ma J, Zou Z, Jemal A. Cancer statistics, 2014. CA Cancer J Clin. 2014;64(1):9–29. - PubMed
    1. Ohgaki H, Kleihues P. The definition of primary and secondary glioblastoma. Clin Cancer Res. 2013;19(4):764–72. - PubMed
    1. Parsons DW, Jones S, Zhang X, Lin JC, Leary RJ, Angenendt P, et al. An integrated genomic analysis of human glioblastoma multiforme. Science. 2008;321(5897):1807–12. - PMC - PubMed
    1. Dang L, White DW, Gross S, Bennett BD, Bittinger MA, Driggers EM, et al. Cancer-associated IDH1 mutations produce 2-hydroxyglutarate. Nature. 2009;462(7274):739–44. - PMC - PubMed
    1. Ward PS, Thompson CB. Metabolic reprogramming: a cancer hallmark even warburg did not anticipate. Cancer Cell. 2012;21(3):297–308. - PMC - PubMed

Publication types