. 2018 Nov 5;11(11):dmm034876.
doi: 10.1242/dmm.034876.

Generation of mouse-zebrafish hematopoietic tissue chimeric embryos for hematopoiesis and host-pathogen interaction studies

Affiliations

Generation of mouse-zebrafish hematopoietic tissue chimeric embryos for hematopoiesis and host-pathogen interaction studies

Margarita Parada-Kusz et al. Dis Model Mech. .

Abstract

Xenografts of the hematopoietic system are extremely useful as disease models and for translational research. Zebrafish xenografts have been widely used to monitor blood cancer cell dissemination and homing due to the optical clarity of embryos and larvae, which allow unrestricted in vivo visualization of migratory events. Here, we have developed a xenotransplantation technique that transiently generates hundreds of hematopoietic tissue chimeric embryos by transplanting murine bone marrow cells into zebrafish blastulae. In contrast to previous methods, this procedure allows mammalian cell integration into the fish developmental hematopoietic program, which results in chimeric animals containing distinct phenotypes of murine blood cells in both circulation and the hematopoietic niche. Murine cells in chimeric animals express antigens related to (i) hematopoietic stem and progenitor cells, (ii) active cell proliferation and (iii) myeloid cell lineages. We verified the utility of this method by monitoring zebrafish chimeras during development using in vivo non-invasive imaging to show novel murine cell behaviors, such as homing to primitive and definitive hematopoietic tissues, dynamic hematopoietic cell and hematopoietic niche interactions, and response to bacterial infection. Overall, transplantation into the zebrafish blastula provides a useful method that simplifies the generation of numerous chimeric animals and expands the range of murine cell behaviors that can be studied in zebrafish chimeras. In addition, integration of murine cells into the host hematopoietic system during development suggests highly conserved molecular mechanisms of hematopoiesis between zebrafish and mammals.This article has an associated First Person interview with the first author of the paper.

Keywords: Cell migration; Hematopoiesis; Host-pathogen interactions; Live imaging; Xenotransplantation; Zebrafish.


Conflict of interest statement

Competing interestsThe authors declare no competing or financial interests.

Figures

Fig. 1.
Fig. 1.
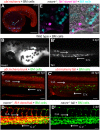
Generation of hematopoietic tissue chimeras by transplantation of mouse bone marrow cells into zebrafish blastulae. (A) Diagram of the experimental procedure. Mouse bone marrow cells are isolated, enriched for HSPCs by means of negative selection, blue fluorescently labeled and transplanted into the blastoderm of 3- to 5-hpf zebrafish embryos. (B) Representative epifluorescence images of the animal pole of zebrafish embryos showing 3 different levels of engraftment (+, low; ++, medium; +++, high). Scale bar: 100 µm. (C) Representative images of chimeric embryos showing mouse cells in the ICM at 1 dpf (left column), in the PBI and AGM at 2 dpf (middle column), and in the CHT at 3 dpf (right column). Asterisks indicate animals with cells circulating within the vasculature. Scale bar: 200 µm. (D) Pseudo-colored epifluorescence images of a global view of a xenotransplanted flk1:dsred fish at 3 dpf (mouse cells in blue; fish vasculature in magenta). Individual images from fish head, trunk and tail were joined to create a whole-embryo high-magnification image. Scale bar: 200 µm. (E) Pseudo-colored z-stack confocal image of the tail region of a xenotransplanted flk1:dsred fish at 3 dpf. Scale bar: 50 µm. BF, bright field; BM cells, mouse bone marrow cells.
Fig. 2.
Fig. 2.
Transplantation procedure description and quantification. (A) Diagram of the transplantation process for a single microinjection needle (upper panel). Red dashed line represents the tip braking site. The table shows representative quantification data of mouse cells per injection for 3 different needles over time (lower panel). Data present the mean±s.d. obtained from duplicate injections. (B) Gating strategy for quantification of mouse cells in chimeric embryos. Murine cells were viable/blue violet+/CD45+ gated (R3 events, i.e., CD45+/blue violet+ cells). P1, cells; R2, viable cells. (C) Correlation between transplanted mouse cells versus engrafted mouse cells in 2-dpf embryos. Blastulae were injected with a range of ∼1000-6000 cells and the mean number of engrafted cells was determined by flow cytometry (viable/blue violet+/CD45+ gated). The mean number of mouse cells per larvae was determined from selected animals representing each of the 3 engraftment categories (+, low; ++, medium; +++, high). Mean±s.e.m. for transplantation variability (horizontal bars) and engraftment variability (vertical bars). N=3 replicates of 3 animals per engraftment category. Linear regression Pearson correlation r=0.9472, R square=0.8971, two-tailed P-value=0.0528. (D) Quantification of mouse cell numbers in 2-dpf individual embryos. Animals were transplanted with ∼4000 cells and individual whole-body cell suspensions were prepared for 6 selected animals from the engraftment levels ++ and +++. The number of mouse cells was determined by flow cytometry (viable/blue violet+/CD45+ gated). (E) Quantification of mouse cells in the tail region of chimeric animals by epifluorescence microscopy. Animals were transplanted with ∼2000 cells and animals representing the 3 levels of engraftment were analyzed. Numbers in parenthesis represent numbers of animals analyzed at each day post-fertilization. Results are representative of 2 independent experiments. (F) Quantification of murine cells in the tail region of 7 representative individual animals at the indicated days post-fertilization by epifluorescence microscopy. From this analysis, 12/20 animals presented a peak of colonization at 2 dpf. Results are representative of 2 independent experiments. (G) Quantification of total mouse cells in chimeric animals at the indicated days post-fertilization. Animals were transplanted with ∼2000 cells (blue line) or ∼3500 cells (red line) and whole-body cell suspensions from groups of 20 animals representing the 3 levels of engraftment were analyzed by flow cytometry (viable/blue violet+/CD45+ gated).
Fig. 3.
Fig. 3.
Transplantation of mouse cells into zebrafish blastulae does not result in cell fusion events or vital dye transfer. (A) Mouse bone marrow cells (UBI-GFP) were blue-labeled and transplanted into ubi:mcherry transgenic zebrafish blastulae. Confocal images from an 8-hpf (left panel) and a 20-hpf (right panel) transplanted embryo show no triple-labeled cells (red, green and blue; white emission). Scale bar: 250 µm. (B) At 2 dpf, 12 transplanted embryos were selected and a whole-embryo cell suspension was prepared and analyzed by flow cytometry. Contour plot of the physical parameters identified by forward and side scatter show back-gated mouse bone marrow cells (green events) and fish cells (gray events). (C-E) Contour plots from color-based analysis show (C) 0.017% of events as GFP+ and mCherry+, (D) 0.45% of events as blue violet+ cells and mCherry+, and (E) the majority of GFP+ events as blue violet+. (F) mCherry+ histogram plot of blue violet+/GFP+ pre-gated events (red arrow in E) showing 0.87% of triple-labeled cells. (G) Mouse bone marrow cells (UBI-GFP) were blue-labeled and transplanted into ubi:mcherry transgenic zebrafish blastulae. Confocal z-stack image of the fish PBI showing macrophage (red labeled) internalization of mouse blue+/GFP− cells (white arrows). Asterisk indicates a double blue- and green-labeled cell (cyan). Scale bar: 20 μm. (H) Confocal pseudo-colored z-stack image of the fish PBI from an mpx:gfp fish transplanted with blue-labeled mouse bone marrow cells showing activated neutrophil cells (green labeled, white arrows) around mouse cells. Scale bar: 20 μm. BM cells: mouse bone marrow cells.
Fig. 4.
Fig. 4.
Engrafted murine cells in chimeric animals include hematopoietic progenitors and myeloid lineage cells. Mouse bone marrow cells were blue-labeled and transplanted into zebrafish blastulae. At 2 dpf, 100 chimeric animals were selected, and a whole-embryo cell suspension was prepared and analyzed by flow cytometry. Representative contour plots from color-based analysis show (A) 77% of viable/blue violet+/CD45+ events as Gr1+, (B) 33% as c-kit+, (C) 5% of events as CD11b/F4-80+, (D) 2% of events as Ter-119+ and (E) less than 1% of events as CD3+/CD19+. (F) Table summarizing mouse cell phenotypes in chimeric animals at 2 dpf. Results are representative from 2 independent experiments consisting of 3 biological replicates.
Fig. 5.
Fig. 5.
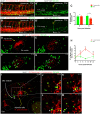
Live imaging of chimeric zebrafish embryos and larvae shows migration and behavior of mouse bone marrow cells. (A) Single-slice confocal image obtained from a 13-h time-lapse sequence that shows mouse bone marrow (BM) cells migrating along the route of endogenous primitive macrophages. Arrow depicts cell migration direction over the yolk sac (see Movie 1). Scale bar: 200 μm. (B,B′) Epifluorescence images obtained from a time-lapse sequence that show white-colored mouse cells circulating within the (B) fish head and (B′) tail vasculature (see Movie 2). Scale bar: 250 μm. (C,C′) Single-slice confocal images from a time-lapse sequence showing UBI-GFP transgenic mouse cells (green) interacting with fish endothelial cells within (C) the fish trunk dorsal aorta and axial vein, and (C′) the tail caudal aorta and caudal vein in an ubi:mcherry fish (see Movies 3 and 4). Scale bars: 50 μm. (D,D′) Pseudo-colored confocal images captured from a 1.5-h time-lapse sequence showing green mouse cell dynamics within the fish caudal hematopoietic tissue in a vasculature reporter flk1:dsred animal. Panel D′ is the green channel of panel D (see Movie 5). Scale bar: 50 μm. (E) Single-slice pseudo-colored confocal image from a time-lapse sequence that shows individual mouse cell (cyan) dynamics at high magnification inside the fish CHT in a flk1:dsred animal (see Movie 6). Scale bar: 10 μm. C.A., caudal aorta; C.V., caudal vein; D.A., dorsal aorta; A.V., axial vein. White arrows in B′-D′ depict fish blood flow direction.
Fig. 6.
Fig. 6.
Transplanted mouse cells respond to a bacterial infection in zebrafish. Pseudo-colored confocal images from a time-lapse sequence of xenotransplanted flk1:dsred fish infected with K. pneumoniae. Endothelial cells are red-labeled, mouse cells are green-labeled and bacteria are red-labeled. (A-B′) Images acquired right after (A,A′; 0 hpi) or 5 h after (B,B′; 5 hpi) intramuscular infection with ∼100 cfu of K. pneumoniae. (A′,B′) Green channel reveals depletion of mouse cells in the CHT at 5 hpi (see Movie 7). Scale bars: 50 μm. (C) Quantification of the CHT-resident mouse cells before and after 5 h of a tail-muscle infection with K. pneumoniae. N=10 animals per condition. Statistical significance was analyzed by a two-tailed unpaired Student's t-test. (D-G) Confocal images captured from a time-lapse sequence centered on the otic vesicle of a fish infected with ∼500 cfu of K. pneumoniae. White arrows indicate infiltrating murine cells (see Movie 8). (H) Quantification of the otic-vesicle-resident mouse cells at the indicated time points after an infection with ∼500 cfu of K. pneumoniae. N=10 animals per condition. Statistical significance was analyzed by a two-way ANOVA with Bonferroni post-test (P≤0.001). (I) Confocal image captured from a high-resolution time-lapse sequence centered on the otic vesicle of a fish infected with ∼500 cfu of K. pneumoniae. Scale bar: 20 μm. (J-M) Enlarged images showing the interaction of a single mouse cell (asterisk) with bacteria (arrow) that was tracked during the indicated times; the mouse cell containing bacteria later migrates away from the infection site (see Movie 9). Scale bars: 10 μm. C.A., caudal aorta; C.V., caudal vein; v, otic vesicle vasculature; cfu, colony-forming units; hpi, hours post-infection. White arrows in A-B′ depict fish blood flow direction. Yellow arrows in images depict the bacterial microinjection site.

Similar articles

Cited by

References

    1. Alvarez M., Reynaert N., Chávez M. N., Aedo G., Araya F., Hopfner U., Fernández J., Allende M. L. and Egaña J. T. (2015). Generation of viable plant-vertebrate chimeras. PLoS ONE 10, e0130295 10.1371/journal.pone.0130295 - DOI - PMC - PubMed
    1. Avraham R., Haseley N., Brown D., Penaranda C., Jijon H. B., Trombetta J. J., Satija R., Shalek A. K., Xavier R. J., Regev A. et al. (2015). Pathogen cell-to-cell variability drives heterogeneity in host immune responses. Cell 162, 1309-1321. 10.1016/j.cell.2015.08.027 - DOI - PMC - PubMed
    1. Beltman J. B., Marée A. F. M. and de Boer R. J. (2009). Analysing immune cell migration. Nat. Rev. Immunol. 9, 789-798. 10.1038/nri2638 - DOI - PubMed
    1. Bertrand J. Y., Kim A. D., Teng S. and Traver D. (2008). CD41+ cmyb+ precursors colonize the zebrafish pronephros by a novel migration route to initiate adult hematopoiesis. Development 135, 1853-1862. 10.1242/dev.015297 - DOI - PMC - PubMed
    1. Corkery D. P., Dellaire G. and Berman J. N. (2011). Leukaemia xenotransplantation in zebrafish-chemotherapy response assay in vivo. Br. J. Haematol. 153, 786-789. 10.1111/j.1365-2141.2011.08661.x - DOI - PubMed

Publication types

MeSH terms

Substances

LinkOut - more resources