. 2019 Jan;9(1):46-63.
doi: 10.1158/2159-8290.CD-17-1152. Epub 2018 Sep 28.

Genome-Informed Targeted Therapy for Osteosarcoma

Affiliations

Genome-Informed Targeted Therapy for Osteosarcoma

Leanne C Sayles et al. Cancer Discov. 2019 Jan.

Abstract

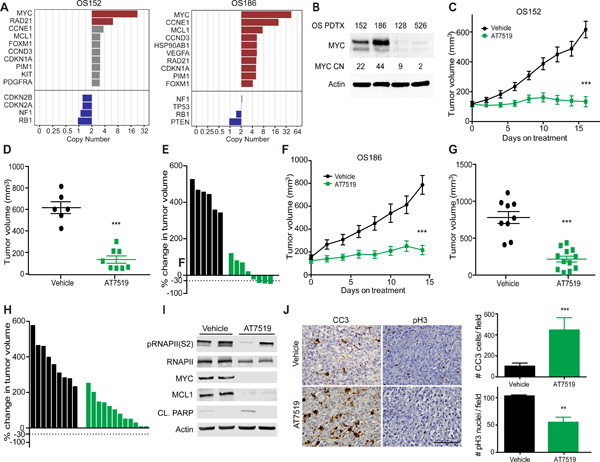
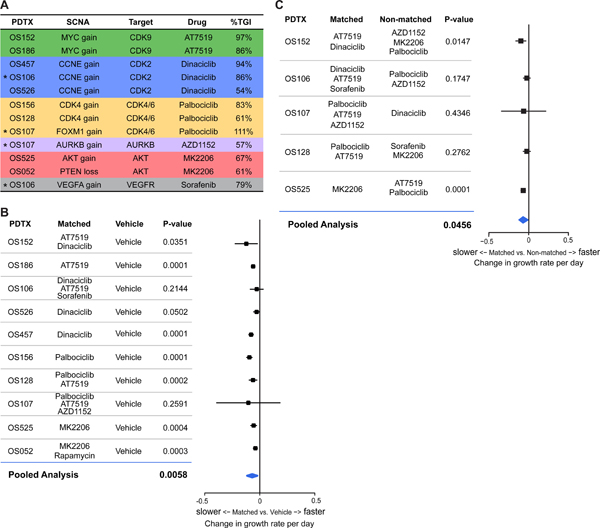
Osteosarcoma is a highly aggressive cancer for which treatment has remained essentially unchanged for more than 30 years. Osteosarcoma is characterized by widespread and recurrent somatic copy-number alterations (SCNA) and structural rearrangements. In contrast, few recurrent point mutations in protein-coding genes have been identified, suggesting that genes within SCNAs are key oncogenic drivers in this disease. SCNAs and structural rearrangements are highly heterogeneous across osteosarcoma cases, suggesting the need for a genome-informed approach to targeted therapy. To identify patient-specific candidate drivers, we used a simple heuristic based on degree and rank order of copy-number amplification (identified by whole-genome sequencing) and changes in gene expression as identified by RNA sequencing. Using patient-derived tumor xenografts, we demonstrate that targeting of patient-specific SCNAs leads to significant decrease in tumor burden, providing a road map for genome-informed treatment of osteosarcoma. SIGNIFICANCE: Osteosarcoma is treated with a chemotherapy regimen established 30 years ago. Although osteosarcoma is genomically complex, we hypothesized that tumor-specific dependencies could be identified within SCNAs. Using patient-derived tumor xenografts, we found a high degree of response for "genome-matched" therapies, demonstrating the utility of a targeted genome-informed approach.This article is highlighted in the In This Issue feature, p. 1.


Conflict of interest statement

The authors declare no potential conflicts of interest.

Figures

Figure 1.
Figure 1.. Genomic analysis of OS and identification of recurrent SCNAs in primary tumors.
A, Circos plot for indicated sample. Copy number gain and losses (outer most circle, red and blue respectively), loss of heterozygosity (intermediate circle) and structural alterations (inner arcs) are shown. B-C, Genome-wide SCNA plot for diagnostic and resection samples from the same patient. D, Analysis of alterations across a cohort of 63 samples from 54 patients in actionable and druggable genes. Copy number (CN) gain was classified as >4 copies, >8 copies, or >12 copies. Actionable genes where at least two patients have gains of >8 copies were included in the upper panel. Selected genes of interest (AKT1 and FOXM1) were also included. Losses for selected tumor suppressor genes (TSG) were calculated and classified as <1.2 copies (minor) or <0.8 copies (major) and included in the lower panel. SV truncations, gene-fusions, and SNVs were calculated and included as indicated. Genes contained in segments with different CN states are annotated as a breakpoint (CNA). Upper bar plot summarizes the CN gain/loss per sample. Right bar plot summarizes the CN gain/loss for a gene. Each column represents a single sample. Numbers to the left indicate percentage of alteration across patients (samples derived from the same patient were aggregated). In the upper panel, only gains were included in the alteration percentages. For tumor suppressors, losses, SV and SNVs were included. Purity estimates for each sample were calculated and all CN gain/losses were adjusted accordingly. The genome-wide tumor mutation burden (TMB) was also calculated for each sample with a matched germline (number of variants across the genome per megabase). Samples collected from the same patient are labelled with the same letter in the “multi-sample” row. E, Combined genome-wide SCNA across all patients in the cohort (samples derived from multiple samples were combined). Percentages are of patients with gains and/or losses in 10kb bins tiled across the genome. Gain/loss calculated and annotated as above. The loci of selected genes of interest are shown.
Figure 2.
Figure 2.. Genomic analysis of OS PDTX models and comparison to primary tumors.
A, Scatter plots comparing SCNA changes in representative primary tumor vs. PDTX pairs. CN represented as the normalized log2 ratio between somatic and germline samples. All protein-coding genes shown with actionable and druggable genes in red. B, Correlation matrix of copy-number across primary tumor vs exact matched PDTX pairs (all protein-coding genes). For all samples, the PDTX sample correlated best with the matched primary tumor. C, Genomic alterations across all PDTX samples for recurrent genes shown in Fig. 1B and other gene targets tested in PDTX models. All samples annotated and alterations calculated as in Fig 1B. SCNAs targeted and tested in this study indicated with a white diamond. PDTXs derived from two separate samples from the same patient is indicated in the multi-sample row (letter matched with Fig. 1B). The relationship of the PDTX and the related primary tissue is shown. The companion primary tissue was from the exact tissue used for PDTX generation in all cases but one where a different stage primary tissue was used. In four instances, a comparable primary tissue was unavailable. D, CN for genes tested in this study for PDTX and exact matched primary samples. Additional primary and PDTX passages for selected samples also shown. PDTX samples indicated with (*), PDTX samples from additional passages indicated with (**). E, Schema for proposed treatment subclasses.
Figure 3.
Figure 3.. MYC amplified patient xenografts respond to CDK inhibition.
A, Rank ordered list of SCNA identified 2 PDTX with MYC amplification. B, Western blot across PDTX with varying copy number (CN) for MYC. C, Growth curve for MYC amplified PDTX (OS152) treated with AT7519 compared to vehicle control. D, individual tumor volume at last time point in C, p<0.0001. Error bars, SEM. E, Waterfall plot of individual tumors in C. F, MYC amplified PDTX (OS186) treated with AT7519 compared to vehicle control. G, Individual tumor volume at last time point in F, p<0.0001. Error bars, SEM. H, Waterfall plot of individual tumors in F. I, Western blot of short term treated tumors OS152 PDTX, 4 doses of drug and sacrifice 4 hrs. after last. J, Representative IHC and quantitation of OS152 (10X FOV) after short term treatment for CC3 as a measure of apoptosis, p=0.0006 and proliferation at end of study as measured by pH3 and quantitation, p=0.003. Statistics calculated by student’s t test. Error bars, SD. Scale bar represents 100uM.
Figure 4.
Figure 4.. CDK4 and FOXM1 amplified PDTX respond to Palbociclib treatment.
A, Rank order of SCNA gains and losses in PDTX OS156 (left) and OS128 (right). B, Western blot of PDTX with various copy number (CN) for CDK4. C, CDK4 amplified PDTX (OS156) growth curve treated with Palbociclib compared to vehicle. D, Individual tumor volume at end of study in C, p<0.0001. Error bars, SEM. E, Waterfall plot of individual tumors in C. F, PDTX (OS128) growth curve treated with Palbociclib compared to vehicle. G, Individual tumor volume at end of study in F, p=0.0035. Error bars, SEM. H, Waterfall plots of individual tumors in F. I, Western blot of short term treated tumors from OS156 with Palbociclib for 3 days. J, IHC of PDTX OS156 short term treated tumors for CC3 and quantitation (per 10X FOV), p=0.02, and at end of study for pH3 and quantitation (per 10X FOV), p=0.002. Error bars, SD. Scale bar represents 100uM. K, Rank ordered gene list of SCNA gains and losses for PDTX OS107. L, Western blot of PDTX with various copy number (CN) for FOXM1. M, OS107 PDTX growth curve treated with Palbociclib, tumor volume at treatment day 14 p<0.0001. N, Tumor volume at day 14 of treatment in m, p<0.0001. Error bars, SEM. O, Waterfall plot at 14 and 28 days of treatment from M. P, Western blot of PDTX OS107 short term treated tumors with Palbociclib compared to vehicle.
Figure 5.
Figure 5.. AKT/PTEN pathway alterations responds to MK2206.
A, Rank ordered SCNA of gains and losses for OS525 (left) and OS052 (right). B, Western blot for PTDX with altered copy number (CN) for PTEN and AKT. C, PTEN loss PDTX (OS052) treated with MK2206. D, Individual tumor volume at last time point in C, p=0.005. Error bars, SEM. E, Waterfall plot of individual tumors in C. F, AKT1 gain PDTX (OS525) treated with MK2206. G, Individual tumor volume at end of study in F, p=0.004. Error bars, SEM. H, Waterfall plots of individual tumors in F. I, Western blot of PDTX OS525 (AKT gain PDTX) short term treatment of MK2206, 2 doses (M,W) and sac 12 hrs after last dose. J, IHC of CC3 short term treatment and quantitation of OS525, (per 10X FOV) p=0.015 and pH3 at end of study and quantitation (10X FOV) p=0.023. Error bars, SD. Scale bar represent 100uM.
Figure 6.
Figure 6.. Specificity of targeted therapies based on SCNA.
A, Calculations of Tumor Growth Inhibition (%TGI) per PDTX and genome matched targeted therapy tested for 10 PDTX and 12 targeted therapies. *indicate PTDX that have multiple “matched” targeted therapies tested. B, Forest plot of mixed effects model and pooled analysis calculation of growth rate of matched v. vehicle (p=0.0058) of 10 PDTX tested. C, Forest plot of mixed effects model and pooled analysis calculation of growth rate of matched v. non-matched (p=0.0456) of 5 PDTX.

References

    1. Mirabello L, Troisi RJ & Savage SA International osteosarcoma incidence patterns in children and adolescents, middle ages and elderly persons. Int J Cancer 125, 229–234, doi:10.1002/ijc.24320 (2009). - DOI - PMC - PubMed
    1. Meyers PA et al. Osteogenic sarcoma with clinically detectable metastasis at initial presentation. J Clin Oncol 11, 449–453, doi:10.1200/JCO.1993.11.3.449 (1993). - DOI - PubMed
    1. Kager L. et al. Primary metastatic osteosarcoma: presentation and outcome of patients treated on neoadjuvant Cooperative Osteosarcoma Study Group protocols. J Clin Oncol 21, 2011–2018, doi:10.1200/JCO.2003.08.132 (2003). - DOI - PubMed
    1. Marina NM et al. Comparison of MAPIE versus MAP in patients with a poor response to preoperative chemotherapy for newly diagnosed high-grade osteosarcoma (EURAMOS-1): an open-label, international, randomised controlled trial. Lancet Oncol 17, 1396–1408, doi:10.1016/S1470-2045(16)30214-5 (2016). - DOI - PMC - PubMed
    1. Behjati S. et al. Recurrent mutation of IGF signalling genes and distinct patterns of genomic rearrangement in osteosarcoma. Nat Commun 8, 15936, doi:10.1038/ncomms15936 (2017). - DOI - PMC - PubMed

Publication types