

Chemical genetic identification of CDKL5 substrates reveals its role in neuronal microtubule dynamics
- PMID: 30266824
- PMCID: PMC6293278
- DOI: 10.15252/embj.201899763
Chemical genetic identification of CDKL5 substrates reveals its role in neuronal microtubule dynamics
Abstract
Loss-of-function mutations in CDKL5 kinase cause severe neurodevelopmental delay and early-onset seizures. Identification of CDKL5 substrates is key to understanding its function. Using chemical genetics, we found that CDKL5 phosphorylates three microtubule-associated proteins: MAP1S, EB2 and ARHGEF2, and determined the phosphorylation sites. Substrate phosphorylations are greatly reduced in CDKL5 knockout mice, verifying these as physiological substrates. In CDKL5 knockout mouse neurons, dendritic microtubules have longer EB3-labelled plus-end growth duration and these altered dynamics are rescued by reduction of MAP1S levels through shRNA expression, indicating that CDKL5 regulates microtubule dynamics via phosphorylation of MAP1S. We show that phosphorylation by CDKL5 is required for MAP1S dissociation from microtubules. Additionally, anterograde cargo trafficking is compromised in CDKL5 knockout mouse dendrites. Finally, EB2 phosphorylation is reduced in patient-derived human neurons. Our results reveal a novel activity-dependent molecular pathway in dendritic microtubule regulation and suggest a pathological mechanism which may contribute to CDKL5 deficiency disorder.
Keywords: CDKL5; EB2; MAP1S; chemical genetics; microtubule dynamics.
© 2018 The Francis Crick Institute. Published under the terms of the CC BY 4.0 license.
Figures
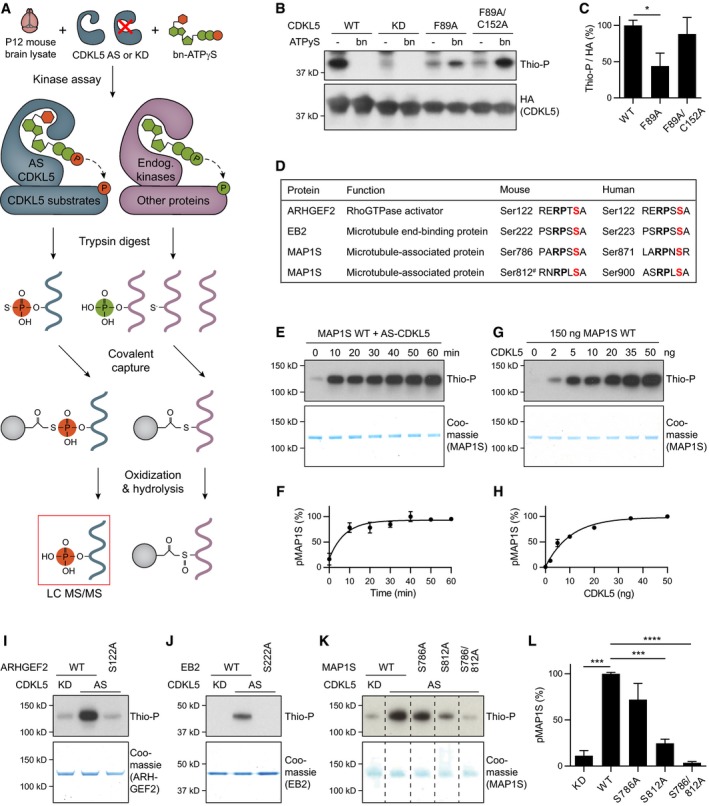
- A
Schematic of chemical genetic kinase substrate identification method. AS‐CDKL5 utilizes benzyl‐ATPγS to thiophosphorylate its substrates. Following trypsin digest, thiol‐containing peptides are captured on iodoacetyl agarose beads. Thiophosphate ester linked peptides are released by oxone induced hydrolysis while cysteine‐containing peptides remain attached. Eluted phosphopeptides are analysed with liquid chromatography‐tandem mass spectrometry (LC‐MS/MS).
- B, C
CDKL51–352 autophosphorylation is shown. WT CDKL5 uses ATPγS, KD is inactive, F89A uses benzyl‐ATPγS with reduced efficiency, F89A/C152A mutant has rescued activity. Quantification of Thio‐P signal is normalized for CDKL5 levels (HA), and KD background is subtracted. Fisher's LSD: n = 4 replicates. bn, benzyl.
- D
A list of novel CDKL5 substrate targets and phosphorylation sites identified. All phosphorylation sites are conserved in human. # MAP1S pS812 is identified based on sequence homology. Red = phosphorylated serine, bold = RPXS consensus sequence.
- E–H
In vitro kinase assays showing efficient MAP1S phosphorylation by CDKL5. 50 ng (40 nM) AS‐CDKL5 phosphorylates 150 ng (50 nM) MAP1S very rapidly (E, F). In 30 min of incubation, 150 ng MAP1S is phosphorylated by small amounts of CDKL5 (G, H). Quantification of phosphorylated MAP1S is normalized to maximum intensity. n = 2 replicates.
- I–L
Western blots of in vitro kinase assays showing loss of phosphorylation in phosphomutants ARHGEF2 S122A (I), EB2 S222A (J) and MAP1S S786/812A (K). Substrate levels are shown by Coomassie staining underneath. MAP1S phosphorylation is quantified in (L). Dunnett's multiple comparison: n = 3 replicates.
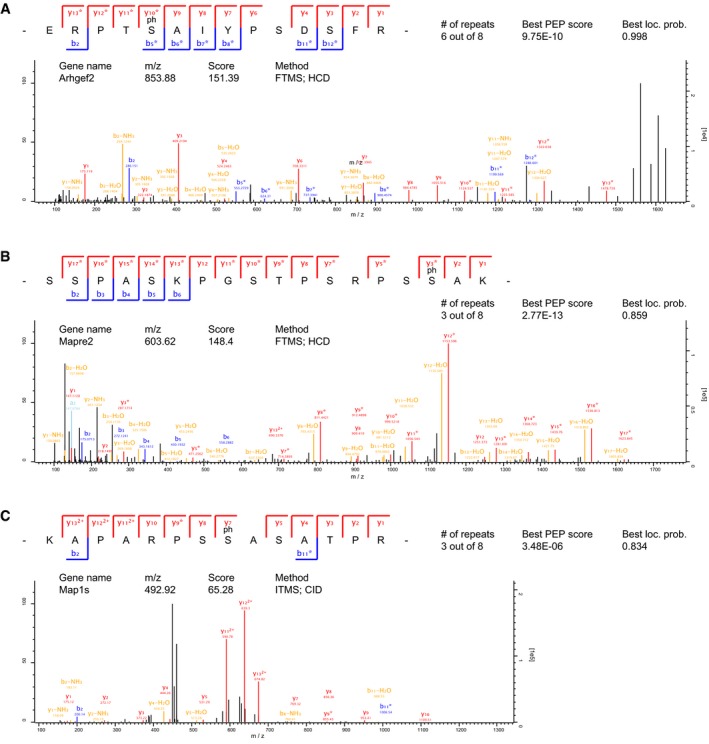
- A–C
Best identification spectra for ARHGEF2 (A), EB2 (B) and MAP1S (C) isolated by chemical genetic covalent capture for CDKL5 substrates. Sequences are determined by product ions of b‐ and y‐series after collision‐induced dissociation (CID) or higher‐energy C‐trap dissociation (HCD). Neutral loss of phosphoric acid generates a product ion series that corresponds only to those ions containing the phosphorylated residue (*). # of repeats represent the number of CDKL5 AS samples in which the specific phosphosite was identified. Only phosphosites never identified in KD samples were considered putative CDKL5 targets.
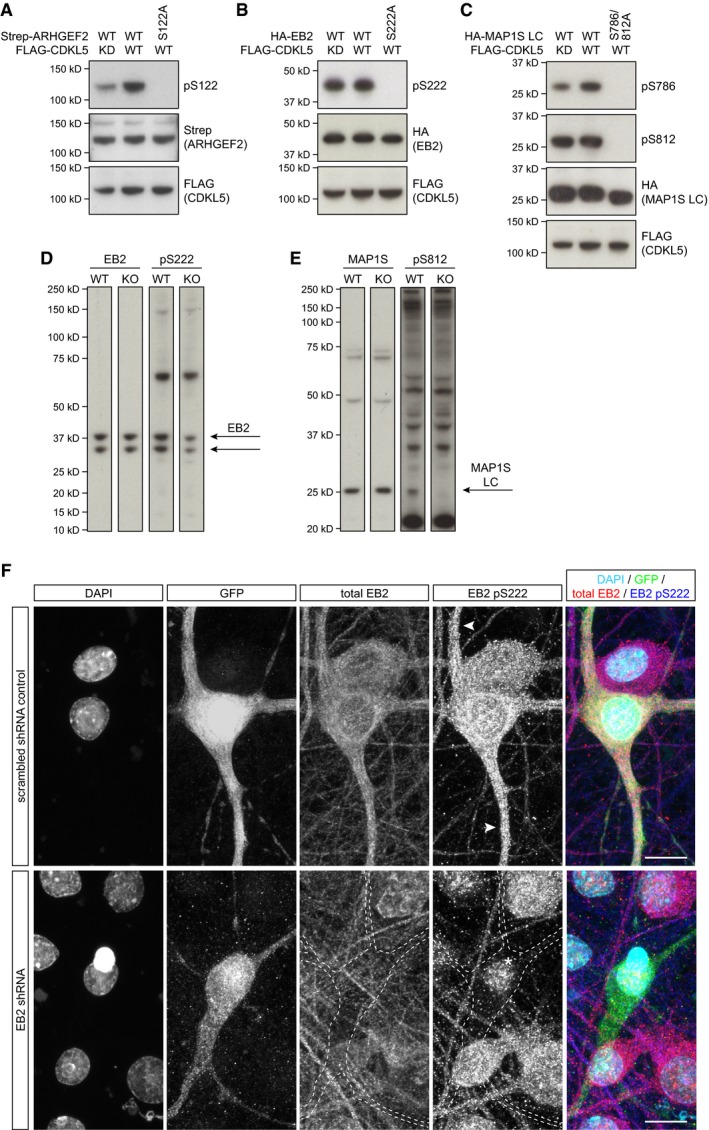
- A–C
HEK293 cells co‐transfected with full‐length WT or KD FLAG‐CDKL5 and Strep‐ARHGEF2 (A), HA‐EB2 (B) or HA‐MAP1S (C) are probed with their respective phosphospecific antibodies. Phosphospecific antibodies do not detect phosphomutants, indicating their specificity. ARHGEF2 pS122 (A) and MAP1S pS786 (C) are increased when WT CDKL5 is expressed. High levels of endogenous EB2 pS222 (B) and MAP1S pS812 (C) are not altered with WT CDKL5. Total levels of kinase (FLAG) and substrate (Strep/HA) are detected by epitope tags.
- D, E
Full molecular weight range of Western blots with mouse P20 cortical lysates probed for total EB2 and EB2 pS222 (D) and MAP1S light chain and MAP1S pS812 (E).
- F
Efficient shRNA‐mediated knockdown of EB2 in rat primary neurons is shown by the specific loss of EB2 staining in transfected cells. Scrambled shRNA was used as a control. EB2 pS222 signal is apparent in dendrites of the control (arrowheads). The remaining nuclear signal of EB2 pS222 after shRNA‐mediated knockdown (*) is considered non‐specific. Scale bar is 10 μm.

- A, B
In vivo substrate phosphorylations are assessed by Western blotting of 5 WT (CDKL5+/Y) and 5 CDKL5 KO (CDKL5−/Y) mouse cortical lysates using phosphospecific antibodies. EB2 pS222 and MAP1S pS812 are dramatically reduced in KOs. Quantification of substrate phosphorylation is normalized for total protein level. Student's t‐test: n = 5 animals per genotype.
- C, D
Developmental expression of CDKL5 and levels of its substrate phosphorylations in P4–P50 cortex. CDKL5‐dependent substrate phosphorylation is quantified by subtracting KO from WT levels for each age. n = 3 animals per age per genotype.
- E, F
Expression of CDKL5 and levels of substrate phosphorylation in P8 Nex‐Cre conditional KO cortex. CDKL5 protein expression is almost completely lost. Quantification of substrate phosphorylation is normalized for total protein level. Student's t‐test: n = 3 animals per genotype.
- G
CDKL5 WT and CDKL5 KO neurons in culture are co‐stained with neuronal dendrite marker MAP2, EB2 and EB2 pS222. EB2 pS222 is lost in CDKL5 KO dendrites. Scale bar is 20 μm.
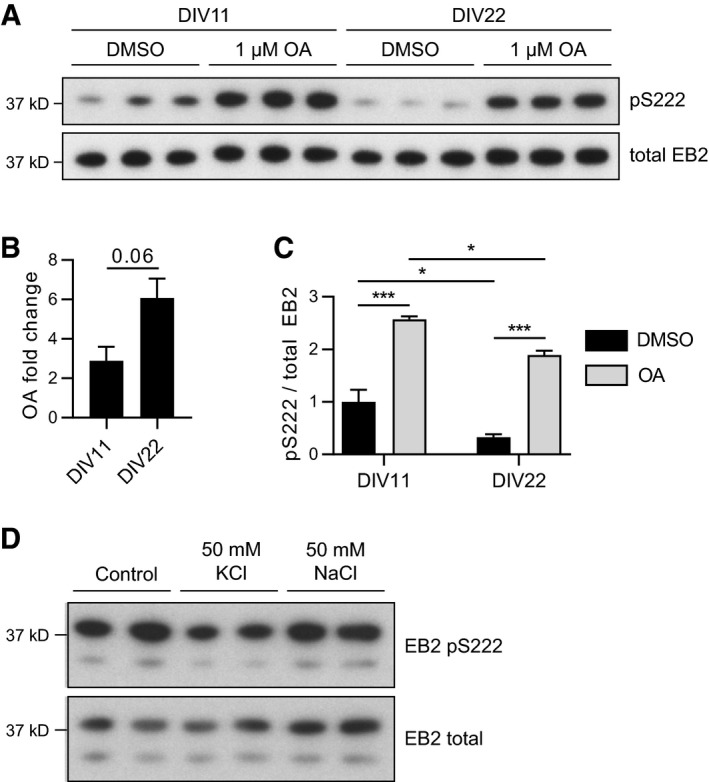
- A–C
Phosphatase activity does not attribute to the reduced EB2 phosphorylation in mature neurons. EB2 phosphorylation is reduced in mature rat primary cortical neurons at DIV22 compared to developing neurons at DIV11. Thirty‐minute treatment with 1 μM okadaic acid (OA) inhibits phosphatases and increases EB2 pS222 signal. The fold change in EB2 pS222 after OA at DIV22 is trending to be larger than at DIV11 (B), but reduced EB2 phosphorylation at DIV22 is not completely rescued by phosphatase inhibition (C). Quantification of EB2 phosphorylation is normalized for total protein level. Student's t‐test (B), Tukey's multiple comparison (C): n = 3 repeats, *P < 0.05, ***P < 0.001, error bars are SEM.
- D
NaCl treatment is a control for the changes in osmolarity induced by KCl without the depolarizing effect. Thirty‐minute treatment of rat primary cortical neurons with 50 mM NaCl did not lead to the reduction in EB2 S222 phosphorylation observed with the same amount of KCl.
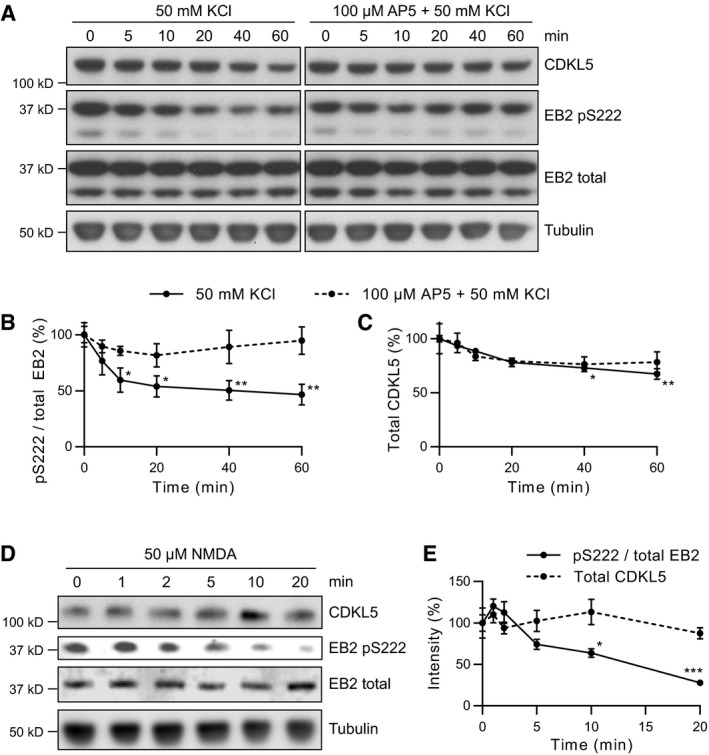
- A–C
Protein lysates were obtained from cortical neuronal cultures treated with 50 mM KCl applied directly to culture media for indicated durations. 100 μm AP5 was used to block NMDAR activity during KCl treatment. Quantification of phosphorylated EB2 (B) and total CDKL5 (C) is normalized to 0 min time point. EB2 phosphorylation is significantly decreased after 10 min of KCl treatment compared to 0 min. CDKL5 protein levels are slightly reduced after 40 min compared to 0 min. Dunnett's multiple comparison: n = 3 replicates.
- D, E
Protein lysates were obtained from cortical neuronal cultures treated with 50 μM NMDA applied directly to culture media for indicated durations. Quantification of phosphorylated EB2 and total CDKL5 is normalized to 0 min time point. EB2 S222 phosphorylation is significantly reduced after 10 min compared to 0 min. Dunnett's multiple comparison: n = 3 replicates.
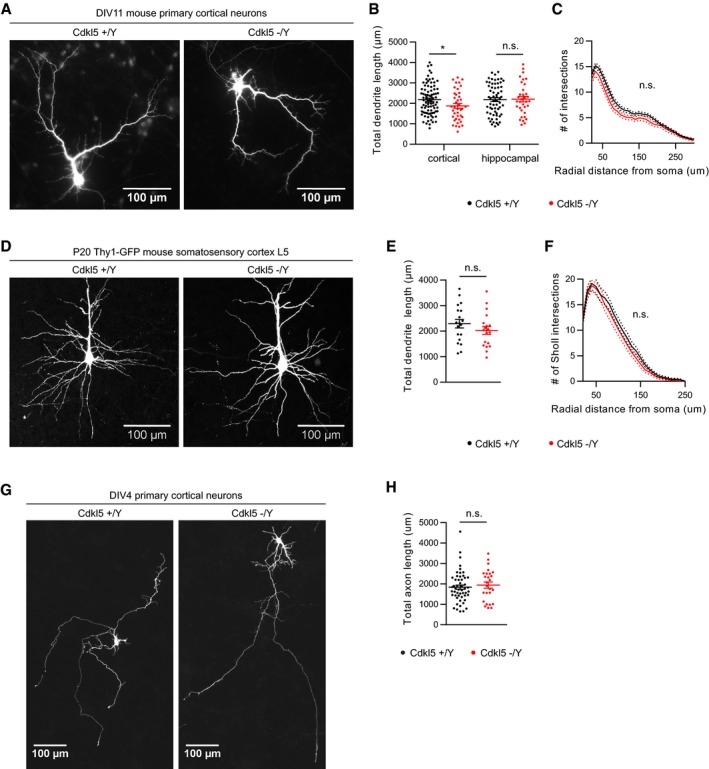
- A–C
Primary cortical or hippocampal neuron cultures are prepared from CDKL5+/Y and CDKL5−/Y littermate embryos. Neurons are transfected with GFP at DIV7 and fixed at DIV11 to analyse dendrite morphology. Representative images of cortical neurons are shown (A). Total dendrite length is slightly reduced in cortical neurons, but not in Ctip2‐negative hippocampal CA3 neurons (B). Sholl analysis of cortical neurons does not reveal specific compartmentalization (C). Student's t‐test: n = 2–4 animals, 34–63 neurons.
- D–F
Layer V pyramidal neuron basal dendrites are examined using thy1‐YFP CDKL5+/Y and CDKL5−/Y mice. Representative images for z‐projected dendrites are shown (D). Dendrite length (E) or Sholl analysis (F) is not different between WT and KO mice. Student's t‐test: n = 4 animals, 19 neurons per genotype.
- G, H
Primary cortical neuron cultures are prepared from CDKL5+/Y and CDKL5−/Y littermate embryos. Neurons are transfected with GFP at DIV2 and fixed at DIV4 to analyse axon morphology. Representative images of cortical neurons are shown (G). Total axon length is not significantly different between CDKL5 WT and KO neurons (H). Student's t‐test: n = 2–4 animals, 26–52 neurons.
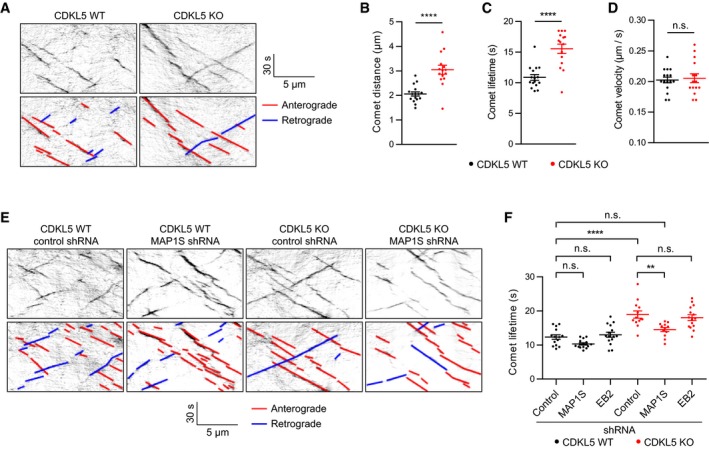
- A
Representative kymographs of EB3‐tdTomato in cortical neuron dendrites at DIV14.
- B–D
In CDKL5 KOs (CDKL5−/Y), comet distance (B) and lifetime (C) are increased when compared to WT (CDKL5+/Y). Comet velocity (D) is unchanged. Student's t‐test: n = 16/615 and 15/381 neurons/comets in WT and KO, respectively.
- E
Representative kymographs of CDKL5 WT and KO neurons transfected with control shRNA and MAP1S shRNA.
- F
Comet lifetime is higher in control shRNA expressing KOs than WTs. MAP1S shRNA expression reduces comet lifetime in KO neurons. EB2 shRNA‐mediated knockdown does not alter microtubule dynamics in WT or KO. Tukey's multiple comparison: n = 12–15 neurons, 388–741 comets per condition.

- A–C
CDKL5‐dependent microtubule dynamics are not dependent on direction. EB3‐tdTomato comet direction is not altered in CDKL5 KOs (A). Comet lifetime is increased in both anterograde and retrograde comets of KO neurons (B). Comet velocity is not changed in CDKL5 KOs when anterograde and retrograde comets are analysed separately (C). Student's t‐test: n = 15–16 neurons, 302–496 anterograde comets, 80–120 retrograde comets.
- D
shRNA‐mediated knockdown showing reduction in rat HA‐MAP1S and mouse HA‐EB2 overexpressed in HEK293 cells.
- E
Two independent shRNAs targeting MAP1S cause reduction in comet lifetime. Dunnett's multiple comparison: n = 7–8 neurons, 284–402 comets.
- F–H
EB3‐tdTomato comet direction (F), density (G) and velocity (H) are unchanged in MAP1S or EB2 shRNA‐expressing mouse cortical cultures. Tukey's multiple comparison: n = 12–15 neurons, 388–741 comets per condition. Black indicates CDKL5 WT and red indicates CDKL5 KO.
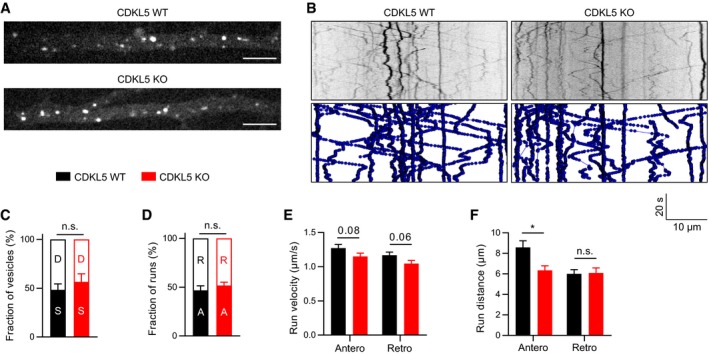
- A, B
Representative stills (A) and kymographs (B) of TrkB‐RFP overexpressed in dendrites of WT and CDKL5 KO DIV14 cortical neurons. Scale bar is 5 μm.
- C, D
No significant change is observed in the ratio of dynamic vs. stationary vesicles (C) or anterograde vs. retrograde runs (D). S, stationary; D, dynamic; A, anterograde; R, retrograde. Vesicles with a net distance > 5 μm were considered dynamic.
- E, F
Both anterograde and retrograde runs show a trend towards reduced velocity in CDKL5 KO neurons (E). Anterograde run lengths are significantly reduced in KO compared to WT neurons (F).
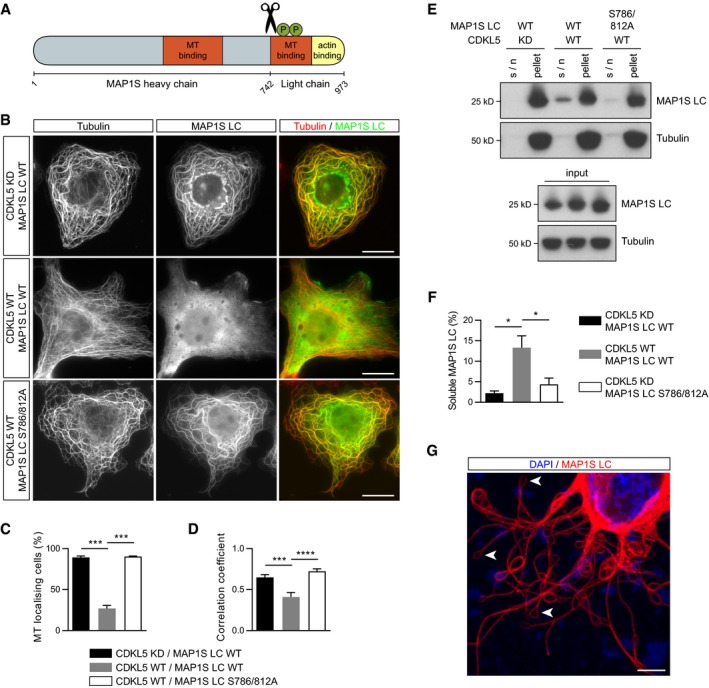
- A
Schematic representation of MAP1S protein domains. Phosphorylation sites S786 and S812 (green Ps) are on the microtubule‐binding domain of MAP1S LC. Scissors indicate proteolytic cleavage.
- B
COS‐7 cells expressing HA‐MAP1S LC, Flag‐CDKL5 WT/kinase‐dead (KD) is shown with endogenous α‐tubulin staining. MAP1S does not localize to microtubules when phosphorylated by CDKL5. Scale bar is 20 μm.
- C, D
The percentage of cells where α‐tubulin and MAP1S LC are colocalized (C) and the quantification of MAP1S LC and α‐tubulin colocalization by Pearson correlation coefficient (D). Tukey's multiple comparison: n = 22–24 cells per condition.
- E, F
Taxol‐stabilized microtubule co‐sedimentation assay shows direct binding of MAP1S LC to microtubules is reduced upon prior phosphorylation by CDKL5. Quantification of soluble MAP1S in the supernatant (s/n) fraction is normalized to the MT‐bound pellet fraction. 3:1 MT:MAP1S LC ratio used here. Tukey's multiple comparison: n = 3 technical repeats.
- G
HA‐MAP1S LC is overexpressed and stained with anti‐HA antibody in cultured cortical neurons (red). Numerous loops at the dendrites' tips are observed (arrowheads). Scale bar is 5 μm.
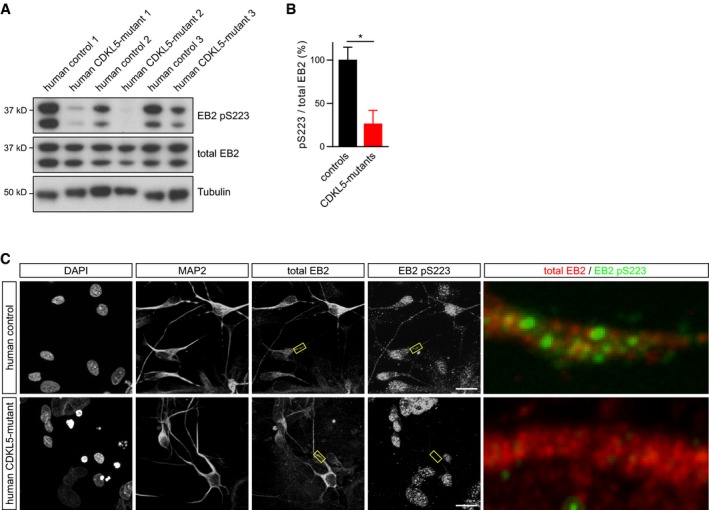
- A, B
Western blots for total EB2, pS223 and tubulin using protein lysates obtained from neurons derived from three patients with CDD and their related control. 1 = p.D135_F154del, male; 2 = p.R59X, male; 3 = p.R59X, female. Quantification of EB2 phosphorylation is normalized for total protein level. Student's t‐test: n = 3 patients/controls. *P < 0.05, error bars are SEM.
- C
Representative images of human iPSC‐derived neurons co‐stained with the neuronal dendrite marker MAP2, EB2 and EB2 pS223. EB2 phosphorylation is present in dendrites of control neurons but not in CDD neurons. Enlarged images of the boxed areas are shown on the right panel. Scale bar is 20 μm.

References
-
- Akhmanova A, Steinmetz MO (2015) Control of microtubule organization and dynamics: two ends in the limelight. Nat Rev Mol Cell Biol 16: 711–726 - PubMed
Publication types
MeSH terms
Substances
Supplementary concepts
Grants and funding
LinkOut - more resources
Full Text Sources
Other Literature Sources
Molecular Biology Databases
Research Materials
Miscellaneous
