. 2018 Sep 28;9(1):3983.
doi: 10.1038/s41467-018-06499-1.

Activatable probes for diagnosing and positioning liver injury and metastatic tumors by multispectral optoacoustic tomography

Affiliations

Activatable probes for diagnosing and positioning liver injury and metastatic tumors by multispectral optoacoustic tomography

Yinglong Wu et al. Nat Commun. .

Abstract

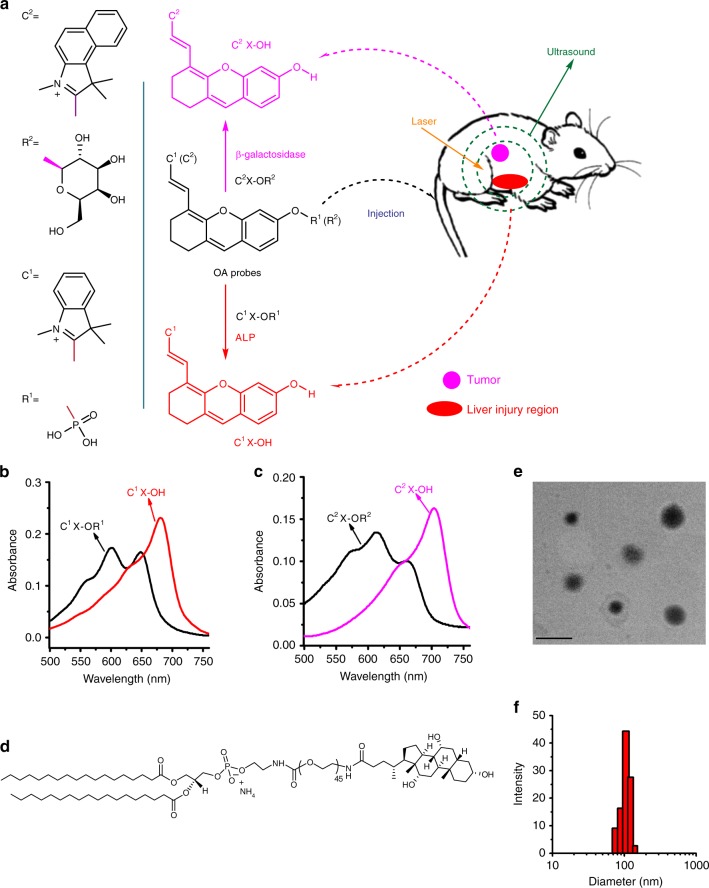
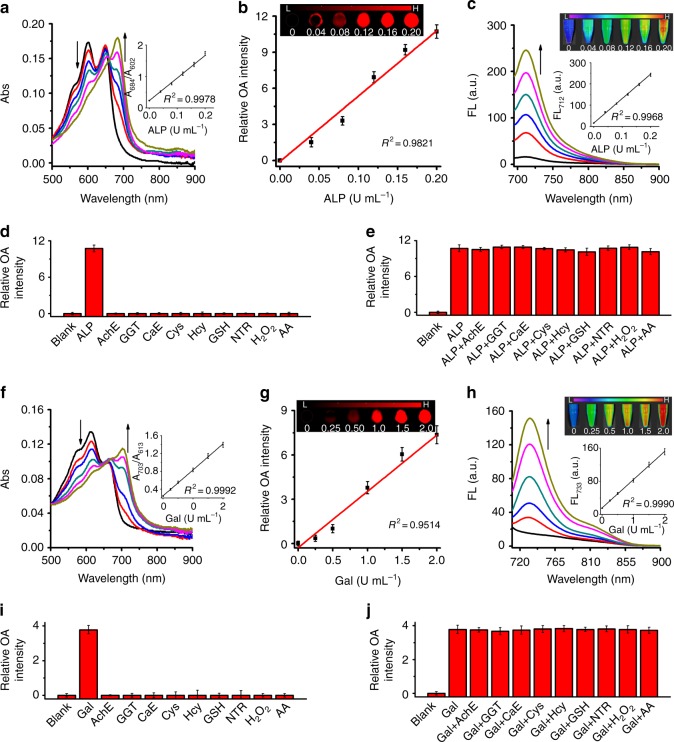
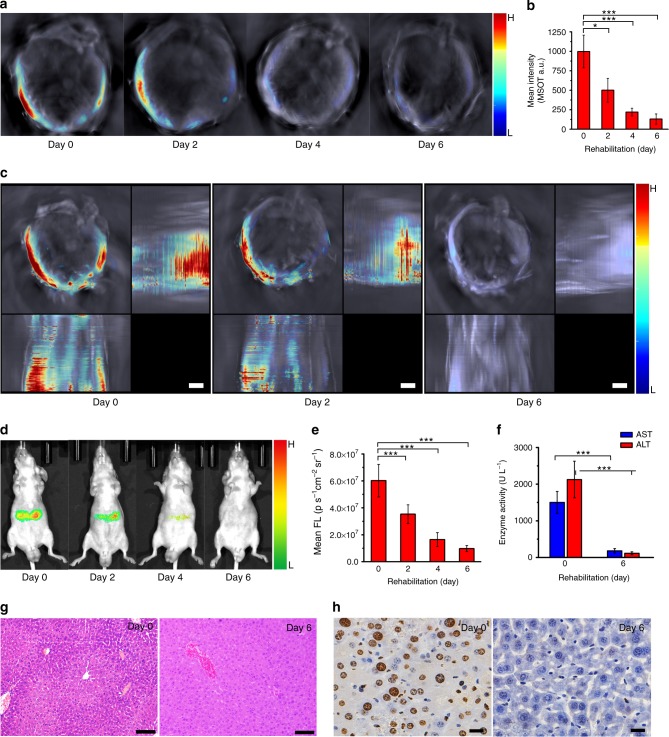
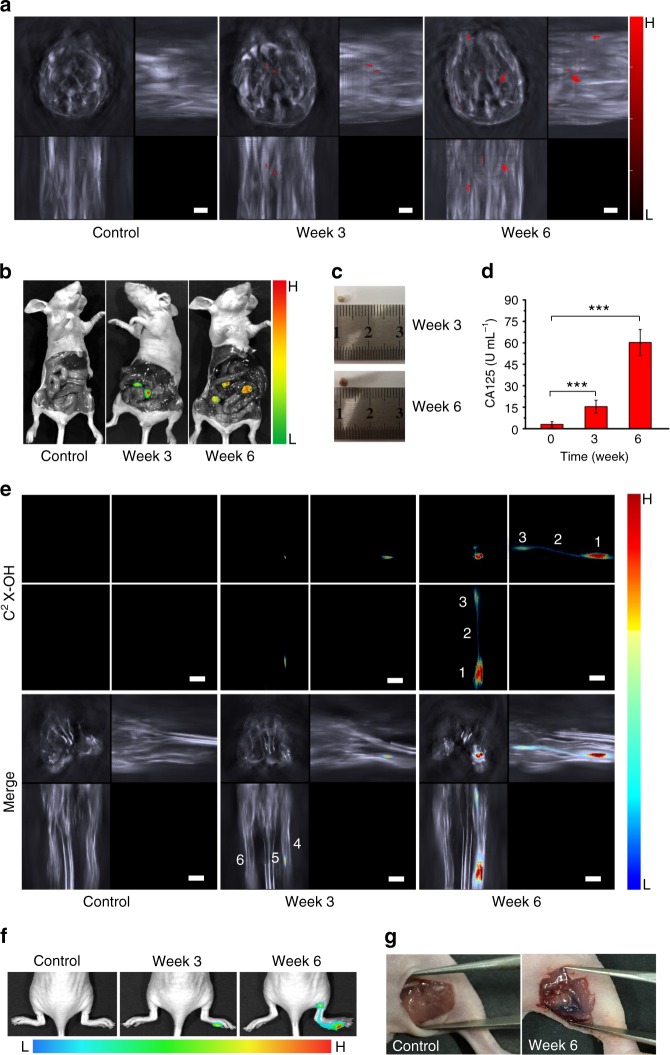
Optoacoustic tomography (photoacoustic tomography) is an emerging imaging technology displaying great potential for medical diagnosis and preclinical research. Rationally designing activatable optoacoustic probes capable of diagnosing diseases and locating their foci can bring into full play the role of optoacoustic tomography (OAT) as a promising noninvasive imaging modality. Here we report two xanthene-based optoacoustic probes (C1X-OR1 and C2X-OR2) for temporospatial imaging of hepatic alkaline phosphatase (or β-galactosidase) for evaluating and locating drug-induced liver injury (or metastatic tumor). The probes rapidly respond to the disease-specific biomarkers by displaying red-shifted NIR absorption bands and generate prominent optoacoustic signals. Using multispectral optoacoustic tomography (MSOT), we can precisely localize the focus of drug-induced liver injury in mice using C1X-OR1, and the metastatic tumors using C2X-OR2. This work suggests that the activatable optoacoustic chromophores may potentially be applied for diagnosing and localizing disease foci, especially smaller and deeper ones.


Conflict of interest statement

The authors declare no competing interests.

Figures

Fig. 1
Fig. 1
Schematic illustration for the probes’ response in vivo and related properties. a Schematic illustration for two xanthene-based molecules (C1X-OR1 and C2X-OR2) as the activatable OA probes for respectively imaging liver injury and metastatic tumor. b and c Absorption spectra for the probes (5 μM) and their corresponding activated forms (C1X-OH and C2X-OH, 3 μM). d Structure of a hepatocyte-targeting phospholipid for liver targeting. e and f Transmission electron microscopic image and particle diameter distribution for a liposomal C1X-OR1 sample. Scale bar: 200 nm
Fig. 2
Fig. 2
Optical responses of C1X-OR1 to ALP and C2X-OR2 to Gal in buffers. a and f Absorption spectra for the probes (5 μM) upon incubation with varied concentrations of corresponding biomarker (0–0.2 U mL−1 for ALP and 0–2 U mL−1 for Gal). The insets show the plots of absorbance ratio vs. biomarker concentration. b and g Optoacoustic response of the probes to corresponding biomarker of varied concentrations (ALP: 0–0.2 U mL−1, Gal: 0–2 U mL−1) (n = 3). The insets show the representative optoacoustic image of the probes in phantom at varied biomarker concentrations (excitation for b and f is 684 nm and 703 nm respectively). c and h Fluorescent spectra for the probes (5 μM) upon incubation with corresponding biomarker of varied concentrations (ALP: 0–0.2 U mL−1, Gal: 0–2 U mL−1). The insets show the plots of fluorescence intensity vs. biomarker concentration. d and i Optoacoustic response of the probes (5 μM) in the presence of 0.2 U mL−1 ALP (1 U mL−1 β-galactosidase) or a potential interference substance. e and j Optoacoustic response of the probes in the presence of ALP (β-galactosidase) and a potential interference substance (n = 3). Error bars represent the standard deviation (SD). Data were represented as mean ± SD
Fig. 3
Fig. 3
Imaging drug-induced liver injury by using C1X-OR1. a Representative cross-sectional MSOT images of a mouse at varied time points upon injection of C1X-OR1. The mouse was pre-treated with 300 mg kg−1 of APAP 12 h in advance. Upper panel: multispectral resolved signal for C1X-OH (activated probe). Lower panel: overlay of C1X-OH’s signal with the grayscale single-wavelength (800 nm) background image. Organ labeling: 1. spinal cord; 2. aorta; 3. liver. The position of spinal cord indicates the mouse lay on its chest with a certain tilt. b Mean optoacoustic intensities at ROI in liver area for the APAP-treated mice at varied time points upon liposomal C1X-OR1 injection (n = 6 per group). c A cryosection image of a male mouse with the cross section’s location comparable to those shown in a. d Representative z-stack orthogonal maximal intensity projection (MIP) images for the mice pretreated with 300 mg kg−1 APAP before and 30 min after injection of the liposomal probe. e Typical cross-sectional MSOT images (with background) of the mice pretreated with varied dose of APAP at 30 min upon probe injection. The images for the probe without background are presented in Supplementary Figure 31a. The spinal cords were labeled with 1 to reflect the mice’s lying position in the chamber. f Mean optoacoustic intensities at ROI in liver area for the mice pretreated with varied dose of APAP (n = 6 per group). g Representative fluorescent images revealing biodistribution of the activated probe for the mice pretreated with varied dose of APAP and injected with the probe. The mice lay on their back during imaging, thus the distribution of fluorescent signal looks different from that of MSOT. h Mean fluorescent intensities at ROI of the mice pretreated with varied dose of APAP (n = 9 per group). i Serum levels of AST and ALT for the mice at 12 h upon treatment with varied dose of APAP (n = 9 per group). The net C1X-OR1 dosage for all imaging is 3.7 mg kg−1. Columns represent means ± SD. The p-values (**p < 0.01, ***p < 0.001) were determined using two-sided Student’s t-test
Fig. 4
Fig. 4
Rehabilitation of liver-injured mice revealed by imaging C1X-OH level. a, Typical cross-sectional MSOT images for the liver-injured mice upon being orally treated with N-acetylcysteine 150 mg kg−1 for varied days. b, Mean MSOT intensity in a ROI for the liver-injured mice upon N-acetylcysteine treatment for varied days (n = 6 per group). c, Representative z-stack orthogonal MIP images for the mice upon treatment for 0, 2 and 6 days (scale bar: 3 mm). d, Representative fluorescent images for the mice upon N-acetylcysteine treatment for varied days. e, Mean fluorescent intensity in a ROI for the mice upon N-acetylcysteine treatment for varied days (n = 9 per group). f, Serum level of AST and ALT for the mice upon N-acetylcysteine treatment for 0 and 6 days (n = 9 per group). g, Representative H&E staining of liver sections for the mice upon N-acetylcysteine treatment for 0 and 6 days (scale bar: 100 μm). h, Representative TUNEL staining of liver sections for the mice upon N-acetylcysteine treatment for 0 and 6 days (scale bar: 20 μm). The administered dose of C1X-OR1 was 3.7 mg kg−1 in mice. Columns represent means ± SD. The p-values (*p < 0.05, ***p < 0.001) were determined using two-sided Student’s t-test
Fig. 5
Fig. 5
Detecting and positioning metastatic tumors by using probe C2X-OR2. a Representative z-stack orthogonal MIP images of the control group and the mice at 3 or 6 weeks upon injection of ovarian cancer cells (OVCAR3) in abdominal cavity. The images are represented by the volumetric signals of anatomical information in grayscale combined with the activated probe’s signal overlaid in red. b Representative fluorescent images for the dissected control and the mice 3 or 6 weeks upon injection of cancer cells. The mice were the same as the corresponding ones shown in (a). c Picture of a typical tumor collected at 3 or 6 weeks after cancer cell injection. d Serum CA125 level for the mice at 0 (control), 3 or 6 weeks after cancer cell injection (n = 9 per group). e Representative z-stack orthogonal MIP images (for lymphatic metastasis) for the control and the mice at 3 or 6 weeks upon injection of SKOV3 at right hind footpad. Labeling: 1. Primary tumor; 2. Lymph vessel; 3. Sentinel lymph node; 4. Right hind leg; 5. Tail; 6. Left hind leg. The legs were in stretched state during imaging. f Representative fluorescent images for the control and the mice at 3 or 6 weeks upon injection of SKOV3 cells. g Pictures of the control and the mice after 6 weeks post-injection of SKOV3 cells. Skin on popliteal position was removed after euthanasia. The administered dose of C2X-OR2 was 6.4 mg kg−1 for peritoneal injection and 0.64 mg kg−1 for footpad injection. Scale bar: 3 mm. Columns represent means ± SD. The p-values (***p < 0.001) were determined using two-sided Student’s t-test

Similar articles

Cited by

References

    1. Zhang J, et al. Remote light-controlled intracellular target recognition by photochromic fluorescent glycoprobes. Nat. Commun. 2017;8:14579. doi: 10.1038/ncomms14579. - DOI - PMC - PubMed
    1. Hong S, Antaris AL, Dai H. Near-infrared fluorophores for biomedical imaging. Nat. Biomed. Eng. 2017;1:0010. doi: 10.1038/s41551-016-0010. - DOI
    1. Zhang P, et al. A two-photon fluorescent sensor revealing drug-induced liver injury via tracking γ-glutamyltranspeptidase (GGT) level in vivo. Biomaterials. 2016;80:46–56. doi: 10.1016/j.biomaterials.2015.11.047. - DOI - PubMed
    1. Wu Y, et al. Pyrene derivative emitting red or near-infrared light with monomer/excimer conversion and its application to ratiometric detection of hypochlorite. ACS Appl. Mater. Interfaces. 2016;8:1511–1519. doi: 10.1021/acsami.5b11023. - DOI - PubMed
    1. Li B, et al. A bioorthogonal nanosystem for imaging and in vivo tumor inhibition. Biomaterials. 2017;138:57–68. doi: 10.1016/j.biomaterials.2017.05.036. - DOI - PubMed

Publication types

Substances