. 2018 Sep 28;9(1):3191.
doi: 10.1038/s41467-018-05653-z.

Deubiquitinase Usp12 functions noncatalytically to induce autophagy and confer neuroprotection in models of Huntington's disease

Affiliations

Deubiquitinase Usp12 functions noncatalytically to induce autophagy and confer neuroprotection in models of Huntington's disease

Rebecca Aron et al. Nat Commun. .

Erratum in

Abstract

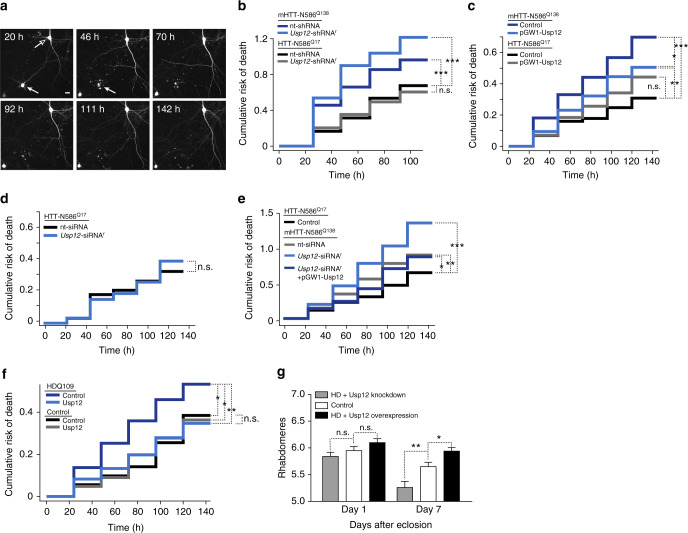
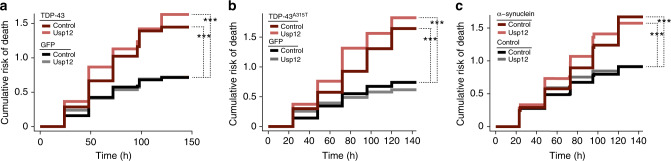
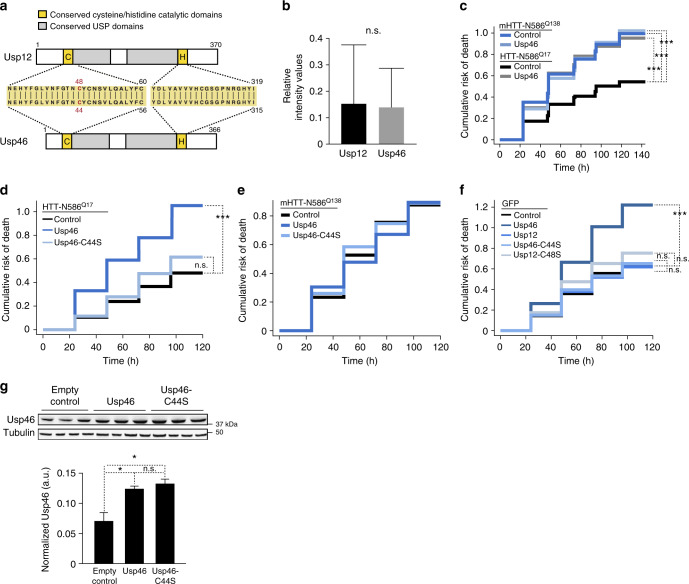
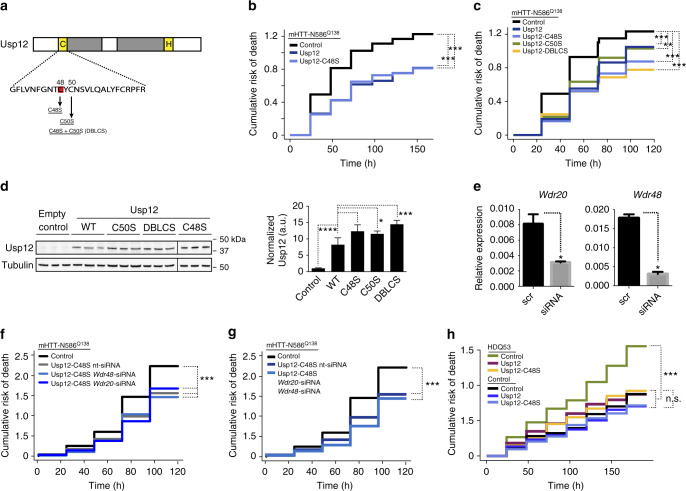
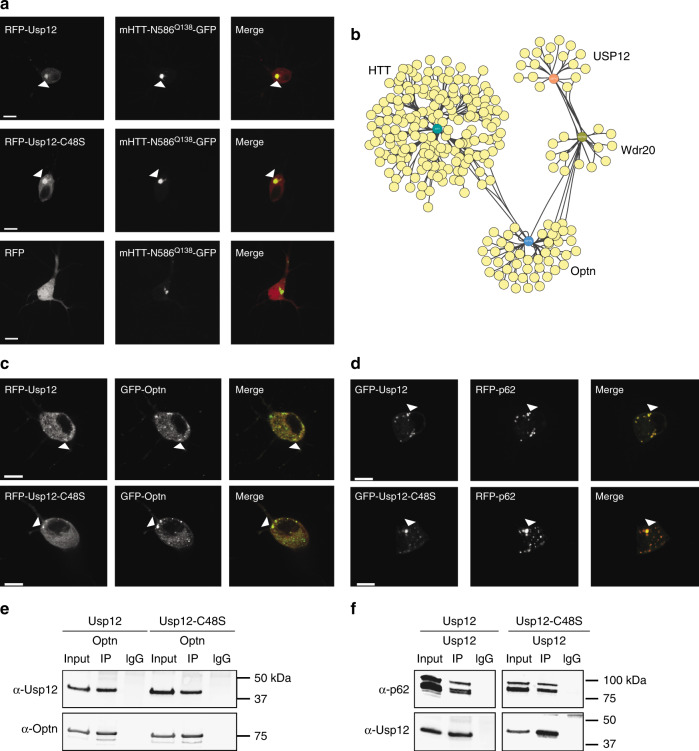
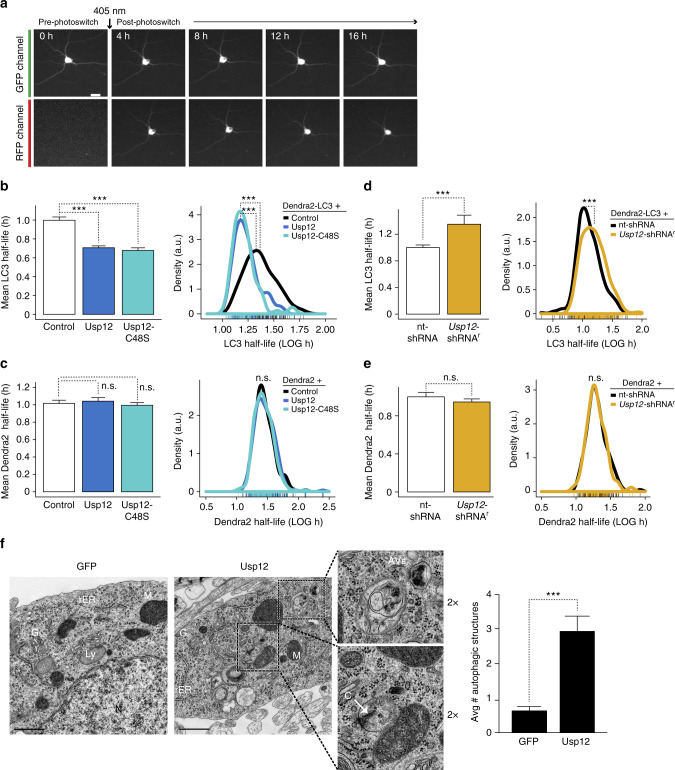
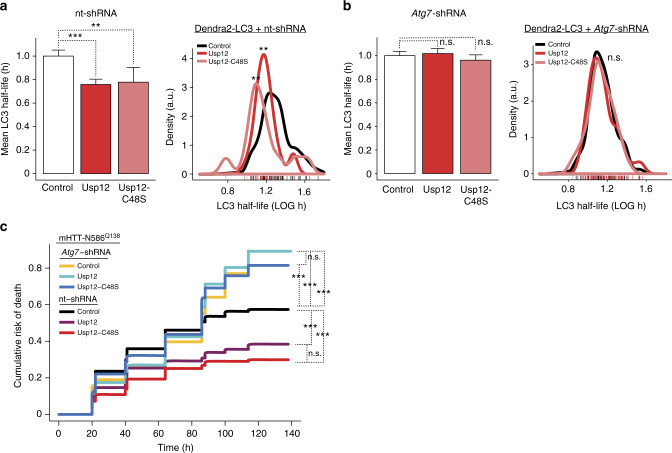
Huntington's disease is a progressive neurodegenerative disorder caused by polyglutamine-expanded mutant huntingtin (mHTT). Here, we show that the deubiquitinase Usp12 rescues mHTT-mediated neurodegeneration in Huntington's disease rodent and patient-derived human neurons, and in Drosophila. The neuroprotective role of Usp12 may be specific amongst related deubiquitinases, as the closely related homolog Usp46 does not suppress mHTT-mediated toxicity. Mechanistically, we identify Usp12 as a potent inducer of neuronal autophagy. Usp12 overexpression accelerates autophagic flux and induces an approximately sixfold increase in autophagic structures as determined by ultrastructural analyses, while suppression of endogenous Usp12 slows autophagy. Surprisingly, the catalytic activity of Usp12 is not required to protect against neurodegeneration or induce autophagy. These findings identify the deubiquitinase Usp12 as a regulator of neuronal proteostasis and mHTT-mediated neurodegeneration.


Conflict of interest statement

The authors declare no competing interests.

Figures

Fig. 1
Fig. 1
Usp12 is a modifier of mHTT toxicity in vitro and in vivo. a Representative images of primary neurons expressing RFP captured at the indicated time intervals after transfection. Expression of RFP is used as a morphological marker to track the survival of neurons by a robotic microscope. Examples of neurons that survived the entire time course of observation (empty arrowhead) or died by 46 h post transfection (filled arrowhead) are shown (scale bar = 20 µm). be Cumulative risk of death plots of primary rodent cortical neurons. The cumulative risk of neuron death is plotted against time (h) for each group of neurons transfected with the indicated plasmids. Cox proportional hazards analysis was used to estimate the relative risk of death or hazard ratio (HR), and the p value was determined with the log rank test (*p < 0.05, **p < 0.01, ***p < 0.001, n.s. not significant) (for statistical information, see Supplementary Tables 1, 2, and 3). f Survival analysis of human neurons differentiated from patient-derived iPSCs (unaffected individual, control; HD patient, HDQ109) transfected with MAP2-RFP (morphology marker), and Usp12 or control vectors (statistical information is summarized in Supplementary Table 3). g Quantification of average rhabdomeres per ommatidium at day 1 and day 7 after eclosion. Two-way ANOVA: genotype effects, p < 0.0001; age effects, p < 0.0001, n = 8–10 flies per genotype. Multiple comparisons analysis: day 1 genotype analysis for control vs. Usp12 knockdown (p = 0.7020) and control vs. Usp12 overexpression (p = 0.3589); day 7 genotype analysis for control vs. Usp12 knockdown (p = 0.0041) and control vs. Usp12 overexpression (p = 0.0270). n.s. not significant; *p < 0.05; **p < 0.01. Two-way ANOVA with Bonferroni’s multiple comparisons post hoc test. Error bars represent s.e.m.
Fig. 2
Fig. 2
Usp12 overexpression is not a generic suppressor of neurotoxicity. ac Cumulative risk of death plots for primary neurons co-transfected with control, TDP-43 (a), TDP-43A315T (b), α-synuclein (c), and Usp12 or empty vector control plasmids. Cox proportional hazards analysis was used to estimate the relative risk of death, or hazard ratio (HR), and the p value was determined with the log rank test (***p < 0.001) (Supplementary Table 4)
Fig. 3
Fig. 3
Differential effects of Usp12 and Usp46 on mHTT toxicity and neuronal survival. a Schematic representation of Usp12 and Usp46 protein domain structure with sequence alignment of the conserved regions at the active-site cysteine and histidine domains (highlighted in yellow). b Relative intensity values of primary neurons transfected with GFP-Usp12 (n = 47) and GFP-Usp46 (n = 46) plasmids normalized to RFP control. Data are representative of three independent experiments and values are expressed as mean ± s.d. p Value (p = 0.72) was determined with unpaired t test. ce Cumulative hazard plots for primary neurons co-transfected with HTT-N568Q17 or mHTT-N568Q138, and Usp46 or Usp46-C44S and controls. f Neuronal toxicity of Usp12 and Usp46 co-transfected with GFP control. Cox proportional hazards analysis was used to estimate the relative risk of death, or hazard ratio (HR), and the p value was determined with the log rank test (***p < 0.001) (Supplementary Table 5). g Expression and stability of Usp46 and Usp46-C44S are equivalent in PC12 cells transfected with these plasmids. PC12 cells co-transfected with empty vector, Usp46, or Usp46-C44S expression constructs were lysed and subjected to SDS-PAGE and immunoblotting with Usp46 antibody. Tubulin was assayed as a loading control. One-way ANOVA, multiple comparison. Normalized Usp46 intensity of the empty vector vs. Usp46 (p = 0.0457), empty vector vs. Usp46-C44S (p = 0.0138), and Usp46 vs. Usp46-C44S (p = 0.5855, s.e.m. are shown)
Fig. 4
Fig. 4
Deubiquitinating activity of Usp12 is not required for suppression of mHTT toxicity. a Schematic representation of Usp12 domain structure. The conserved active-site cysteine (C48) is highlighted in red. b, c Cumulative risk of death plots for primary neurons co-transfected with mHTT-N568Q138 and Usp12, Usp12 mutants that lack deubiquitinating activity in vitro (Usp12-C48S), or retain activity (Usp12-C50S), Usp12 containing both mutations (Usp12-DBLCS), or empty vector control; statistical data are summarized in Table 2. d Expression of Usp12 and Usp12 mutants in HEK cells transfected with these plasmids. Usp12-C48S samples are from a separate gel. Tubulin was assayed as a loading control, s.e. are shown. One-way ANOVA with multiple comparisons, ****p < 0.0001, ***p < 0.001, *p < 0.05. e Relative Wdr20 and Wdr48 mRNA levels of a rat C6 cell line transfected with Wdr20 and Wdr48 siRNAs, respectively. *p < 0.01, s.e.m. are shown. f, g Cumulative risk of death plots for primary neurons co-transfected with mHTT-N568Q138, Usp12-C48S, and siRNAs against either Wdr20 or Wdr48 (f) or both (g). HR was used to estimate the relative risk of death and results are summarized in Supplementary Table 6. h Survival analysis of human neurons differentiated from patient-derived iPSCs (unaffected individual, control; HD patient, HDQ53). Cox proportional hazards analysis was used to estimate the relative risk of death, or hazard ratio (HR), and the p value was determined with the log rank test (*p < 0.05, **p < 0.01, ***p < 0.001) (Table 3)
Fig. 5
Fig. 5
Usp12 localizes to mHTT-N586Q138 inclusion bodies and autophagy receptors. a Representative images of RFP-Usp12 and mHTT-N568Q138-GFP expression and localization in primary neurons. Images were captured in live cells approximately 48 h after transfection. Co-localization of Usp12 puncta and IBs is indicated (arrowheads). b Map of protein interaction networks between HTT, Usp12, Wdr20, and Optn, based on data collection in BioGRID. Detailed map is in Supplementary Fig. 7. c Representative images of GFP- or RFP-Usp12 and -Usp12-C48S neurons co-transfected with either GFP-Optn or d RFP-p62 and treated with NH4Cl. Co-localization of Usp12 and Optineurin or p62 puncta is indicated (arrowheads), scale bar = 10 µm. e, f Immunoprecipitation of Optn (e) or Usp12 (f), followed by immunoblotting with anti-Usp12, anti-Optn, or anti-p62 antibodies in HEK cells transfected with Usp12, Usp12-C48S, Optn, or RFP-p62 as indicated
Fig. 6
Fig. 6
Usp12 modulates autophagy in neurons. a Representative images of an optical pulse-labeling experiment to measure Dendra2 or Dendra2-LC3 half-life in living neurons. Dendra2 protein is observed in neurons in the green fluorescence channel before and after 405 nm pulse photoswitch, but Dendra2 in the red fluorescence channel is only observed after the photoswitching pulse (scale bar = 20 µm). b Left panel, mean half-life of photoconverted Dendra2-LC3 in Usp12 or Usp12-C48S compared to control. Right panel, density plot showing distribution of Dendra2-LC3 half-lives in individual neurons expressing empty vector control, Usp12, or Usp12-C48S. c Usp12 or Usp12-C48S does not affect mean control protein Dendra2 half-life (left panel) or half-life distributions in individual neurons (right panel). d Mean half-life of Dendra2-LC3 (left panel) in Usp12-shRNAr-expressing neurons compared to a non-targeting (nt) shRNA; (right panel) density plots. e Graphs of mean half-life (left) and density plots (right) of Dendra2 control in nt-shRNA or Usp12-shRNAr neurons. Number of neurons per group—Dendra2-LC3+: empty vector, n = 121; Usp12, n = 121; Usp12-C48S, n = 81; nt-shRNA, n = 341; Usp12-shRNAr, n = 328; Dendra2+: empty vector, n = 162; Usp12, n = 210; Usp12-C48S, n = 173; nt-shRNA, n = 160; Usp12-shRNAr, n = 130. p Value for mean half-life and distributions determined by Mann-Whitney and Kolmogorov-Smirnov tests, respectively (***p < 0.001). f Electron micrographs and quantification of autophagic structures in neurons transduced with Usp12 or GFP lentivirus. AV autophagic vacuoles, C curving phagophore, M mitochondria, G Golgi, rER rough endoplasmic reticulum, Ly lysosome, N nucleus. Quantification of autophagic structures represents the average number of autophagic vacuoles (pre-autophagic, autophagosome, and autolysosome structures) per EM image (×4000 micrograph). GFP, n = 28 images; Usp12, n = 33 images. Scale bar = 1 µm. Error bars represent s.e.m. (***p < 0.001). Scale bar = 1 µm
Fig. 7
Fig. 7
Usp12 function in LC3 turnover and mHTT-mediated toxicity is impaired in neurons genetically depleted of Atg7. a, b LC3 half-life was measured in neurons co-transfected with nt-shRNA or Atg7-shRNA, Usp12, Usp12-C48S, or control plasmids, and Dendra2-LC3 using the optical pulse-labeling assay described above. P value for mean half-life and distributions determined by Mann-Whitney and Kolmogorov-Smirnov tests, respectively. Error bars represent s.e.m. (**p < 0.01, ***p < 0.001). c Cumulative risk of death plots for neurons co-transfected with toxic mHTT and Usp12 overexpression or shRNA plasmids. Usp12 and Usp12-C48S do not effect neuroprotection during inhibition of Atg7-dependent autophagy. Cox proportional hazards analysis was used to estimate the relative risk of death, or hazard ratio (HR) and the p values were determined with the log rank test (***p < 0.001) (Supplementary Table 9)

References

    1. Gidalevitz T, et al. Progressive disruption of cellular protein folding in models of polyglutamine diseases. Science. 2006;311:1471–1474. doi: 10.1126/science.1124514. - DOI - PubMed
    1. Shao J, Diamond MI. Polyglutamine diseases: emerging concepts in pathogenesis and therapy. Hum. Mol. Genet. 2007;16 Spec No. 2:R115–R123. doi: 10.1093/hmg/ddm213. - DOI - PubMed
    1. Gusella JF, MacDonald ME. Huntington’s disease: the case for genetic modifiers. Genome Med. 2009;1:80. doi: 10.1186/gm80. - DOI - PMC - PubMed
    1. Willingham S, et al. Yeast genes that enhance the toxicity of a mutant huntingtin fragment or alpha-synuclein. Science. 2003;302:1769–1772. doi: 10.1126/science.1090389. - DOI - PubMed
    1. Giorgini F, et al. A genomic screen in yeast implicates kynurenine 3-monooxygenase as a therapeutic target for Huntington disease. Nat. Genet. 2005;37:526–531. doi: 10.1038/ng1542. - DOI - PMC - PubMed

Publication types

MeSH terms