

On-chip spatiotemporal electrophysiological analysis of human stem cell derived cardiomyocytes enables quantitative assessment of proarrhythmia in drug development
- PMID: 30266924
- PMCID: PMC6162288
- DOI: 10.1038/s41598-018-32921-1
On-chip spatiotemporal electrophysiological analysis of human stem cell derived cardiomyocytes enables quantitative assessment of proarrhythmia in drug development
Abstract
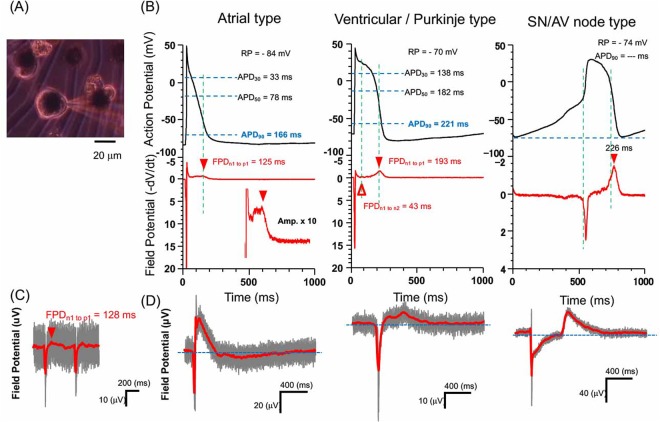
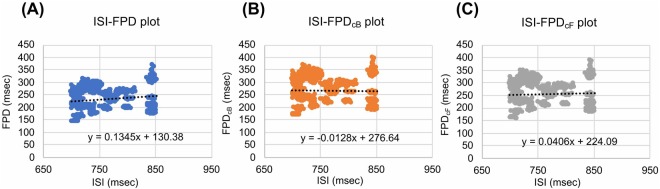
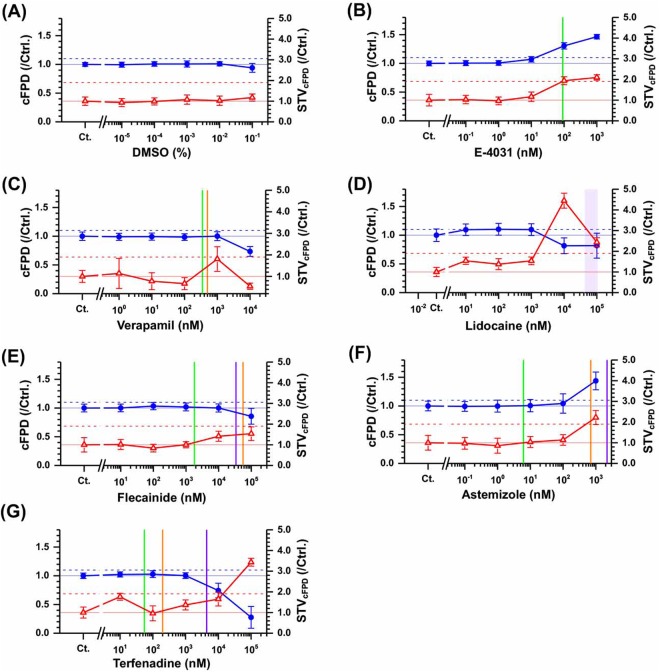
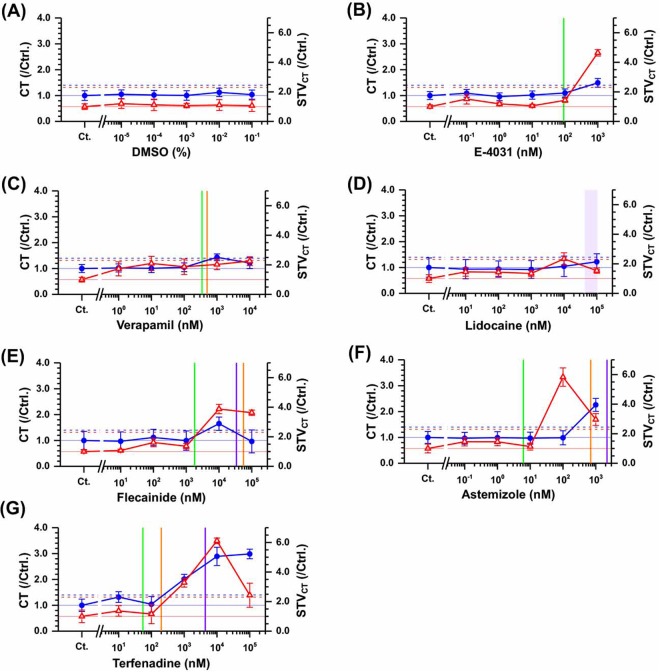
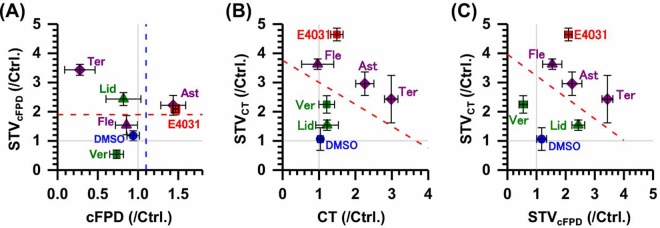
We examined a simultaneous combined spatiotemporal field potential duration (FPD) and cell-to-cell conduction time (CT) in lined-up shaped human embryonic stem cell-derived cardiomyocytes (hESC-CMs) using an on-chip multielectrode array (MEA) system to evaluate two origins of lethal arrhythmia, repolarization and depolarization. The repolarization index, FPD, was prolonged by E-4031 and astemizole, and shortened by verapamil, flecainide and terfenadine at 10 times higher than therapeutic plasma concentrations of each drug, but it did not change after lidocaine treatment up to 100 μM. CT was increased by astemizol, flecainide, terfenadine, and lidocaine at equivalent concentrations of Nav1.5 IC50, suggesting that CT may be an index of cardiac depolarization because the increase in CT (i.e., decrease in cell-to-cell conduction speed) was relevant to Nav1.5 inhibition. Fluctuations (short-term variability; STV) of FPD and CT, STVFPD and STVCT also discriminated between torsadogenic and non-torsadogenic compounds with significant increases in their fluctuation values, enabling precise prediction of arrhythmogenic risk as potential new indices.
Conflict of interest statement
A part of the authors (Yu.A., Ya.A., K.T. and A.S.) are employees of Daiichi-Sankyo Co. Ltd. All the other authors declare that they have no competing interests.
Figures

Similar articles
-
CSAHi study: Evaluation of multi-electrode array in combination with human iPS cell-derived cardiomyocytes to predict drug-induced QT prolongation and arrhythmia--effects of 7 reference compounds at 10 facilities.J Pharmacol Toxicol Methods. 2016 Mar-Apr;78:93-102. doi: 10.1016/j.vascn.2015.12.002. Epub 2015 Dec 4. J Pharmacol Toxicol Methods. 2016. PMID: 26657830
-
On-chip in vitro cell-network pre-clinical cardiac toxicity using spatiotemporal human cardiomyocyte measurement on a chip.Sci Rep. 2014 Apr 22;4:4670. doi: 10.1038/srep04670. Sci Rep. 2014. PMID: 24751527 Free PMC article.
-
Electrophysiological characteristics and pharmacological sensitivity of two lines of human induced pluripotent stem cell derived cardiomyocytes coming from two different suppliers.J Pharmacol Toxicol Methods. 2018 Mar-Apr;90:58-66. doi: 10.1016/j.vascn.2017.12.003. Epub 2017 Dec 20. J Pharmacol Toxicol Methods. 2018. PMID: 29274391
-
Cardiotoxicity Assessment of Drugs Using Human iPS Cell-Derived Cardiomyocytes: Toward Proarrhythmic Risk and Cardio-Oncology.Curr Pharm Biotechnol. 2020;21(9):765-772. doi: 10.2174/1389201020666190628143345. Curr Pharm Biotechnol. 2020. PMID: 31264543 Review.
-
Development of torsadogenic risk assessment using human induced pluripotent stem cell-derived cardiomyocytes: Japan iPS Cardiac Safety Assessment (JiCSA) update.J Pharmacol Sci. 2018 Dec;138(4):233-239. doi: 10.1016/j.jphs.2018.10.010. Epub 2018 Oct 24. J Pharmacol Sci. 2018. PMID: 30415824 Review.
Cited by
-
Geometric Understanding of Local Fluctuation Distribution of Conduction Time in Lined-Up Cardiomyocyte Network in Agarose-Microfabrication Multi-Electrode Measurement Assay.Micromachines (Basel). 2020 Dec 14;11(12):1105. doi: 10.3390/mi11121105. Micromachines (Basel). 2020. PMID: 33327568 Free PMC article.
-
hiPSC-Derived Cardiomyocyte Model of LQT2 Syndrome Derived from Asymptomatic and Symptomatic Mutation Carriers Reproduces Clinical Differences in Aggregates but Not in Single Cells.Cells. 2020 May 7;9(5):1153. doi: 10.3390/cells9051153. Cells. 2020. PMID: 32392813 Free PMC article.
-
Dexmedetomidine exhibits antiarrhythmic effects on human-induced pluripotent stem cell-derived cardiomyocytes through a Na/Ca channel-mediated mechanism.Ann Transl Med. 2021 Mar;9(5):399. doi: 10.21037/atm-20-5898. Ann Transl Med. 2021. PMID: 33842620 Free PMC article.
-
Dominant rule of community effect in synchronized beating behavior of cardiomyocyte networks.Biophys Rev. 2020 Apr;12(2):481-501. doi: 10.1007/s12551-020-00688-3. Epub 2020 May 4. Biophys Rev. 2020. PMID: 32367300 Free PMC article. Review.
-
The adipose-neural axis is involved in epicardial adipose tissue-related cardiac arrhythmias.Cell Rep Med. 2024 May 21;5(5):101559. doi: 10.1016/j.xcrm.2024.101559. Epub 2024 May 13. Cell Rep Med. 2024. PMID: 38744275 Free PMC article.
References
-
- Ando Hiroyuki, Yoshinaga Takashi, Yamamoto Wataru, Asakura Keiichi, Uda Takaaki, Taniguchi Tomohiko, Ojima Atsuko, Shinkyo Raku, Kikuchi Kiyomi, Osada Tomoharu, Hayashi Seiji, Kasai Chieko, Miyamoto Norimasa, Tashibu Hiroyuki, Yamazaki Daiju, Sugiyama Atsushi, Kanda Yasunari, Sawada Kohei, Sekino Yuko. A new paradigm for drug-induced torsadogenic risk assessment using human iPS cell-derived cardiomyocytes. Journal of Pharmacological and Toxicological Methods. 2017;84:111–127. doi: 10.1016/j.vascn.2016.12.003. - DOI - PubMed
-
- Kitaguchi Takashi, Moriyama Yuta, Taniguchi Tomohiko, Ojima Atsuko, Ando Hiroyuki, Uda Takaaki, Otabe Koji, Oguchi Masao, Shimizu Shigekazu, Saito Hiroyuki, Morita Maya, Toratani Atsushi, Asayama Mahoko, Yamamoto Wataru, Matsumoto Emi, Saji Daisuke, Ohnaka Hiroki, Tanaka Kohji, Washio Ikumi, Miyamoto Norimasa. CSAHi study: Evaluation of multi-electrode array in combination with human iPS cell-derived cardiomyocytes to predict drug-induced QT prolongation and arrhythmia — Effects of 7 reference compounds at 10 facilities. Journal of Pharmacological and Toxicological Methods. 2016;78:93–102. doi: 10.1016/j.vascn.2015.12.002. - DOI - PubMed
Publication types
MeSH terms
LinkOut - more resources
Full Text Sources
Other Literature Sources
Medical
